Awesome


![]()
What is it?
D-Tale is the combination of a Flask back-end and a React front-end to bring you an easy way to view & analyze Pandas data structures. It integrates seamlessly with ipython notebooks & python/ipython terminals. Currently this tool supports such Pandas objects as DataFrame, Series, MultiIndex, DatetimeIndex & RangeIndex.
Origins
D-Tale was the product of a SAS to Python conversion. What was originally a perl script wrapper on top of SAS's insight function is now a lightweight web client on top of Pandas data structures.
In The News
- 4 Libraries that can perform EDA in one line of python code
- React Status
- KDNuggets
- Man Institute (warning: contains deprecated functionality)
- Python Bytes
- FlaskCon 2020
- San Diego Python
- Medium: towards data science
- Medium: Exploratory Data Analysis – Using D-Tale
- EOD Notes: Using python and dtale to analyze correlations
- Data Exploration is Now Super Easy w/ D-Tale
- Practical Business Python
Tutorials
- Pip Install Python YouTube Channel
- machine_learning_2019
- D-Tale The Best Library To Perform Exploratory Data Analysis Using Single Line Of Code🔥🔥🔥🔥
- Explore and Analyze Pandas Data Structures w/ D-Tale
- Data Preprocessing simplest method 🔥
Related Resources
- Adventures In Flask While Developing D-Tale
- Adding Range Selection to react-virtualized
- Building Draggable/Resizable Modals
- Embedding Flask Apps within Streamlit
Contents
- Where To Get It
- Getting Started
- Python Terminal
- As A Script
- Jupyter Notebook
- Jupyterhub w/ Jupyter Server Proxy
- Jupyterhub w/ Kubernetes
- Docker Container
- Google Colab
- Kaggle
- Binder
- R with Reticulate
- Startup with No Data
- Command-line
- Custom Command-line Loaders
- Embedding Within Your Own Flask App
- Embedding Within Your Own Django App
- Embedding Within Streamlit
- Running D-Tale On Gunicorn w/ Redis
- Configuration
- Authentication
- Predefined Filters
- Using Swifter
- Behavior for Wide Dataframes
- UI
- Dimensions/Ribbon Menu/Main Menu
- Header
- Resize Columns
- Editing Cells
- Copy Cells Into Clipboard
- Main Menu Functions
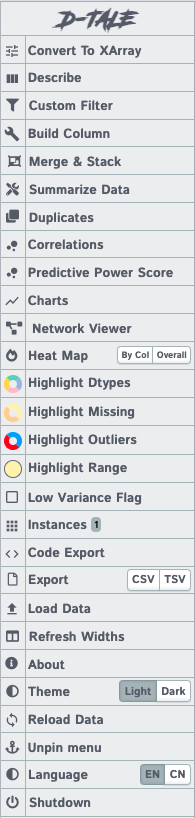
- XArray Operations, Describe, Outlier Detection, Custom Filter, Dataframe Functions, Merge & Stack, Summarize Data, Duplicates, Missing Analysis, Correlations, Predictive Power Score, Heat Map, Highlight Dtypes, Highlight Missing, Highlight Outliers, Highlight Range, Low Variance Flag, Instances, Code Exports, Export CSV, Load Data & Sample Datasets, Refresh Widths, About, Theme, Reload Data, Unpin/Pin Menu, Language, Shutdown
- Column Menu Functions
- Charts
- Network Viewer
- Hotkeys
- Menu Functions Depending on Browser Dimensions
- For Developers
- Global State/Data Storage
- Startup Behavior
- Documentation
- Dependencies
- Acknowledgements
- License
Where To get It
The source code is currently hosted on GitHub at: https://github.com/man-group/dtale
Binary installers for the latest released version are available at the Python package index and on conda using conda-forge.
# conda
conda install dtale -c conda-forge
# if you want to also use "Export to PNG" for charts
conda install -c plotly python-kaleido
# or PyPI
pip install dtale
Getting Started
| PyCharm | jupyter |
|---|---|
 |  |
Python Terminal
This comes courtesy of PyCharm
 Feel free to invoke
 python or ipython directly and use the commands in the screenshot above and it should work
Issues With Windows Firewall
If you run into issues with viewing D-Tale in your browser on Windows please try making Python public under "Allowed Apps" in your Firewall configuration. Here is a nice article: How to Allow Apps to Communicate Through the Windows Firewall
Additional functions available programmatically
import dtale
import pandas as pd

df = pd.DataFrame([dict(a=1,b=2,c=3)])

# Assigning a reference to a running D-Tale process.
d = dtale.show(df)

# Accessing data associated with D-Tale process.
tmp = d.data.copy()
tmp['d'] = 4

# Altering data associated with D-Tale process
# FYI: this will clear any front-end settings you have at the time for this process (filter, sorts, formatting)
d.data = tmp

# Get raw dataframe w/ any sorting or edits made through the UI
d.data

# Get raw dataframe similar to '.data' along with any filters applied using the UI
d.view_data

# Shutting down D-Tale process
d.kill()

# Using Python's `webbrowser` package it will try and open your server's default browser to this process.
d.open_browser()

# There is also some helpful metadata about the process.
d._data_id  # The process's data identifier.
d._url  # The url to access the process.

d2 = dtale.get_instance(d._data_id)  # Returns a new reference to the instance running at that data_id.

dtale.instances()  # Prints a list of all ids & urls of running D-Tale sessions.
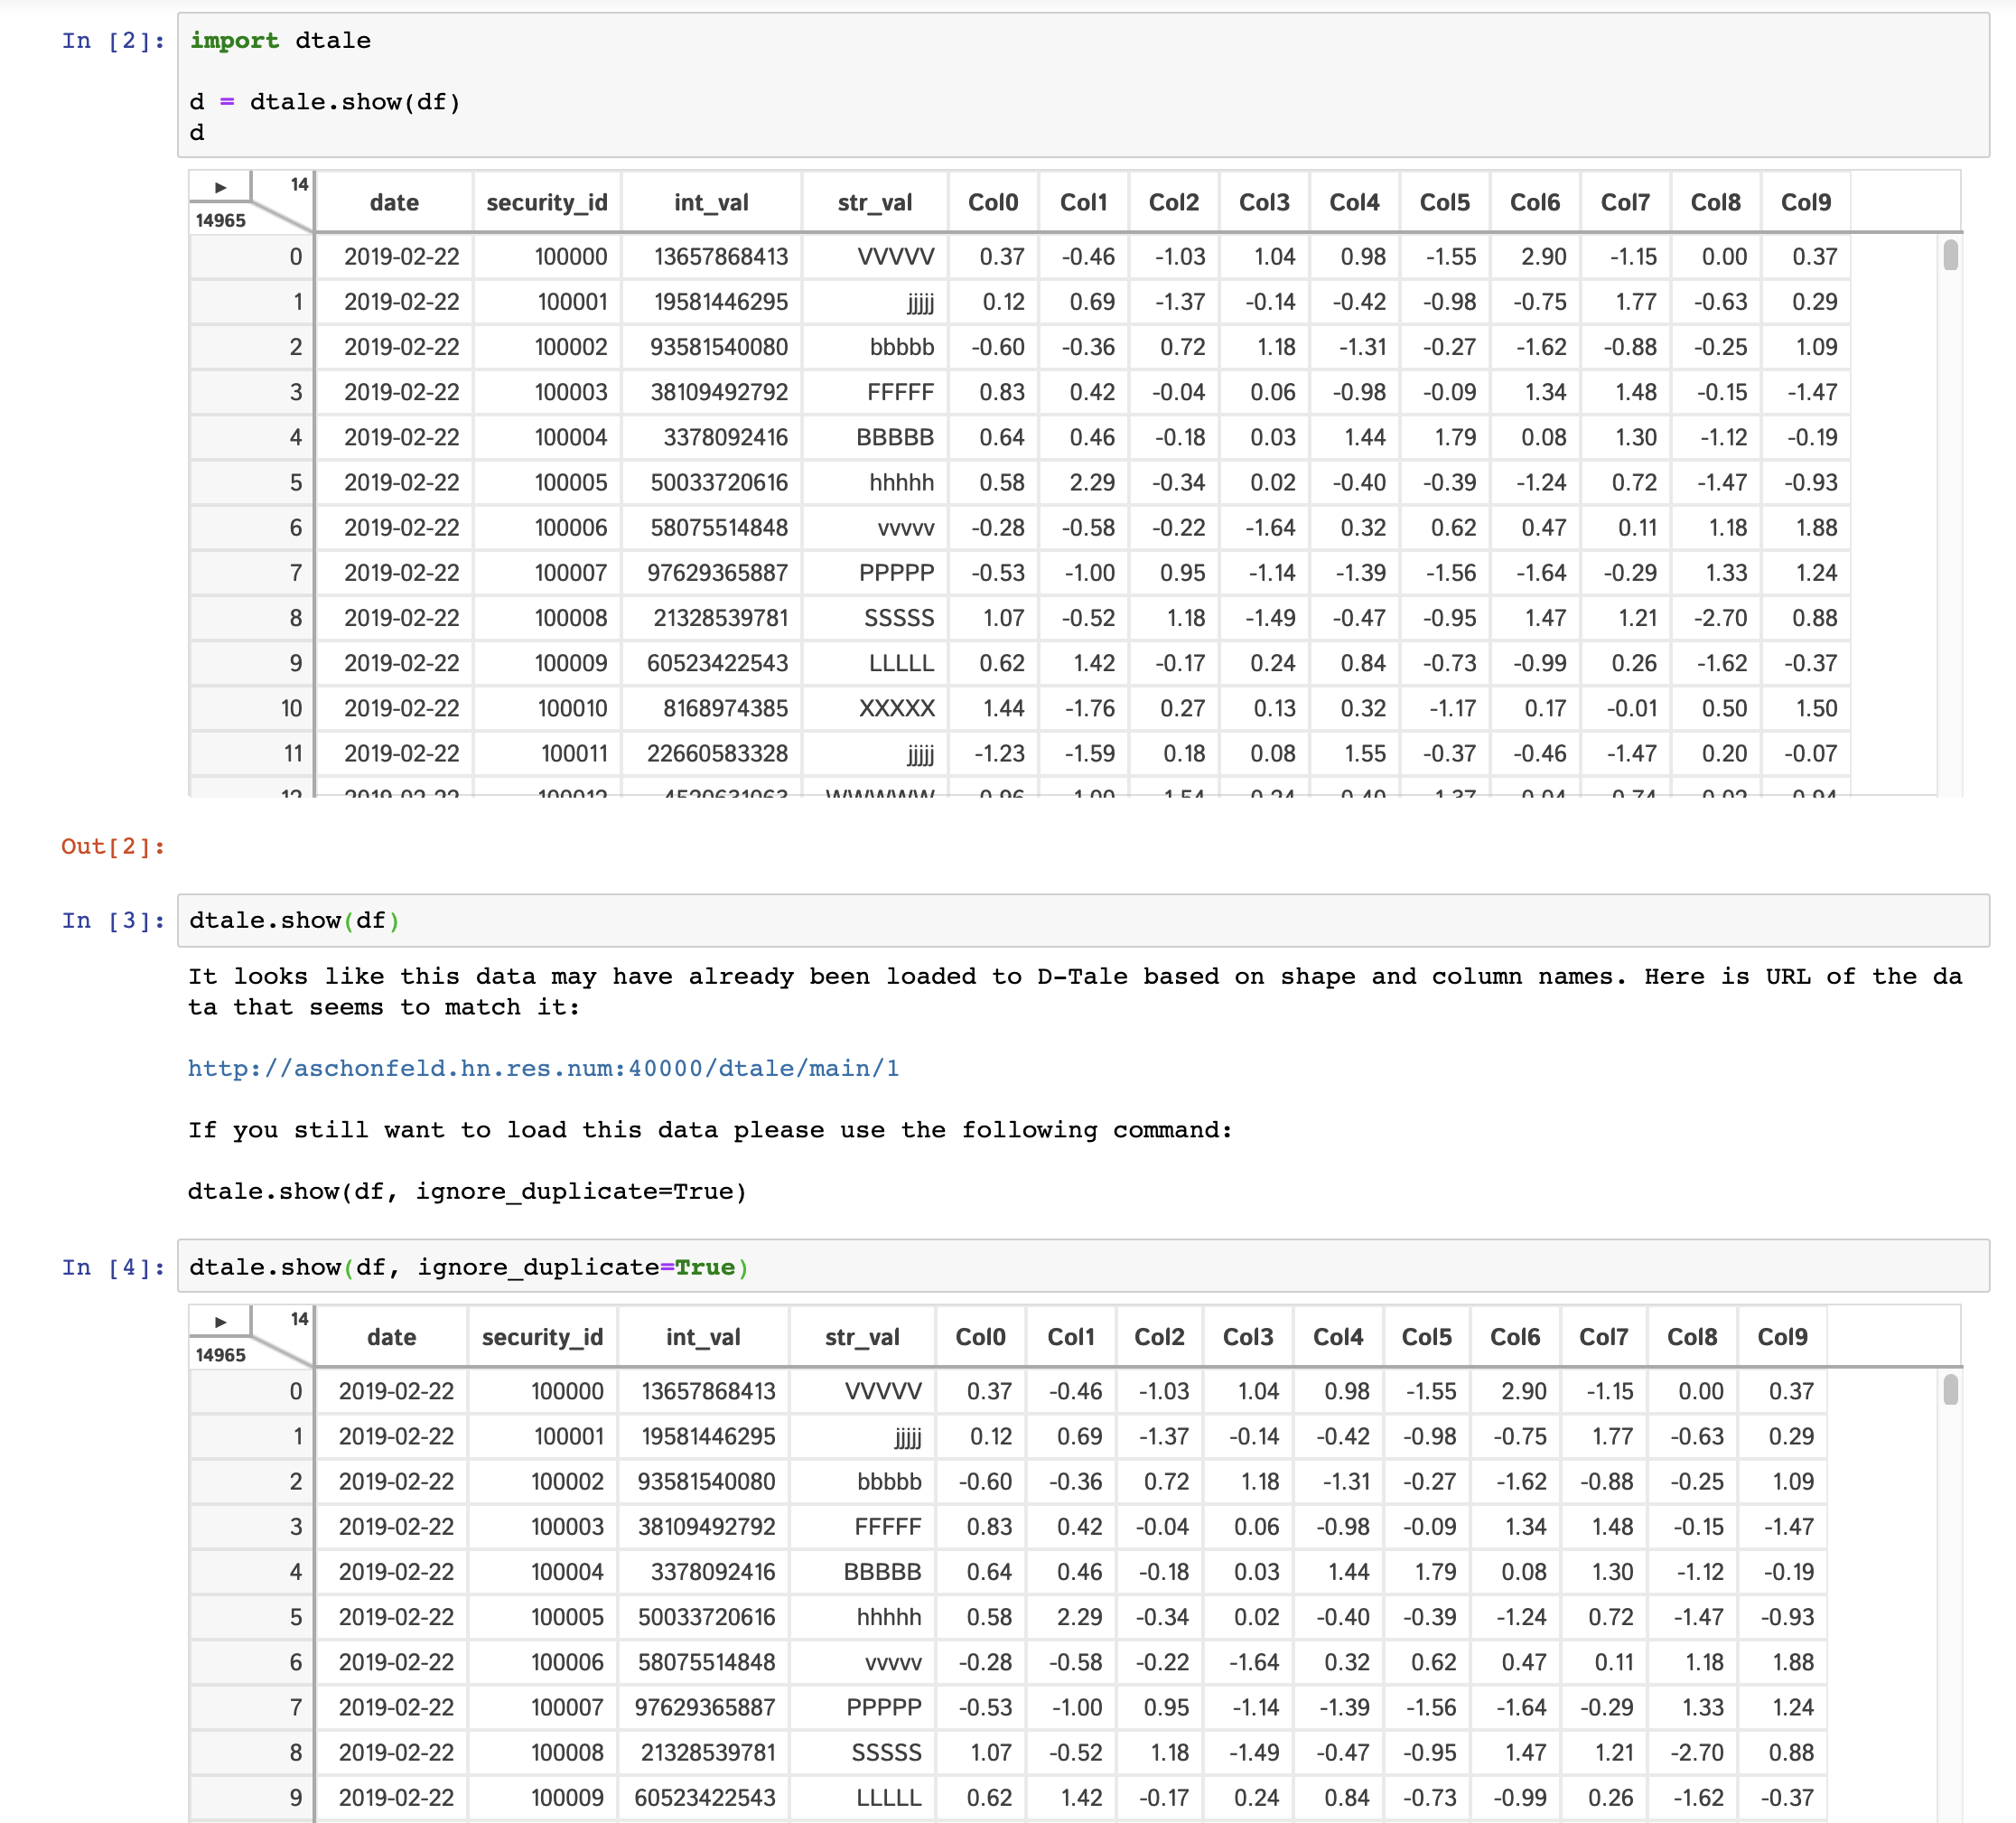
Duplicate data check
To help guard against users loading the same data to D-Tale multiple times and thus eating up precious memory, we have a loose check for duplicate input data. The check runs the following:
- Are row & column count the same as a previously loaded piece of data?
- Are the names and order of columns the same as a previously loaded piece of data?
If both these conditions are true then you will be presented with an error and a link to the previously loaded data. Here is an example of how the interaction looks:
As A Script
D-Tale can be run as script by adding subprocess=False to your dtale.show command. Here is an example script:
import dtale
import pandas as pd

if __name__ == '__main__':
      dtale.show(pd.DataFrame([1,2,3,4,5]), subprocess=False)
Jupyter Notebook
Within any jupyter (ipython) notebook executing a cell like this will display a small instance of D-Tale in the output cell. Here are some examples:
dtale.show | assignment | instance |
|---|---|---|
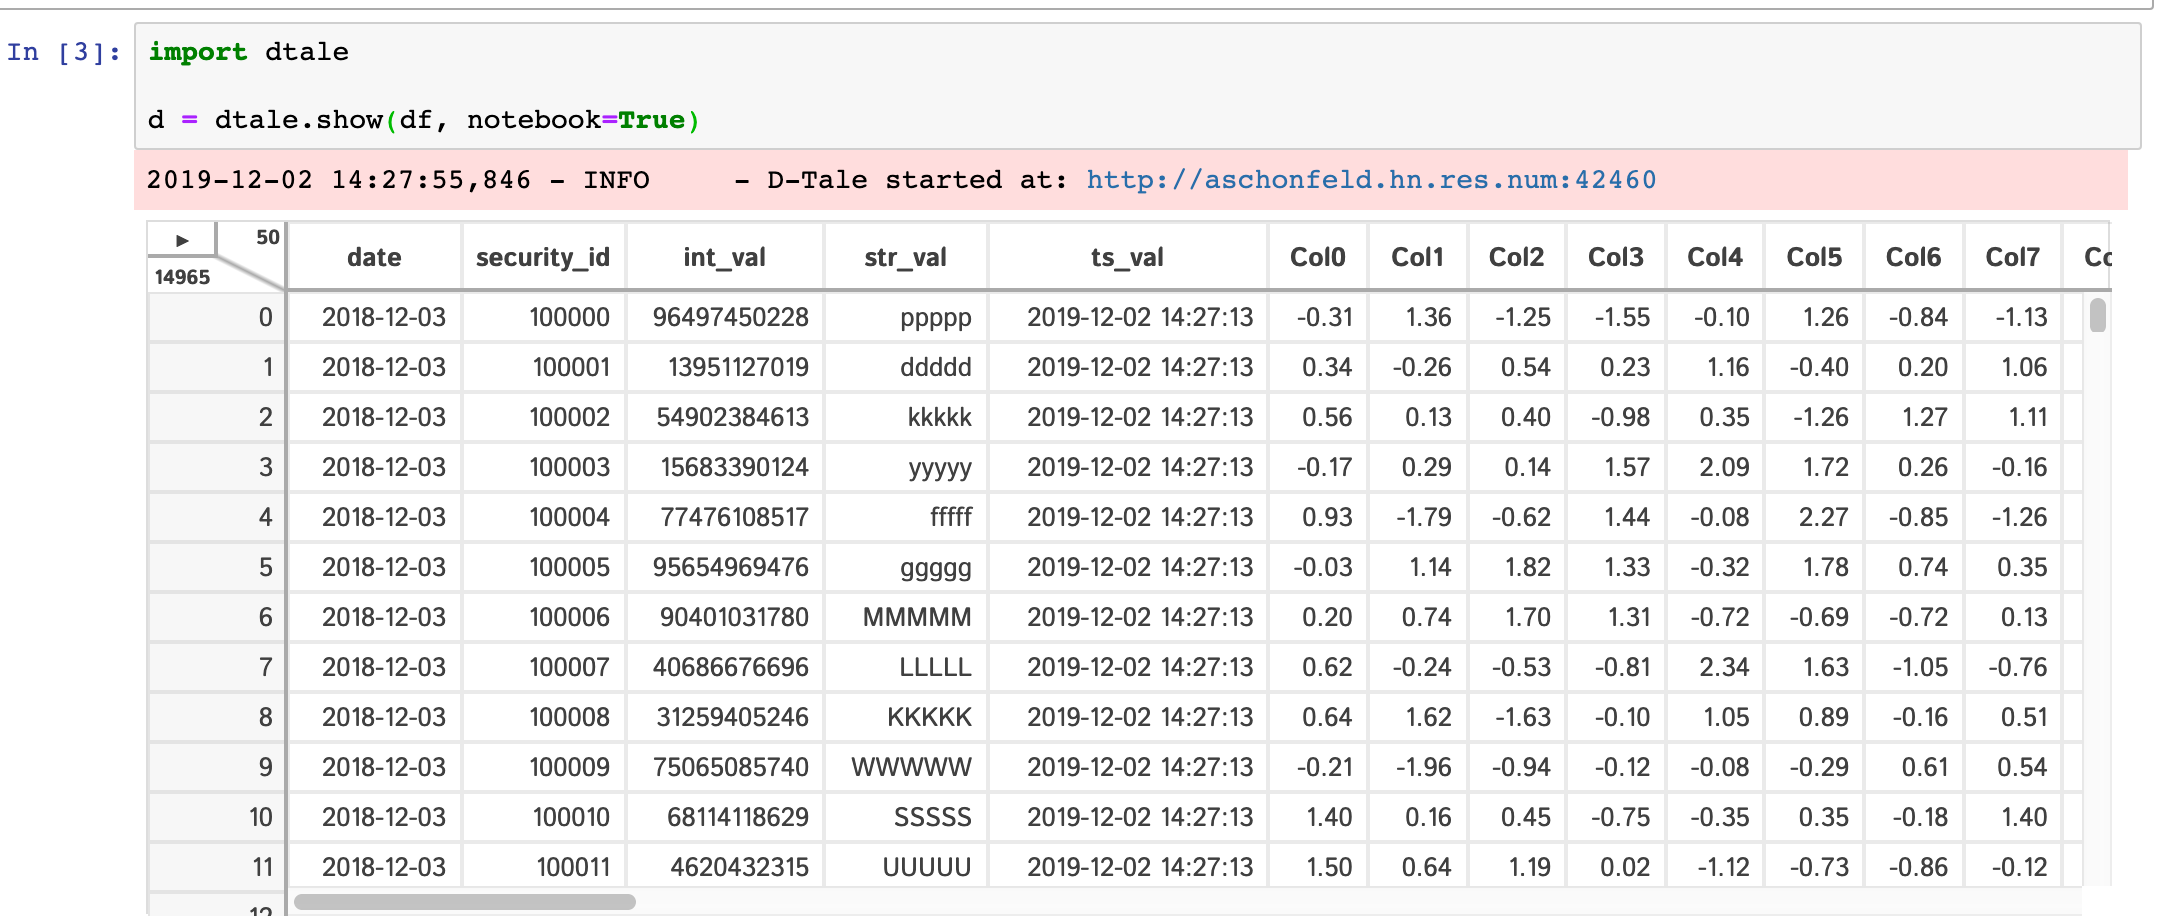 | 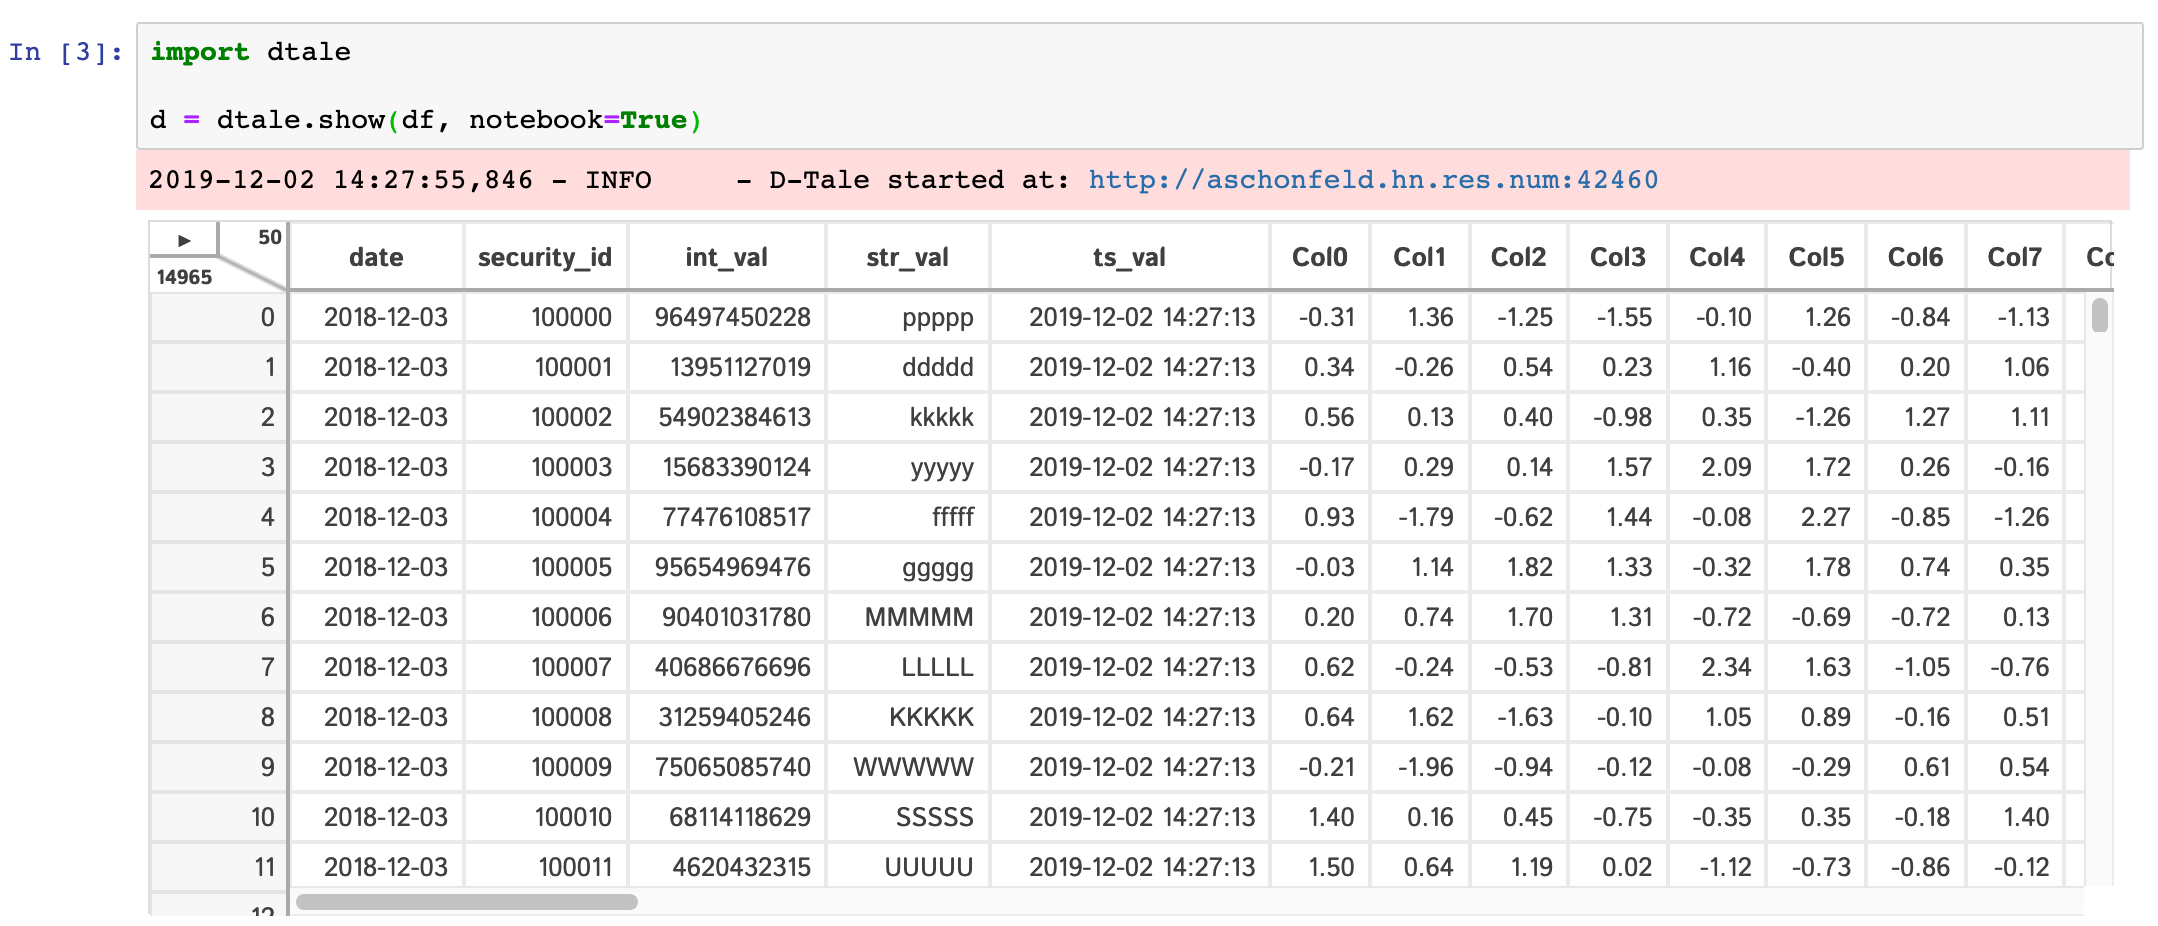 | 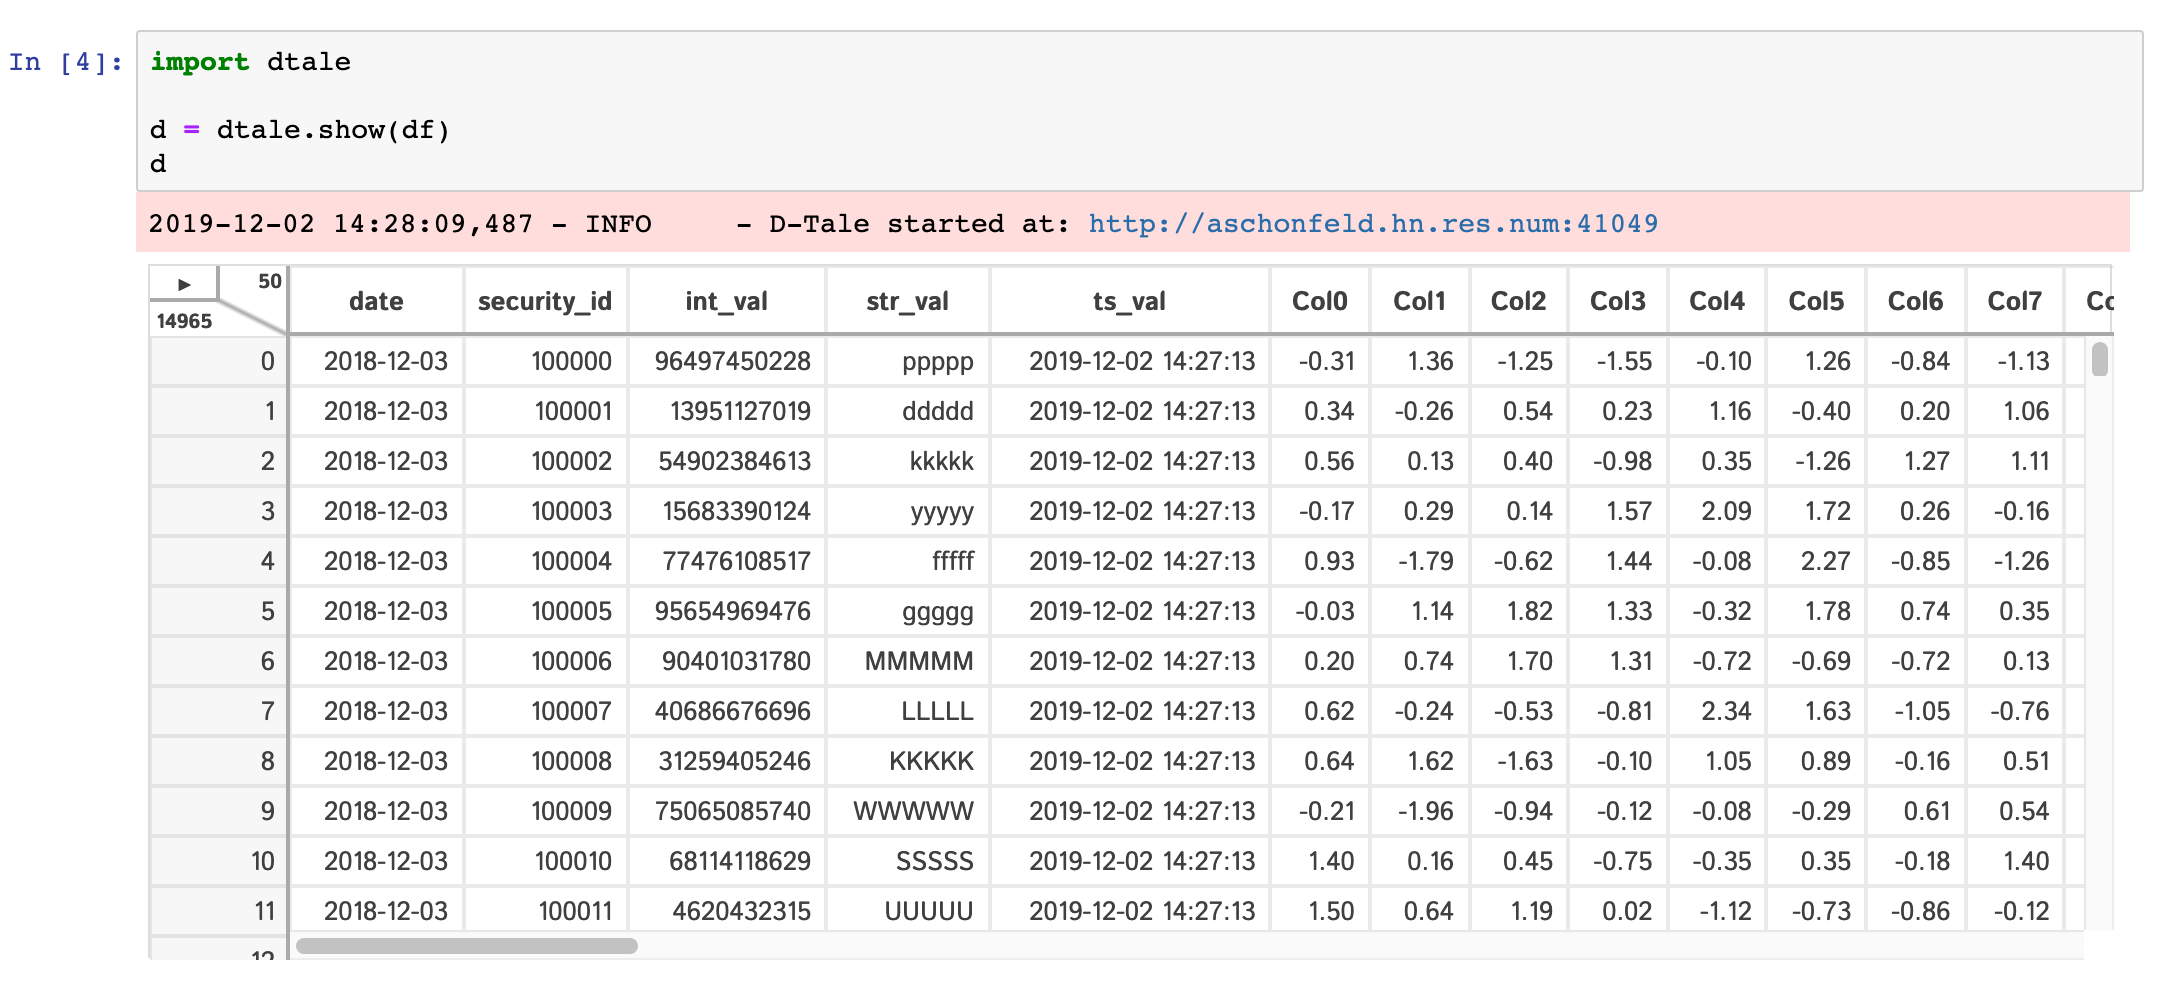 |
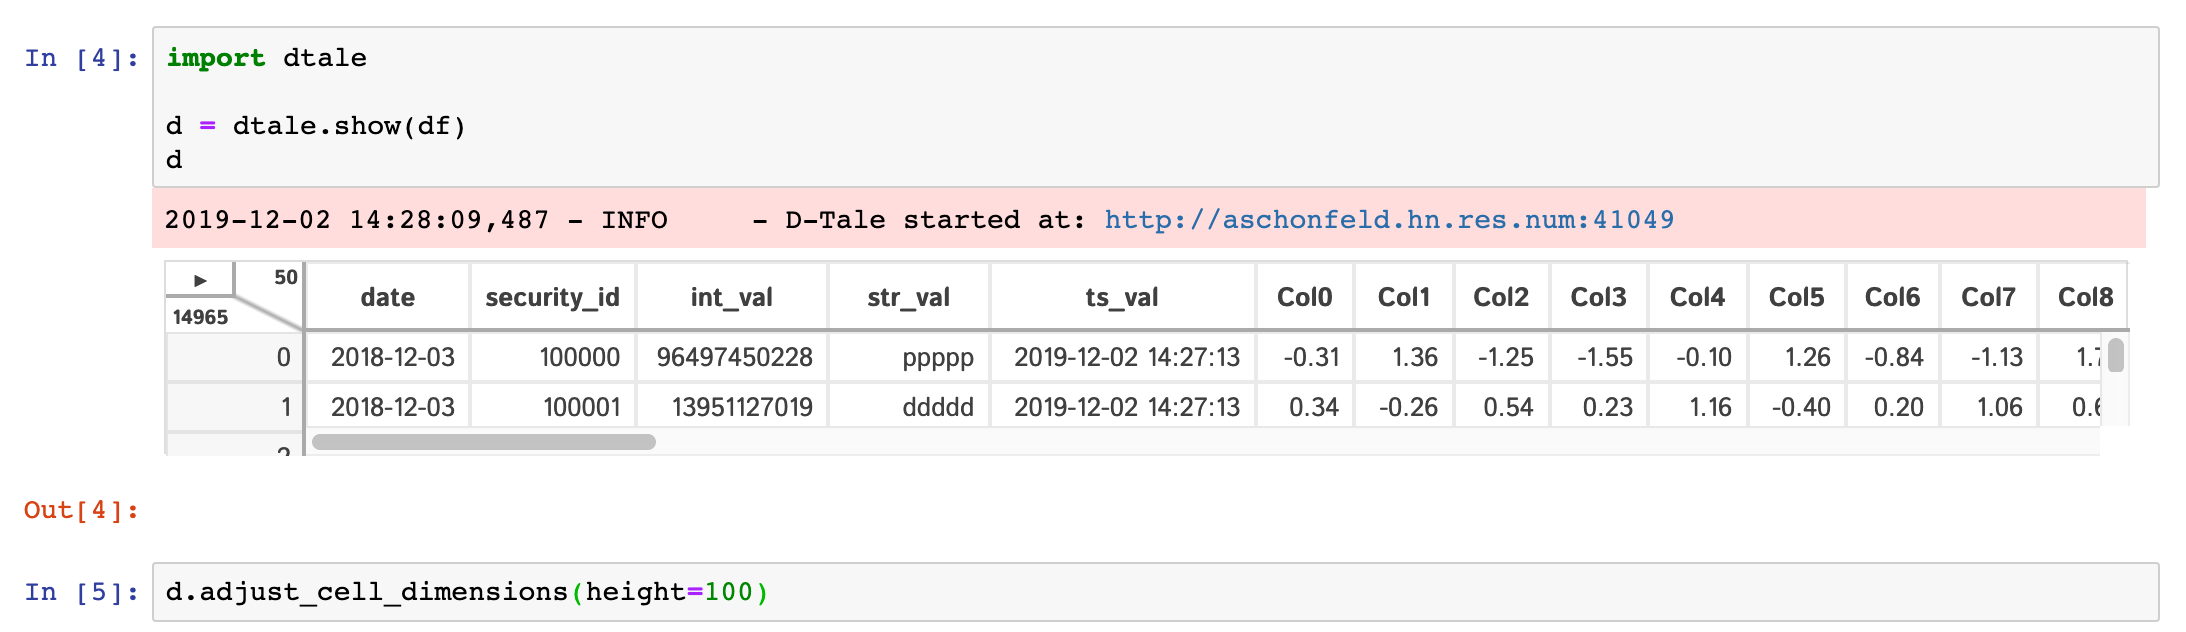
If you are running ipython<=5.0 then you also have the ability to adjust the size of your output cell for the most recent instance displayed:
One thing of note is that a lot of the modal popups you see in the standard browser version will now open separate browser windows for spacial convienence:
| Column Menus | Correlations | Describe | Column Analysis | Instances |
|---|---|---|---|---|
 |  |  |  |  |
JupyterHub w/ Jupyter Server Proxy
JupyterHub has an extension that allows to proxy port for user, JupyterHub Server Proxy
To me it seems like this extension might be the best solution to getting D-Tale running within kubernetes. Here's how to use it:
import pandas as pd

import dtale
import dtale.app as dtale_app

dtale_app.JUPYTER_SERVER_PROXY = True

dtale.show(pd.DataFrame([1,2,3]))
Notice the command dtale_app.JUPYTER_SERVER_PROXY = True this will make sure that any D-Tale instance will be served with the jupyter server proxy application root prefix:
/user/{jupyter username}/proxy/{dtale instance port}/
One thing to note is that if you try to look at the _main_url of your D-Tale instance in your notebook it will not include the hostname or port:
import pandas as pd

import dtale
import dtale.app as dtale_app

dtale_app.JUPYTER_SERVER_PROXY = True

d = dtale.show(pd.DataFrame([1,2,3]))
d._main_url # /user/johndoe/proxy/40000/dtale/main/1
This is because it's very hard to promgramatically figure out the host/port that your notebook is running on. So if you want to look at _main_url please be sure to preface it with:
http[s]://[jupyterhub host]:[jupyterhub port]
If for some reason jupyterhub changes their API so that the application root changes you can also override D-Tale's application root by using the app_root parameter to the show() function:
import pandas as pd

import dtale
import dtale.app as dtale_app

dtale.show(pd.DataFrame([1,2,3]), app_root='/user/johndoe/proxy/40000/`)
Using this parameter will only apply the application root to that specific instance so you would have to include it on every call to show().
JupyterHub w/ Kubernetes
Please read this post
Docker Container
If you have D-Tale installed within your docker container please add the following parameters to your docker run command.
On a Mac:
docker run -h `hostname` -p 40000:40000
-hthis will allow the hostname (and not the PID of the docker container) to be available when building D-Tale URLs-paccess to port 40000 which is the default port for running D-Tale
On Windows:
docker run -p 40000:40000
-paccess to port 40000 which is the default port for running D-Tale- D-Tale URL will be http://127.0.0.1:40000/
Everything Else:
docker run -h `hostname` --network host
-hthis will allow the hostname (and not the PID of the docker container) to be available when building D-Tale URLs--network hostthis will allow access to as many ports as needed for running D-Tale processes
Google Colab
This is a hosted notebook site and thanks to Colab's internal function google.colab.output.eval_js & the JS function google.colab.kernel.proexyPort users can run D-Tale within their notebooks.
DISCLAIMER: It is important that you set USE_COLAB to true when using D-Tale within this service. Here is an example:
import pandas as pd

import dtale
import dtale.app as dtale_app

dtale_app.USE_COLAB = True

dtale.show(pd.DataFrame([1,2,3]))
If this does not work for you try using USE_NGROK which is described in the next section.
Kaggle
This is yet another hosted notebook site and thanks to the work of flask_ngrok users can run D-Tale within their notebooks.
DISCLAIMER: It is import that you set USE_NGROK to true when using D-Tale within this service. Please make sure to run pip install flask-ngrok before running this example. Here is an example:
import pandas as pd

import dtale
import dtale.app as dtale_app

dtale_app.USE_NGROK = True

dtale.show(pd.DataFrame([1,2,3]))
Here are some video tutorials of each:
| Service | Tutorial | Addtl Notes |
|---|---|---|
| Google Colab | 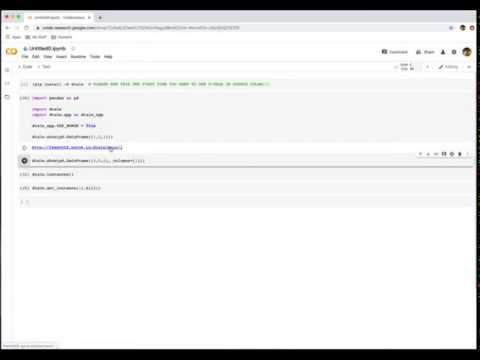 | |
| Kaggle | 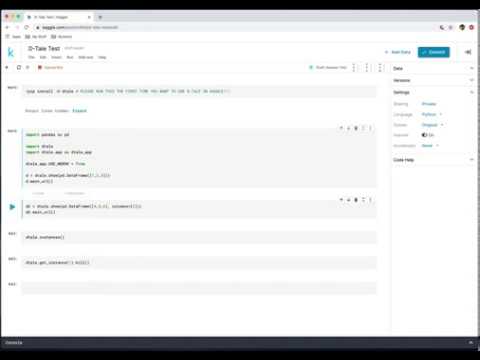 | make sure you switch the "Internet" toggle to "On" under settings of your notebook so you can install the egg from pip |
It is important to note that using NGROK will limit you to 20 connections per mintue so if you see this error:
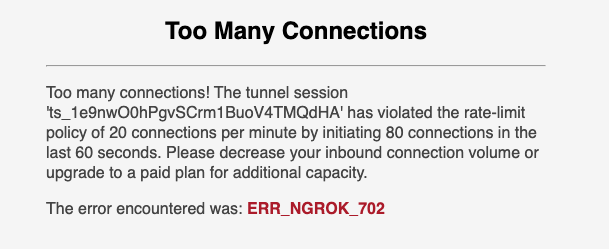
Wait a little while and it should allow you to do work again. I am actively working on finding a more sustainable solution similar to what I did for google colab. :pray:
Binder
I have built a repo which shows an example of how to run D-Tale within Binder here.
The important take-aways are:
- you must have
jupyter-server-proxyinstalled - look at the
environment.ymlfile to see how to add it to your environment - look at the
postBuildfile for how to activate it on startup
R with Reticulate
I was able to get D-Tale running in R using reticulate. Here is an example:
library('reticulate')
dtale <- import('dtale')
df <- read.csv('https://vincentarelbundock.github.io/Rdatasets/csv/boot/acme.csv')
dtale$show(df, subprocess=FALSE, open_browser=TRUE)
Now the problem with doing this is that D-Tale is not running as a subprocess so it will block your R console and you'll lose out the following functions:
- manipulating the state of your data from your R console
- adding more data to D-Tale
open_browser=TRUE isn't required and won't work if you don't have a default browser installed on your machine. If you don't use that parameter simply copy & paste the URL that gets printed to your console in the browser of your choice.
I'm going to do some more digging on why R doesn't seem to like using python subprocesses (not sure if it something with how reticulate manages the state of python) and post any findings to this thread.
Here's some helpful links for getting setup:
reticulate
installing python packages
Startup with No Data
It is now possible to run D-Tale with no data loaded up front. So simply call dtale.show() and this will start the application for you and when you go to view it you will be presented with a screen where you can upload either a CSV or TSV file for data.
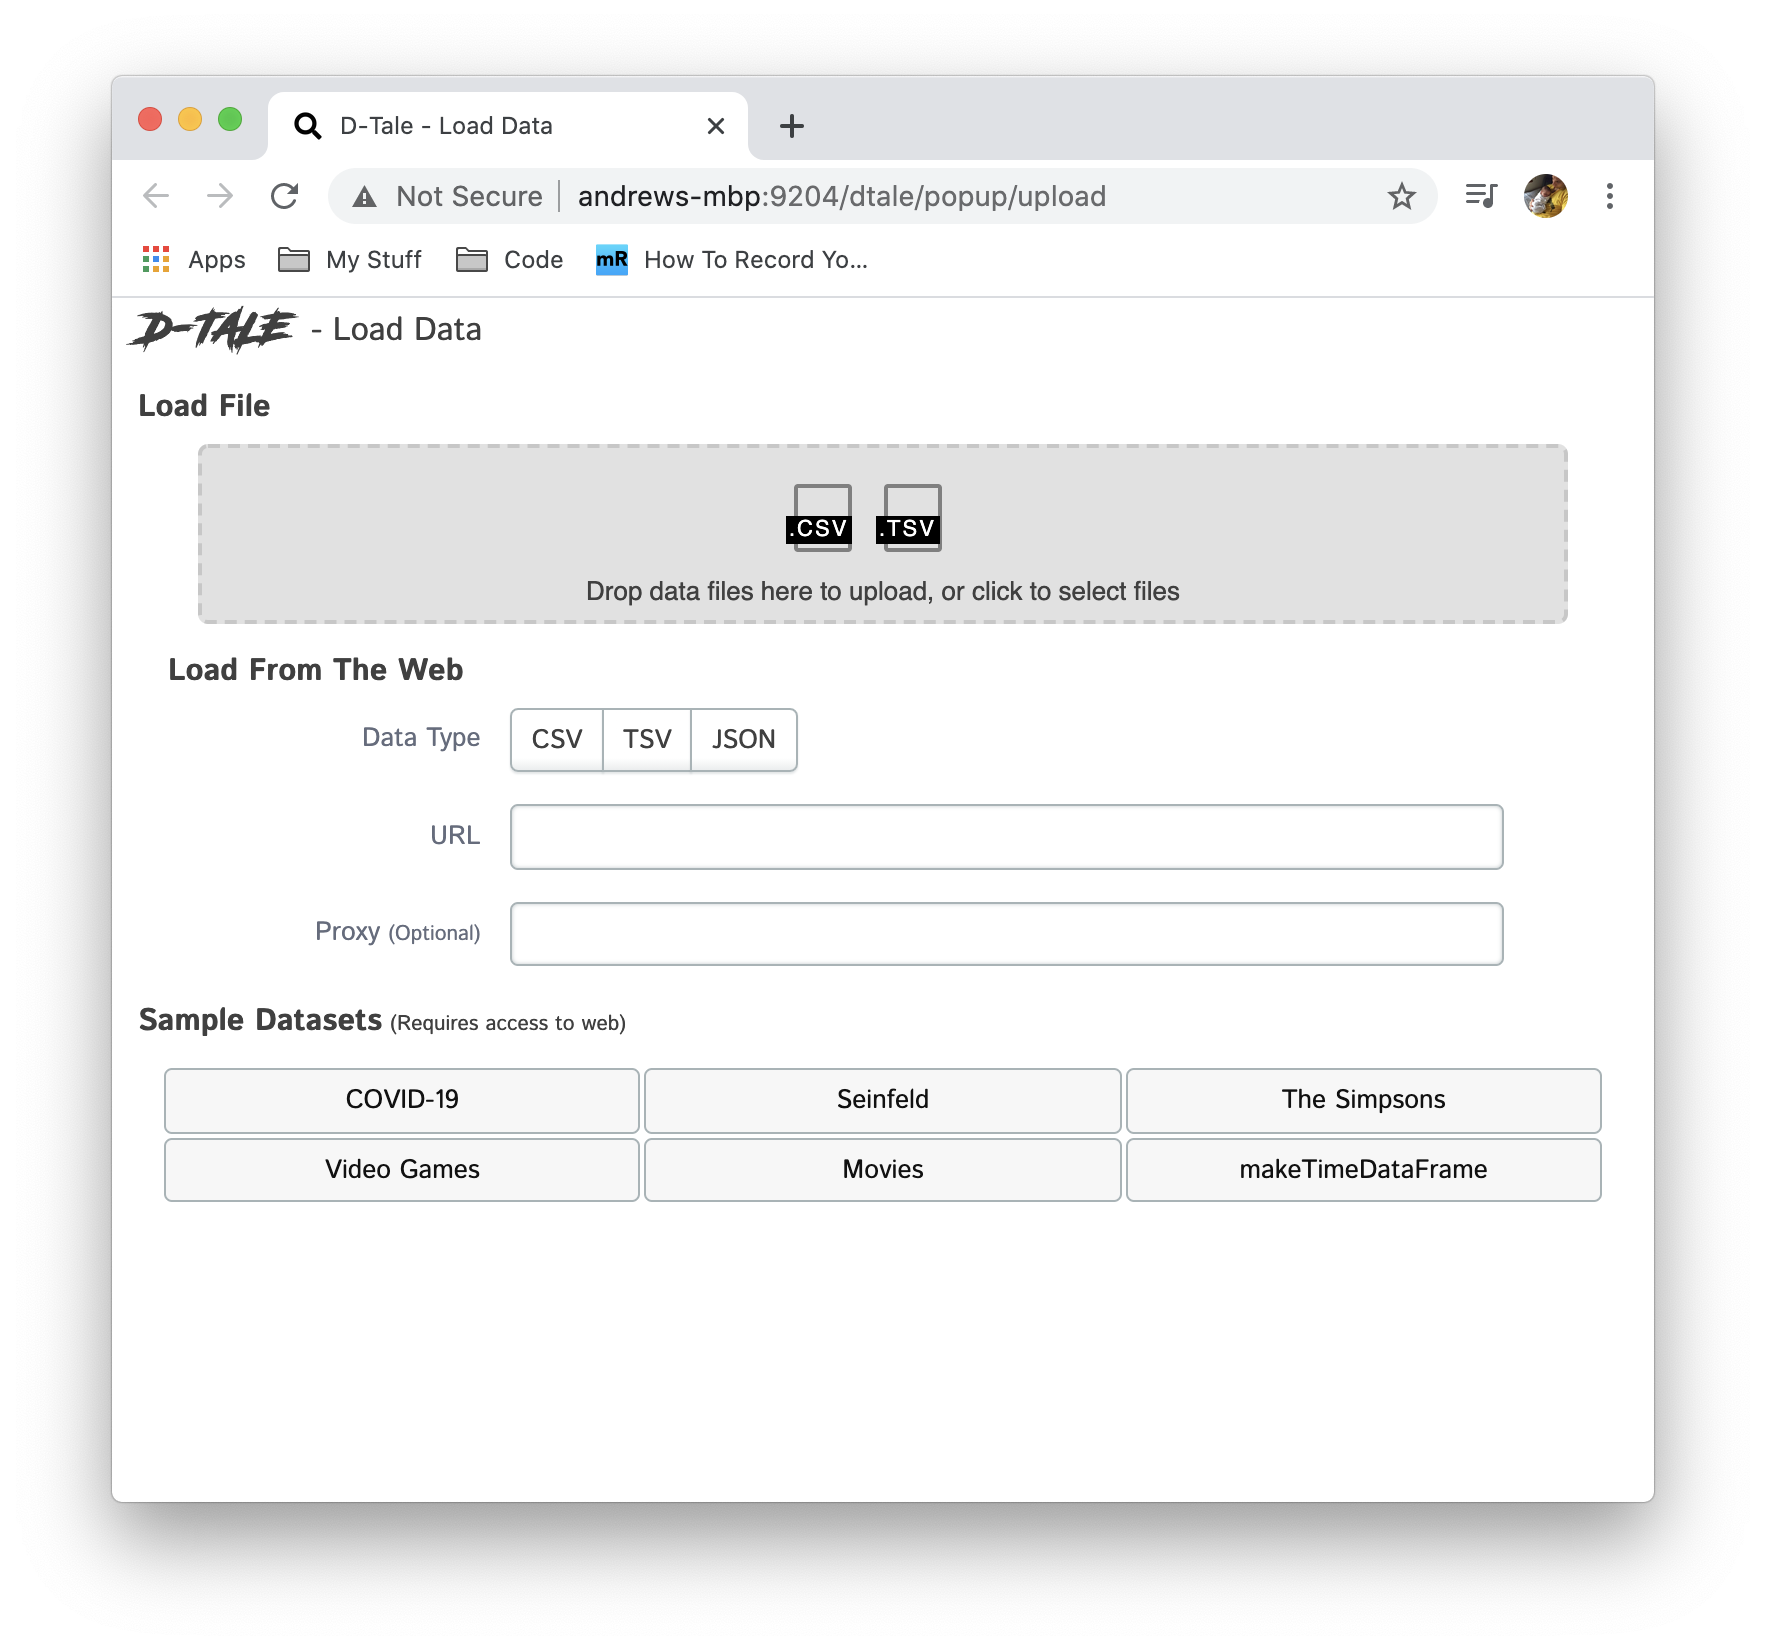
Once you've loaded a file it will take you directly to the standard data grid comprised of the data from the file you loaded. This might make it easier to use this as an on demand application within a container management system like kubernetes. You start and stop these on demand and you'll be presented with a new instance to load any CSV or TSV file to!
Command-line
Base CLI options (run dtale --help to see all options available)
| Prop | Description |
|---|---|
--host | the name of the host you would like to use (most likely not needed since socket.gethostname() should figure this out) |
--port | the port you would like to assign to your D-Tale instance |
--name | an optional name you can assign to your D-Tale instance (this will be displayed in the <title> & Instances popup) |
--debug | turn on Flask's "debug" mode for your D-Tale instance |
--no-reaper | flag to turn off auto-reaping subprocess (kill D-Tale instances after an hour of inactivity), good for long-running displays |
--open-browser | flag to automatically open up your server's default browser to your D-Tale instance |
--force | flag to force D-Tale to try an kill any pre-existing process at the port you've specified so it can use it |
Loading data from ArcticDB(high performance, serverless DataFrame database) (this requires either installing arcticdb or dtale[arcticdb])
dtale --arcticdb-uri lmdb:///<path> --arcticdb-library jdoe.my_lib --arcticdb-symbol my_symbol
If you would like to change your storage mechanism to ArcticDB then add the --arcticdb-use_store flag
dtale --arcticdb-uri lmdb:///<path> --arcticdb-library my_lib --arcticdb-symbol my_symbol --arcticdb-use_store
Loading data from arctic(high performance datastore for pandas dataframes) (this requires either installing arctic or dtale[arctic])
dtale --arctic-uri mongodb://localhost:27027 --arctic-library my_lib --arctic-symbol my_symbol --arctic-start 20130101 --arctic-end 20161231
Loading data from CSV
dtale --csv-path /home/jdoe/my_csv.csv --csv-parse_dates date
Loading data from EXCEL
dtale --excel-path /home/jdoe/my_csv.xlsx --excel-parse_dates date
dtale --excel-path /home/jdoe/my_csv.xls --excel-parse_dates date
Loading data from JSON
dtale --json-path /home/jdoe/my_json.json --json-parse_dates date
or
dtale --json-path http://json-endpoint --json-parse_dates date
Loading data from R Datasets
dtale --r-path /home/jdoe/my_dataset.rda
Loading data from SQLite DB Files
dtale --sqlite-path /home/jdoe/test.sqlite3 --sqlite-table test_table
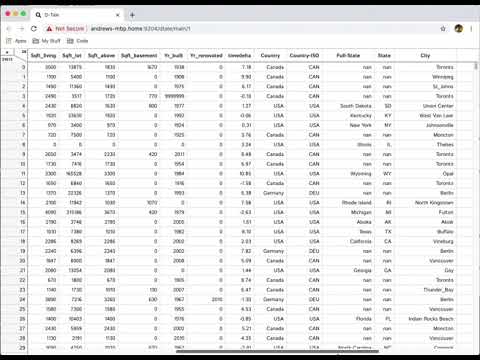
Custom Command-line Loaders
Loading data from a Custom loader
- Using the DTALE_CLI_LOADERS environment variable, specify a path to a location containing some python modules
- Any python module containing the global variables LOADER_KEY & LOADER_PROPS will be picked up as a custom loader
- LOADER_KEY: the key that will be associated with your loader. By default you are given arctic & csv (if you use one of these are your key it will override these)
- LOADER_PROPS: the individual props available to be specified.
- For example, with arctic we have host, library, symbol, start & end.
- If you leave this property as an empty list your loader will be treated as a flag. For example, instead of using all the arctic properties we would simply specify
--arctic(this wouldn't work well in arctic's case since it depends on all those properties)
- You will also need to specify a function with the following signature
def find_loader(kwargs)which returns a function that returns a dataframe orNone - Here is an example of a custom loader:
from dtale.cli.clickutils import get_loader_options

'''
  IMPORTANT!!! This global variable is required for building any customized CLI loader.
  When find loaders on startup it will search for any modules containing the global variable LOADER_KEY.
'''
LOADER_KEY = 'testdata'
LOADER_PROPS = ['rows', 'columns']


def test_data(rows, columns):
    import pandas as pd
    import numpy as np
    import random
    from past.utils import old_div
    from pandas.tseries.offsets import Day
    from dtale.utils import dict_merge
    import string

    now = pd.Timestamp(pd.Timestamp('now').date())
    dates = pd.date_range(now - Day(364), now)
    num_of_securities = max(old_div(rows, len(dates)), 1)  # always have at least one security
    securities = [
        dict(security_id=100000 + sec_id, int_val=random.randint(1, 100000000000),
             str_val=random.choice(string.ascii_letters) * 5)
        for sec_id in range(num_of_securities)
    ]
    data = pd.concat([
        pd.DataFrame([dict_merge(dict(date=date), sd) for sd in securities])
        for date in dates
    ], ignore_index=True)[['date', 'security_id', 'int_val', 'str_val']]

    col_names = ['Col{}'.format(c) for c in range(columns)]
    return pd.concat([data, pd.DataFrame(np.random.randn(len(data), columns), columns=col_names)], axis=1)


# IMPORTANT!!! This function is required for building any customized CLI loader.
def find_loader(kwargs):
    test_data_opts = get_loader_options(LOADER_KEY, LOADER_PROPS, kwargs)
    if len([f for f in test_data_opts.values() if f]):
        def _testdata_loader():
            return test_data(int(test_data_opts.get('rows', 1000500)), int(test_data_opts.get('columns', 96)))

        return _testdata_loader
    return None
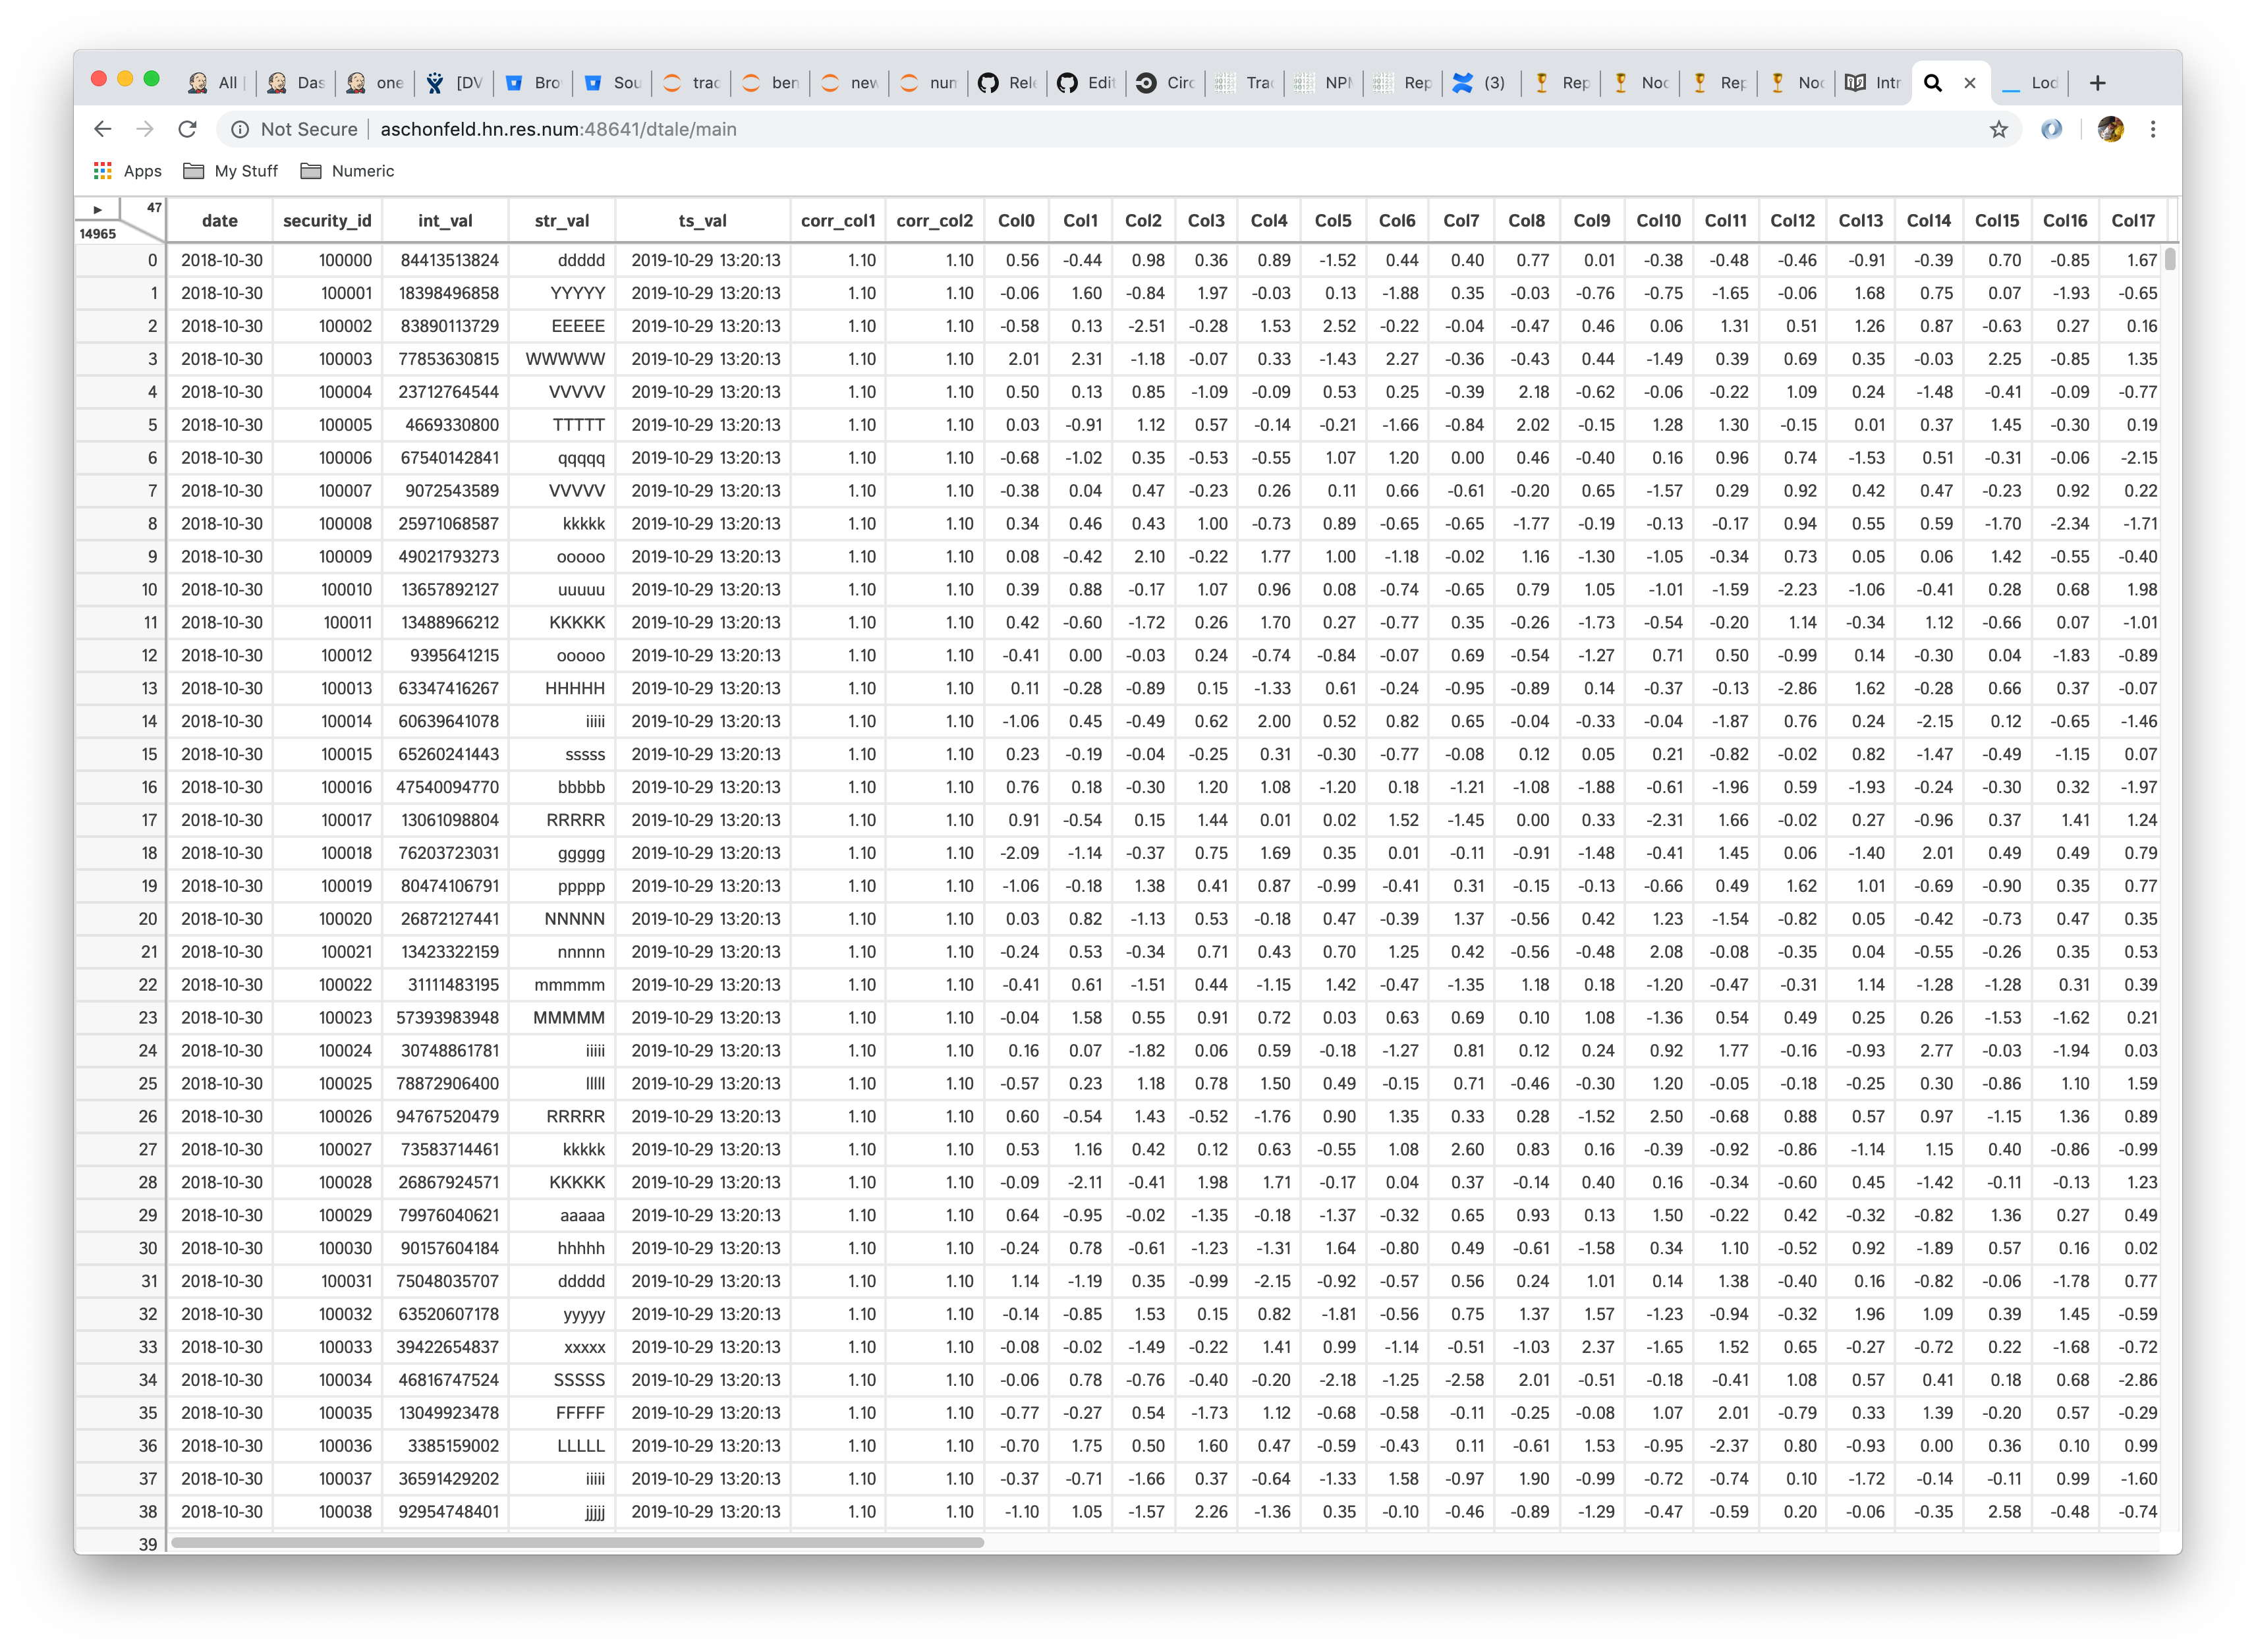
In this example we simplying building a dataframe with some dummy data based on dimensions specified on the command-line:
--testdata-rows--testdata-columns
Here's how you would use this loader:
DTALE_CLI_LOADERS=./path_to_loaders bash -c 'dtale --testdata-rows 10 --testdata-columns 5'
Authentication
You can choose to use optional authentication by adding the following to your D-Tale .ini file (directions here):
[auth]
active = True
username = johndoe
password = 1337h4xOr
Or you can call the following:
import dtale.global_state as global_state

global_state.set_auth_settings({'active': True, 'username': 'johndoe', 'password': '1337h4x0r'})
If you have done this before initially starting D-Tale it will have authentication applied. If you are adding this after starting D-Tale you will have to kill your service and start it over.
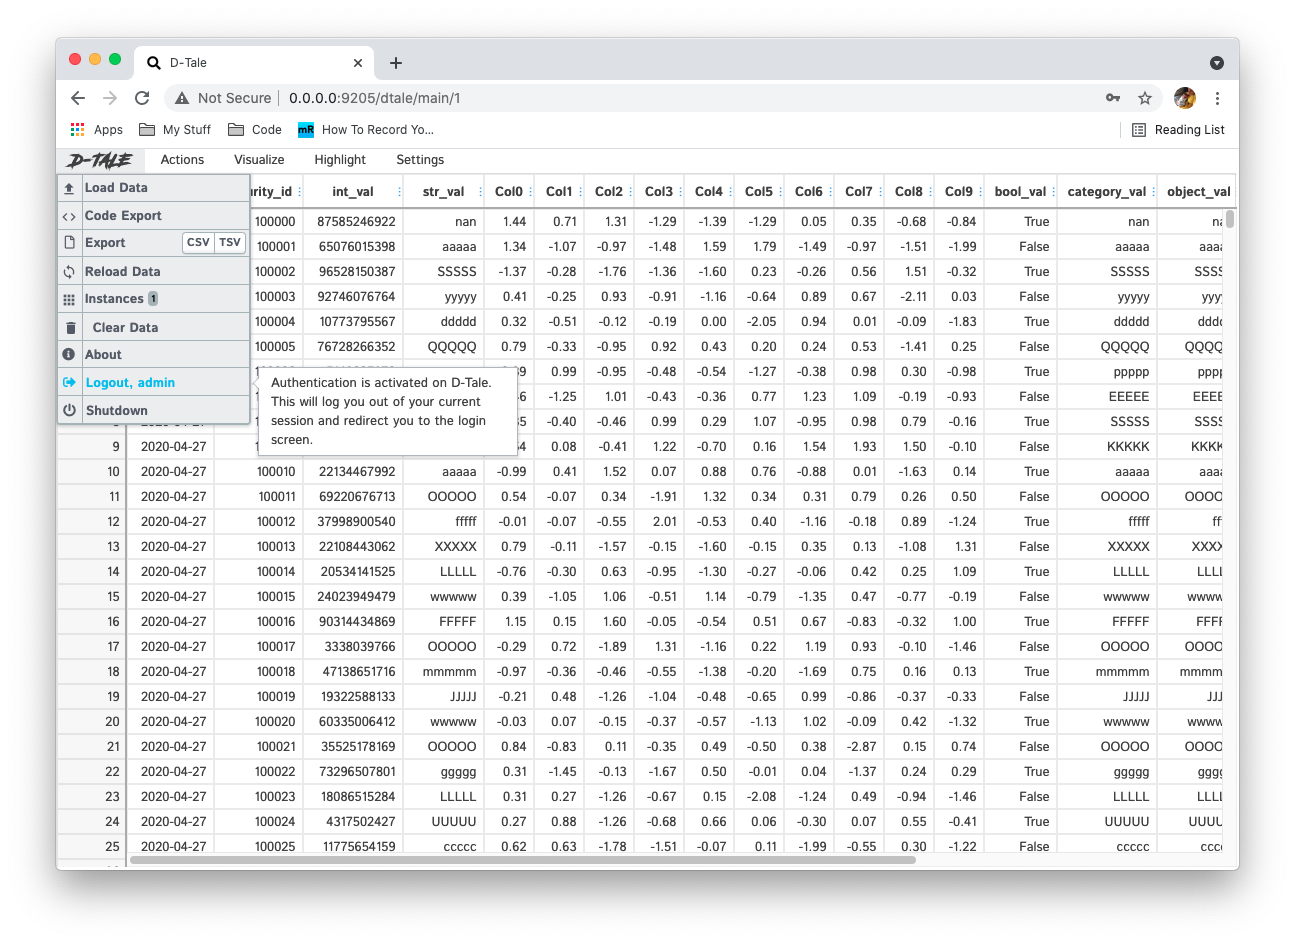
When opening your D-Tale session you will be presented with a screen like this:
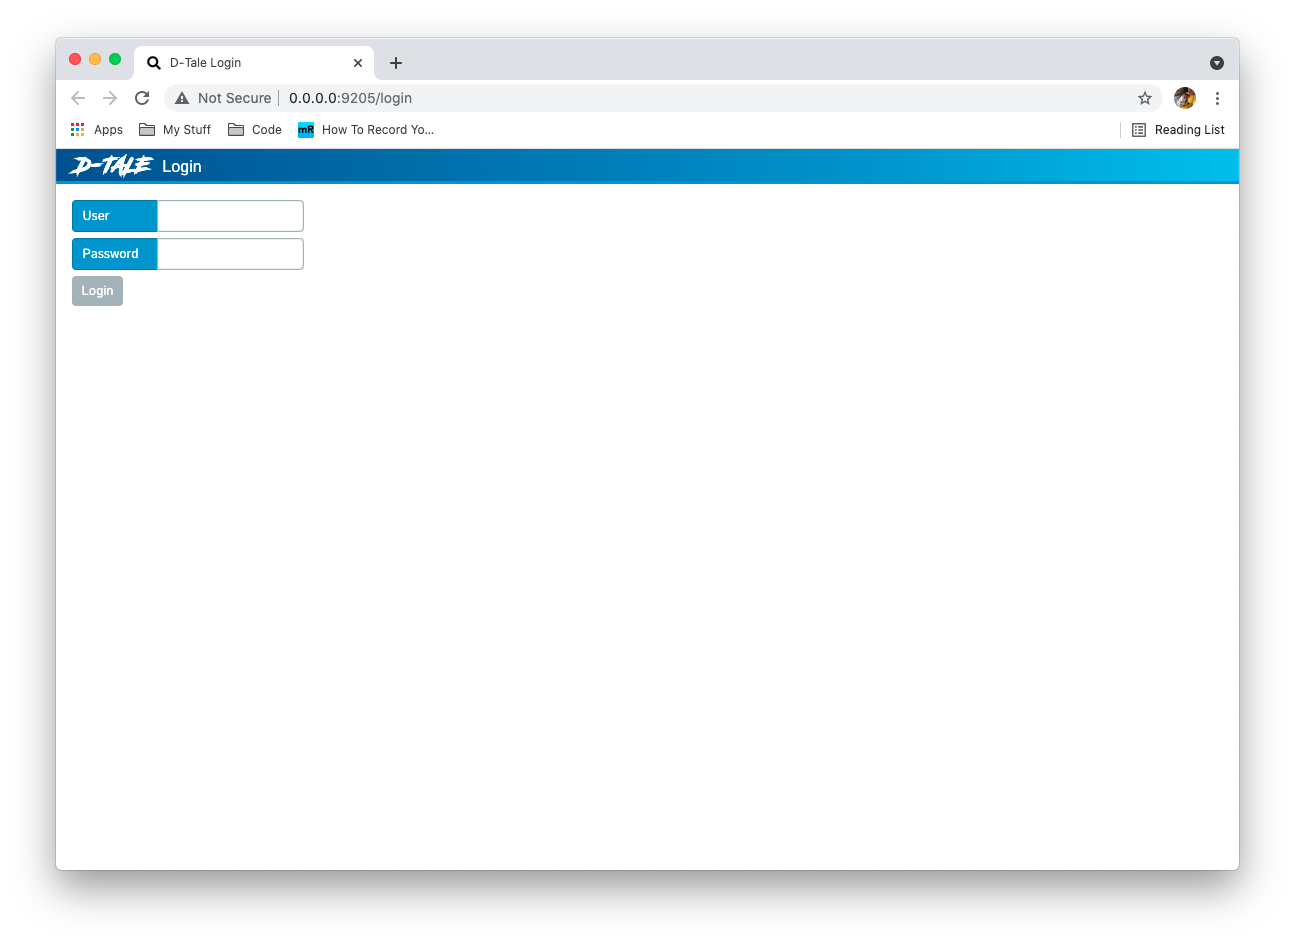
From there you can enter the credentials you either set in your .ini file or in your call to dtale.global_state.set_auth_settings and you will be brought to the main grid as normal. You will now have an additional option in your main menu to logout:
Instance Settings
Users can set front-end properties on their instances programmatically in the dtale.show function or by calling the update_settings function on their instance. For example:
import dtale
import pandas as pd

df = pd.DataFrame(dict(
  a=[1,2,3,4,5],
  b=[6,7,8,9,10],
  c=['a','b','c','d','e']
))
dtale.show(
  df,
  locked=['c'],
  column_formats={'a': {'fmt': '0.0000'}},
  nan_display='...',
  background_mode='heatmap-col',
  sort=[('a','DESC')],
  vertical_headers=True,
)
or
import dtale
import pandas as pd

df = pd.DataFrame(dict(
  a=[1,2,3,4,5],
  b=[6,7,8,9,10],
  c=['a','b','c','d','e']
))
d = dtale.show(
  df
)
d.update_settings(
  locked=['c'],
  column_formats={'a': {'fmt': '0.0000'}},
  nan_display='...',
  background_mode='heatmap-col',
  sort=[('a','DESC')],
  vertical_headers=True,
)
d
Here's a short description of each instance setting available:
show_columns
A list of column names you would like displayed in your grid. Anything else will be hidden.
hide_columns
A list of column names you would like initially hidden from the grid display.
column_formats
A dictionary of column name keys and their front-end display configuration. Here are examples of the different format configurations:
- Numeric:
{'fmt': '0.00000'} - String:
{'fmt': {'truncate': 10}}truncate string values to no more than 10 characters followed by an ellipses{'fmt': {'link': True}}if your strings are URLs convert them to clickable links{'fmt': {'html': True}}if your strings are HTML fragments render them as HTML
- Date:
{'fmt': 'MMMM Do YYYY, h:mm:ss a'}uses Moment.js formatting
nan_display
Converts any nan values in your dataframe to this when it is sent to the browser (doesn't actually change the state of your dataframe)
sort
List of tuples which sort your dataframe (EX: [('a', 'ASC'), ('b', 'DESC')])
locked
List of column names which will be locked to the right side of your grid while you scroll to the left.
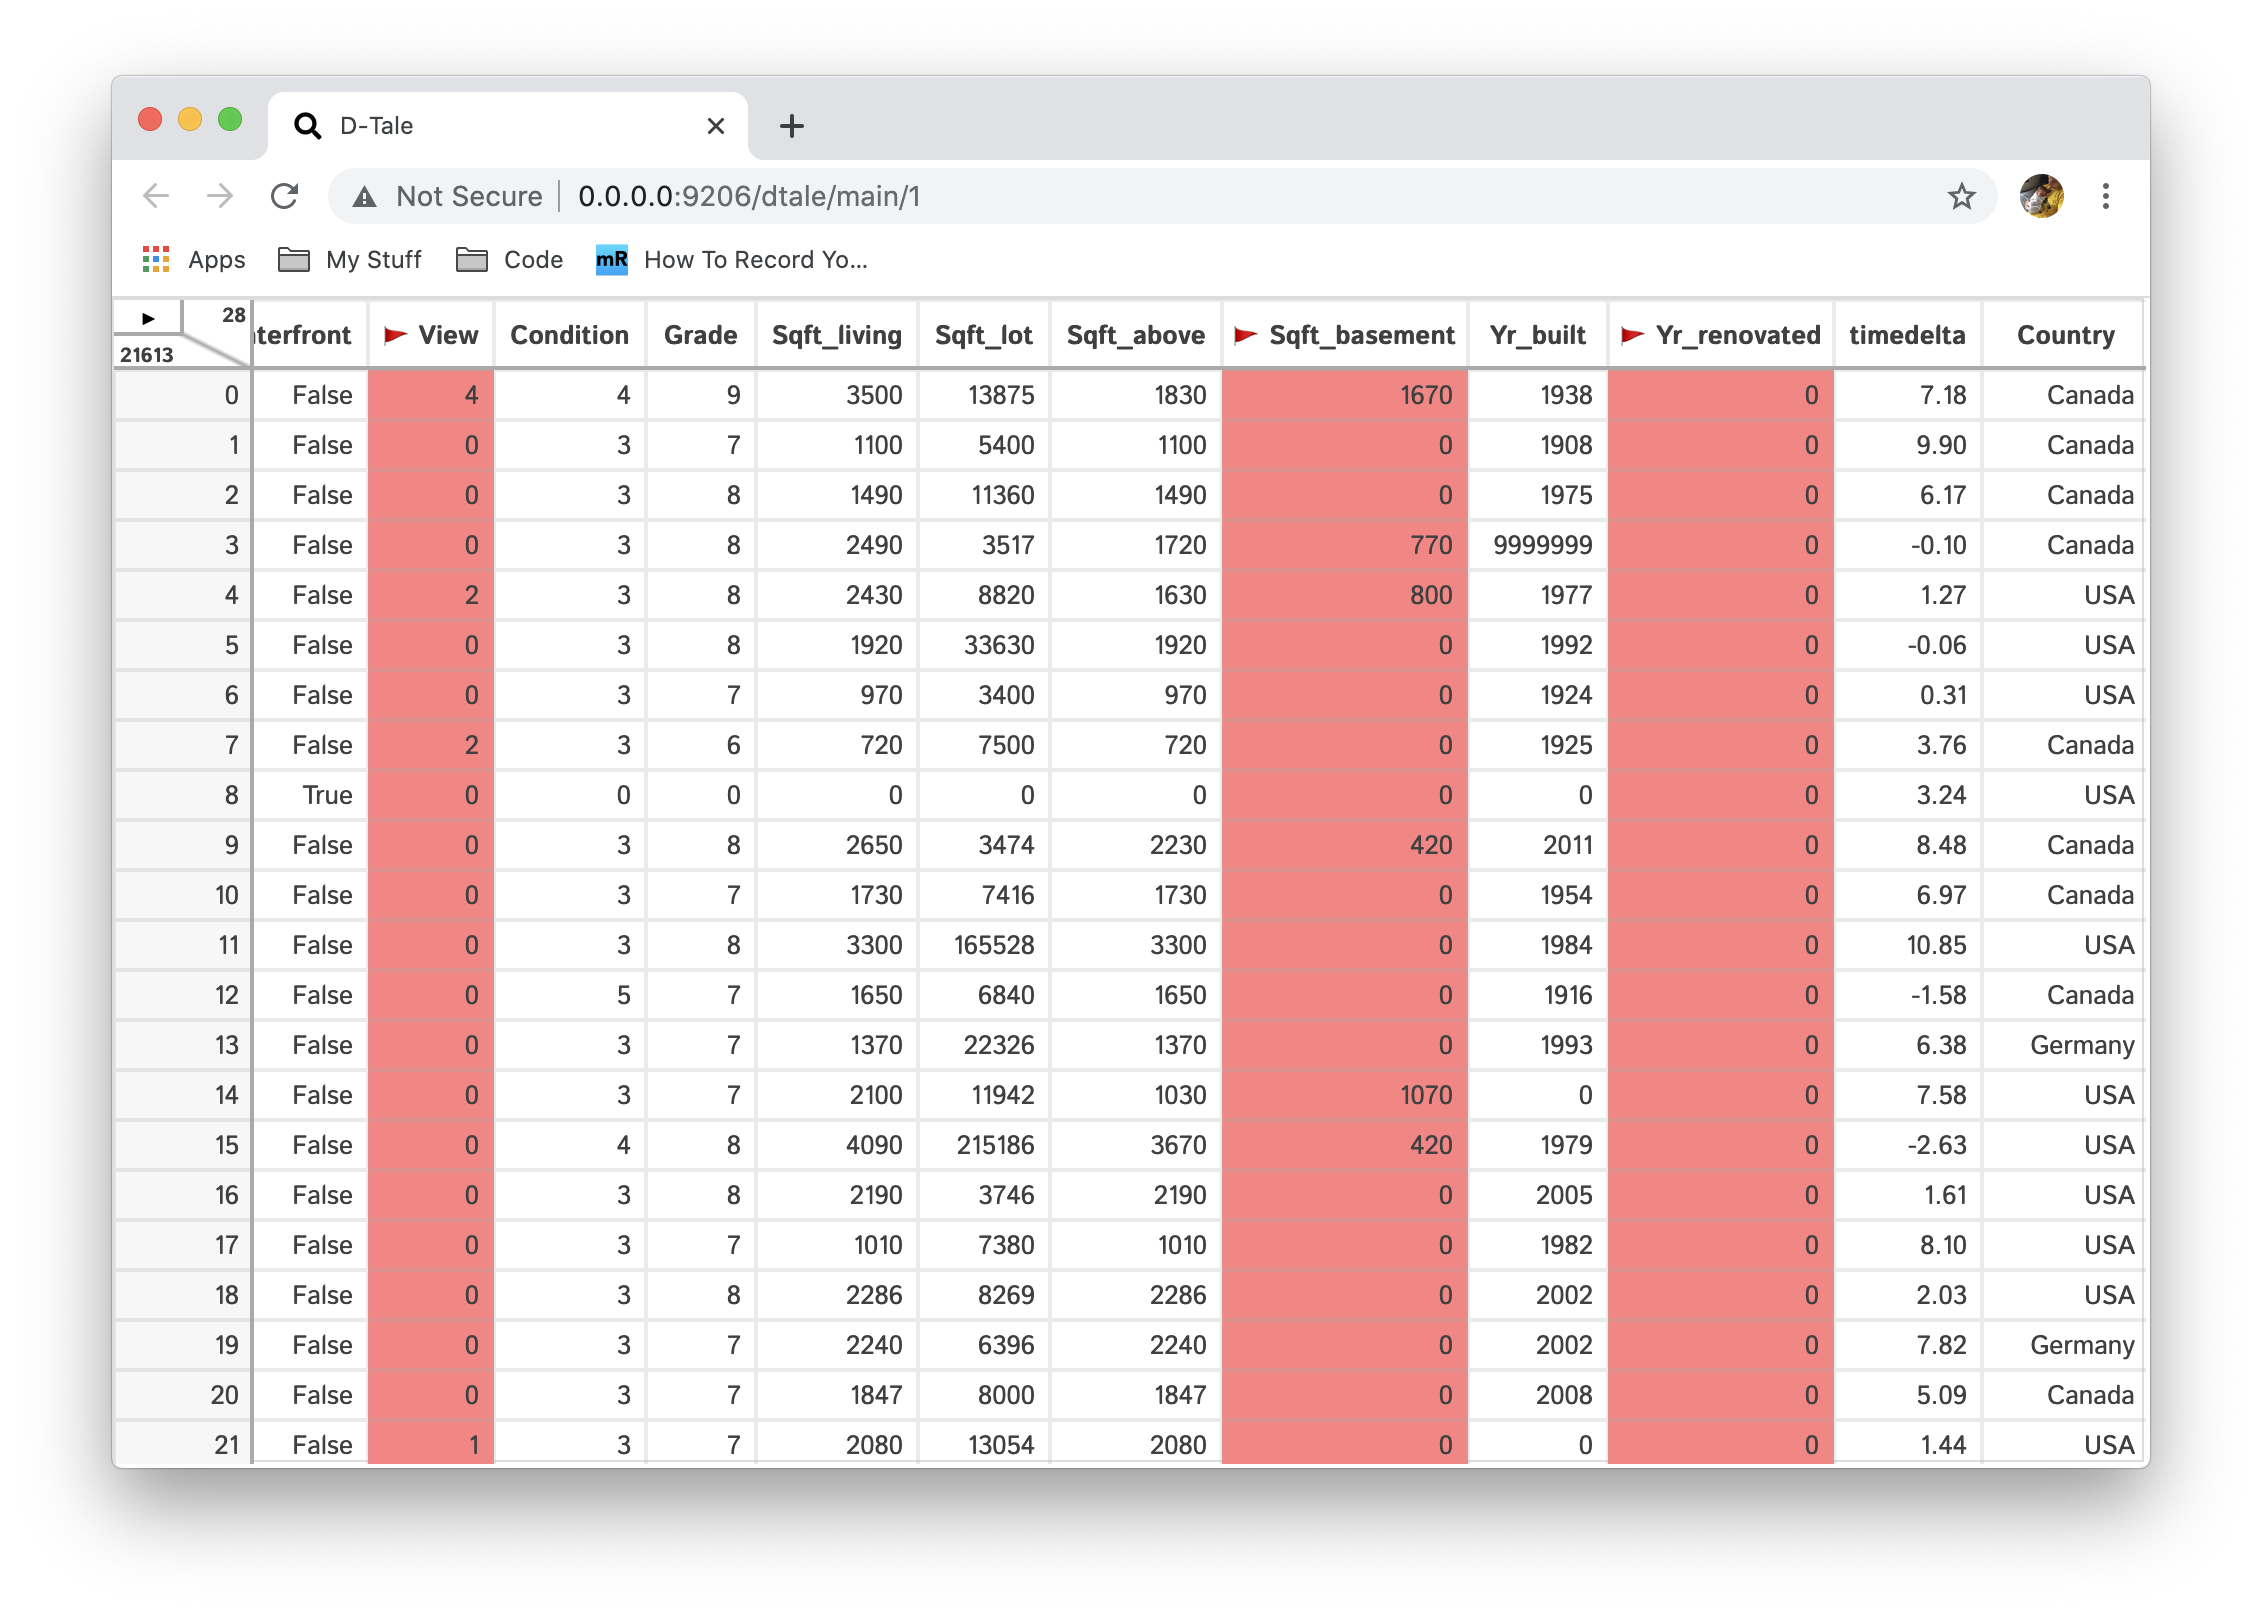
background_mode
A string denoting one of the many background displays available in D-Tale. Options are:
- heatmap-all: turn on heatmap for all numeric columns where the colors are determined by the range of values over all numeric columns combined
- heatmap-col: turn on heatmap for all numeric columns where the colors are determined by the range of values in the column
- heatmap-col-[column name]: turn on heatmap highlighting for a specific column
- dtypes: highlight columns based on it's data type
- missing: highlight any missing values (np.nan, empty strings, strings of all spaces)
- outliers: highlight any outliers
- range: highlight values for any matchers entered in the "range_highlights" option
- lowVariance: highlight values with a low variance
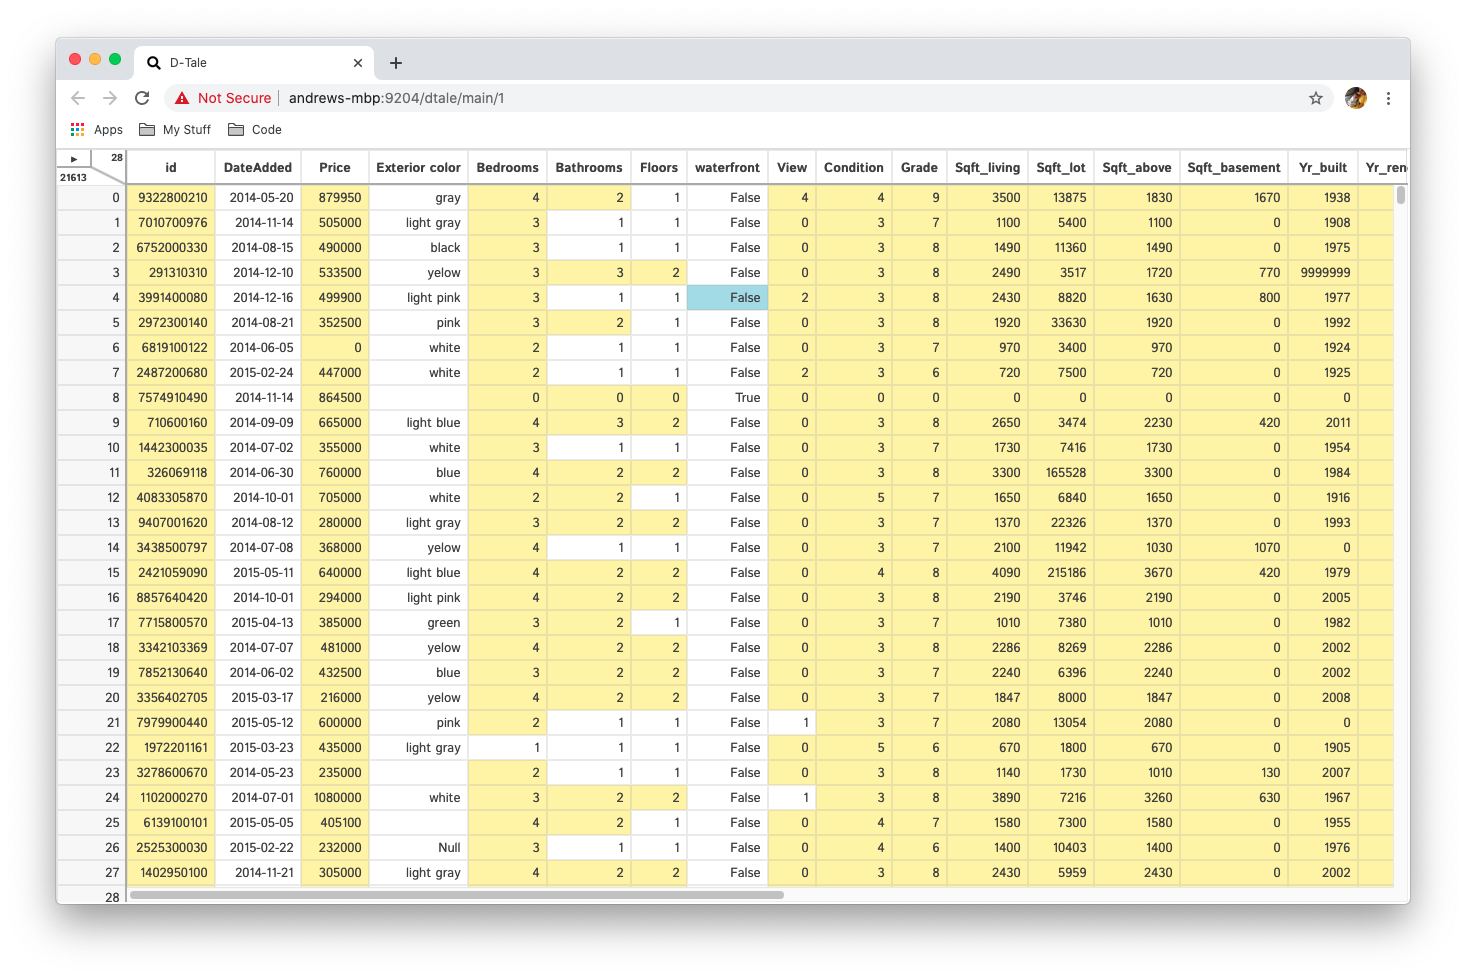
range_highlights
Dictionary of column name keys and range configurations which if the value for that column exists then it will be shaded that color. Here is an example input:
'a': {
  'active': True,
  'equals': {'active': True, 'value': 3, 'color': {'r': 255, 'g': 245, 'b': 157, 'a': 1}}, # light yellow
  'greaterThan': {'active': True, 'value': 3, 'color': {'r': 80, 'g': 227, 'b': 194, 'a': 1}}, # mint green
  'lessThan': {'active': True, 'value': 3, 'color': {'r': 245, 'g': 166, 'b': 35, 'a': 1}}, # orange
}
vertical_headers
If set to True then the headers in your grid will be rotated 90 degrees vertically to conserve width.
Predefined Filters
Users can build their own custom filters which can be used from the front-end using the following code snippet:
import pandas as pd
import dtale
import dtale.predefined_filters as predefined_filters
import dtale.global_state as global_state

global_state.set_app_settings(dict(open_predefined_filters_on_startup=True))

predefined_filters.set_filters([
    {
        "name": "A and B > 2",
        "column": "A",
        "description": "Filter A with B greater than 2",
        "handler": lambda df, val: df[(df["A"] == val) & (df["B"] > 2)],
        "input_type": "input",
        "default": 1,
        "active": False,
    },
    {
        "name": "A and (B % 2) == 0",
        "column": "A",
        "description": "Filter A with B mod 2 equals zero (is even)",
        "handler": lambda df, val: df[(df["A"] == val) & (df["B"] % 2 == 0)],
        "input_type": "select",
        "default": 1,
        "active": False,
    },
    {
        "name": "A in values and (B % 2) == 0",
        "column": "A",
        "description": "A is within a group of values and B mod 2 equals zero (is even)",
        "handler": lambda df, val: df[df["A"].isin(val) & (df["B"] % 2 == 0)],
        "input_type": "multiselect",
        "default": [1],
        "active": True,
    }
])

df = pd.DataFrame(
    ([[1, 2, 3, 4, 5, 6], [7, 8, 9, 10, 11, 12], [13, 14, 15, 16, 17, 18]]),
    columns=['A', 'B', 'C', 'D', 'E', 'F']
)
dtale.show(df)
This code illustrates the types of inputs you can have on the front end:
- input: just a simple text input box which users can enter any value they want (if the value specified for
"column"is an int or float it will try to convert the string to that data type) and it will be passed to the handler - select: this creates a dropdown populated with the unique values of
"column"(an asynchronous dropdown if the column has a large amount of unique values) - multiselect: same as "select" but it will allow you to choose multiple values (handy if you want to perform an
isinoperation in your filter)
Here is a demo of the functionality:
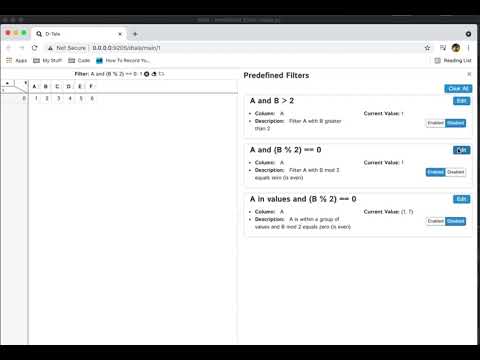
If there are any new types of inputs you would like available please don't hesitate to submit a request on the "Issues" page of the repo.
Using Swifter
Swifter is a package which will increase performance on any apply() function on a pandas series or dataframe. If install the package in your virtual environment
pip install swifter
# or
pip install dtale[swifter]
It will be used for the following operations:
- Standard dataframe formatting in the main grid & chart display
- Column Builders
- Type Conversions
- string hex -> int or float
- int or float -> hex
- mixed -> boolean
- int -> timestamp
- date -> int
- Similarity Distance Calculation
- Type Conversions
- Handling of empty strings when calculating missing counts
- Building unique values by data type in "Describe" popup
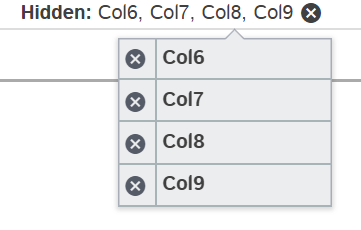
Behavior for Wide Dataframes
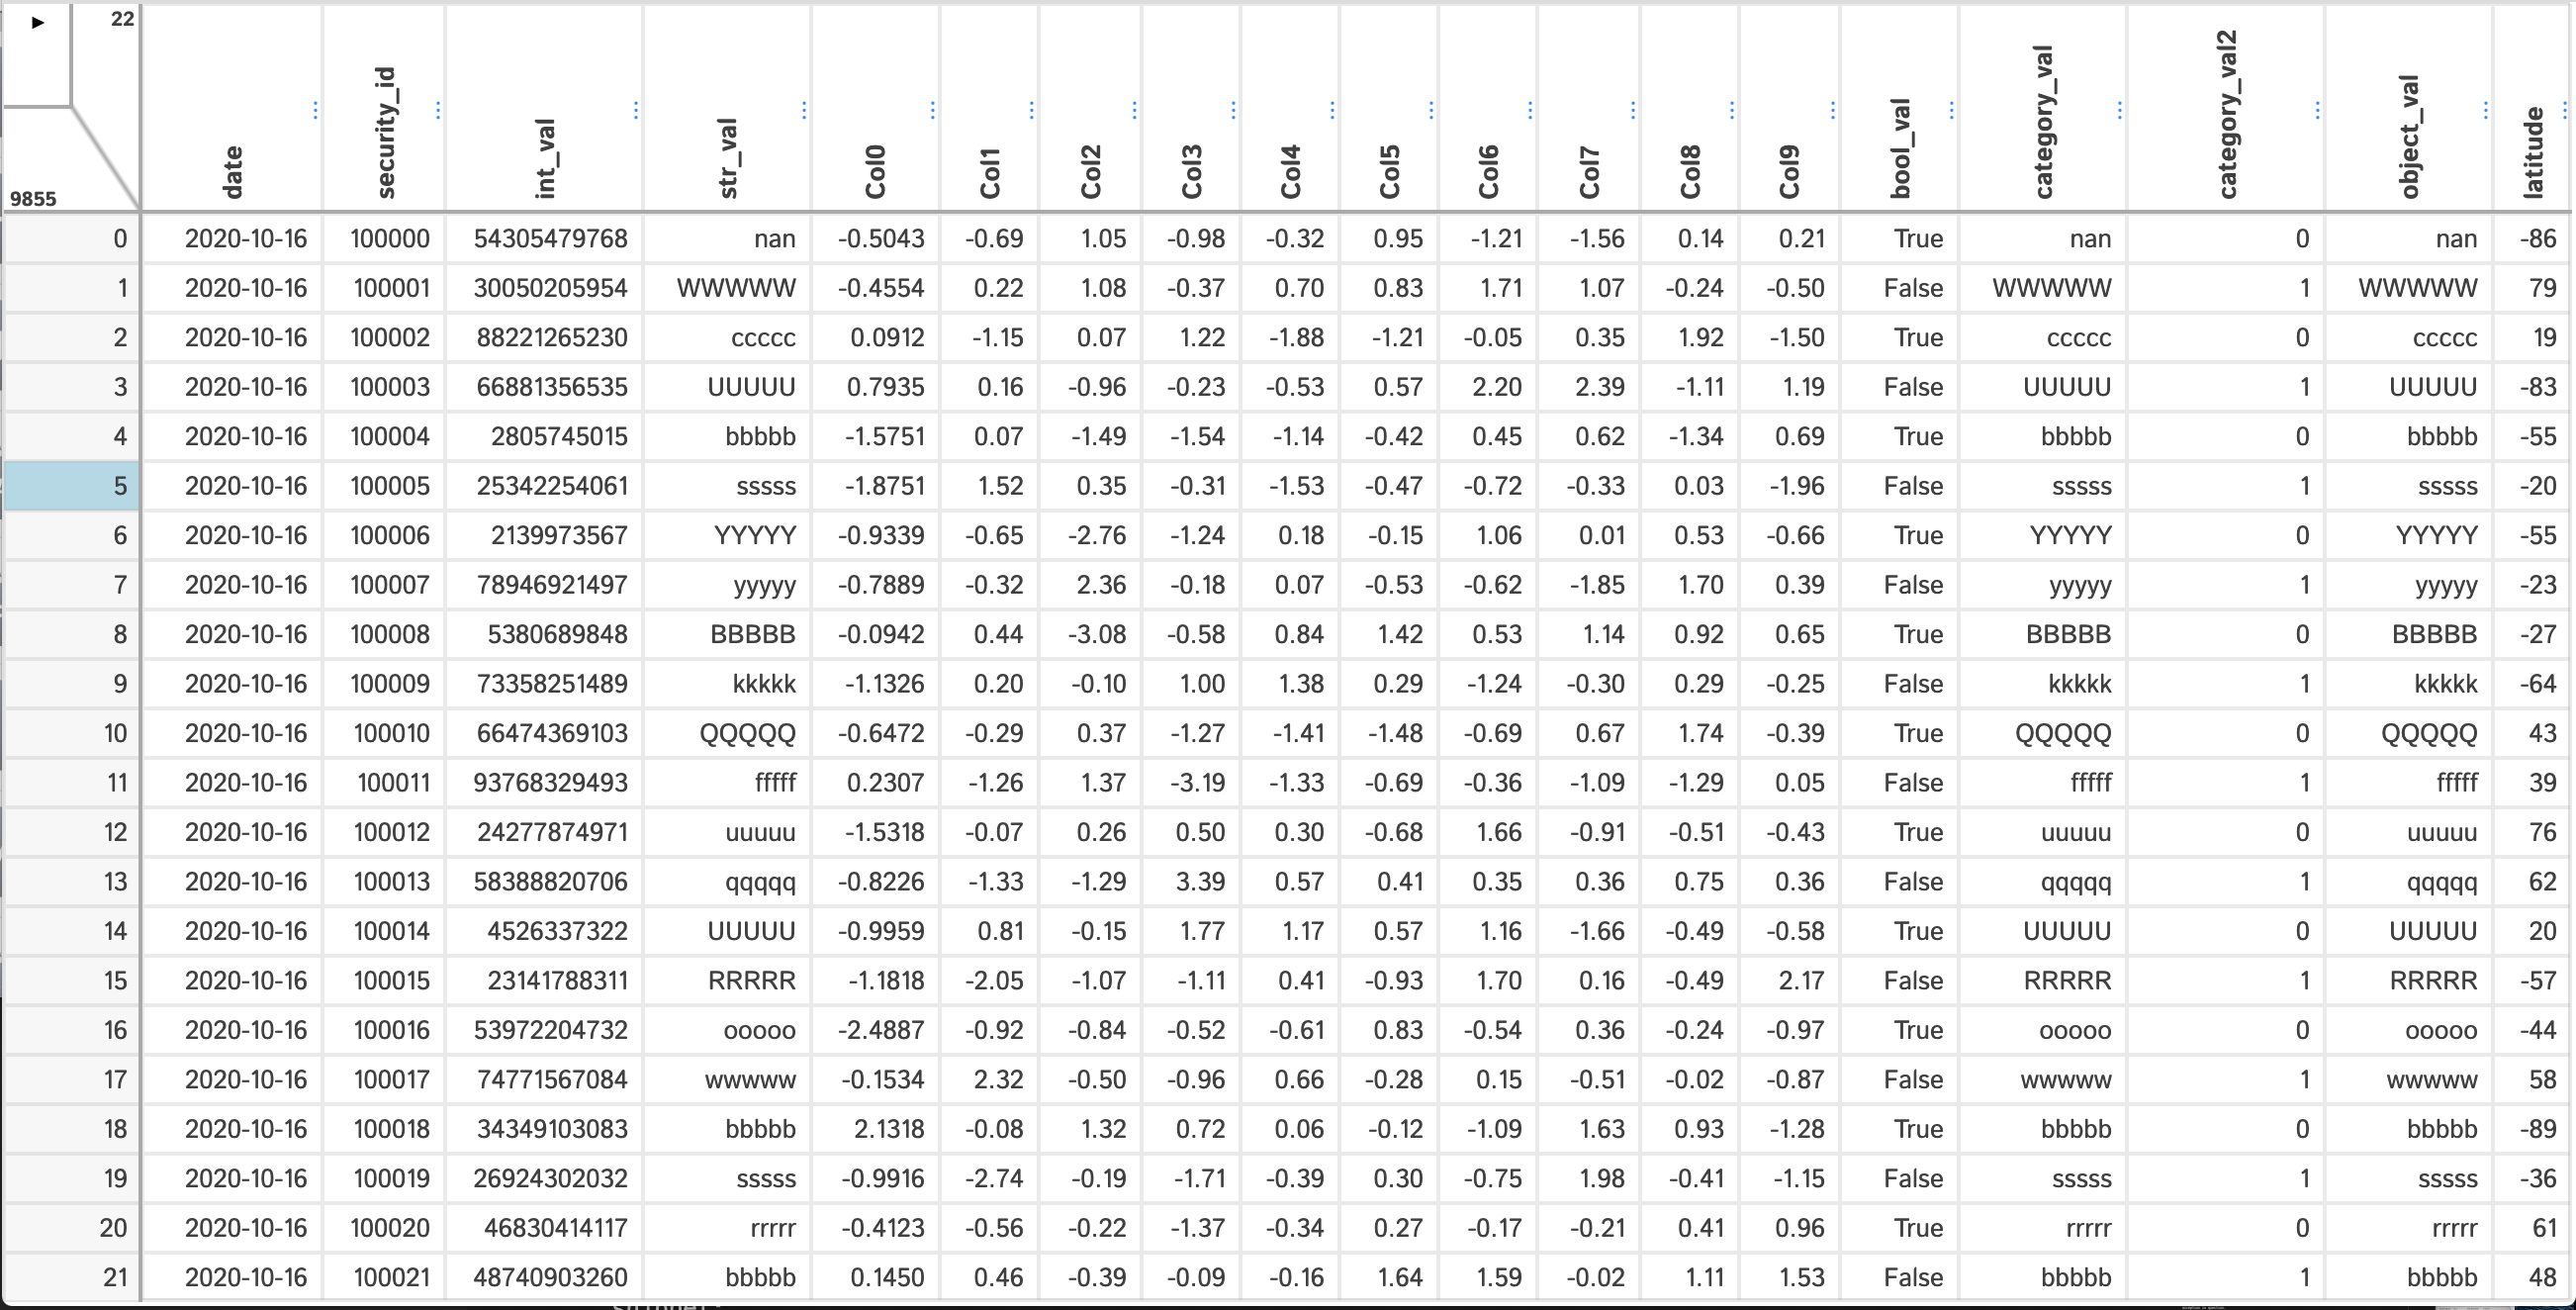
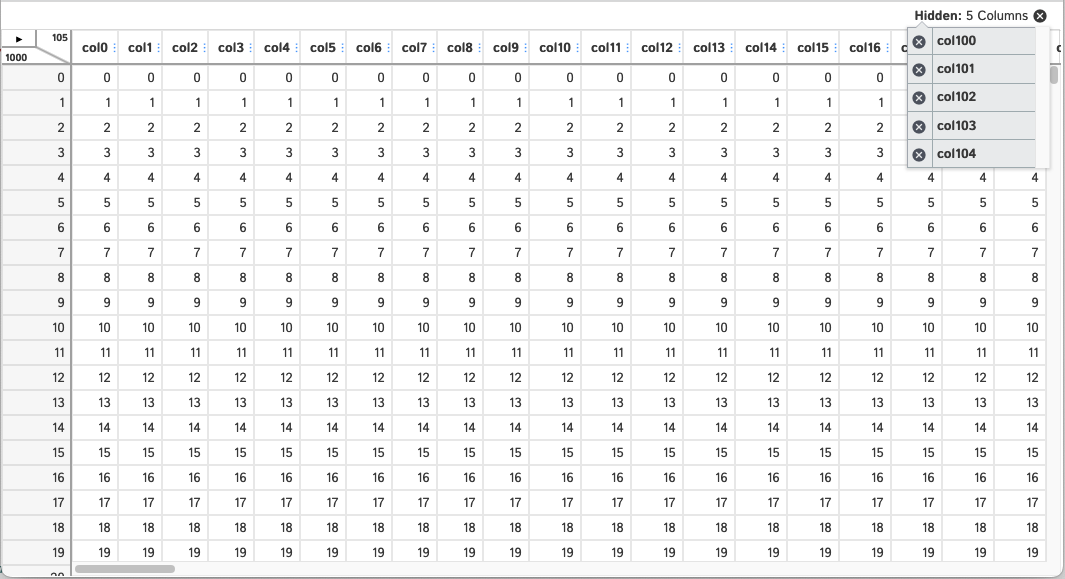
There is currently a performance bottleneck on the front-end when loading "wide dataframes" (dataframes with many columns). The current solution to this problem is that upon initial load of these dataframes to D-Tale any column with an index greater than 100 (going from left to right) will be hidden on the front-end. You can still unhide these columns the same way you would any other and you still have the option to show all columns using the "Describe" popup. Here's a sample of this behavior:
Say you loaded this dataframe into D-Tale.
import pandas as pd
import dtale

dtale.show(pd.DataFrame(
    {'col{}'.format(i): list(range(1000)) for i in range(105)}
))
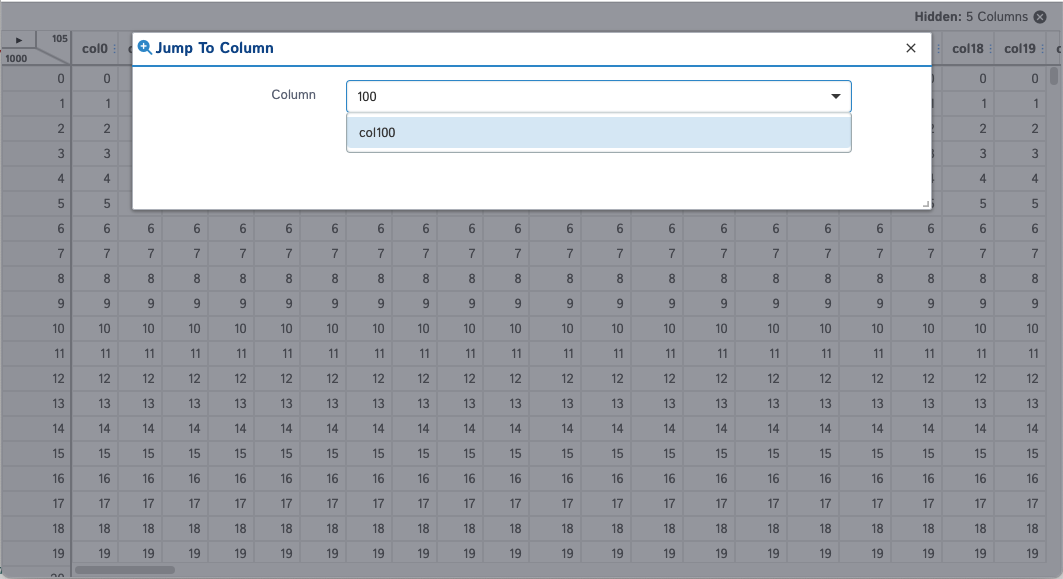
You will now have access to a new "Jump To Column" menu item.
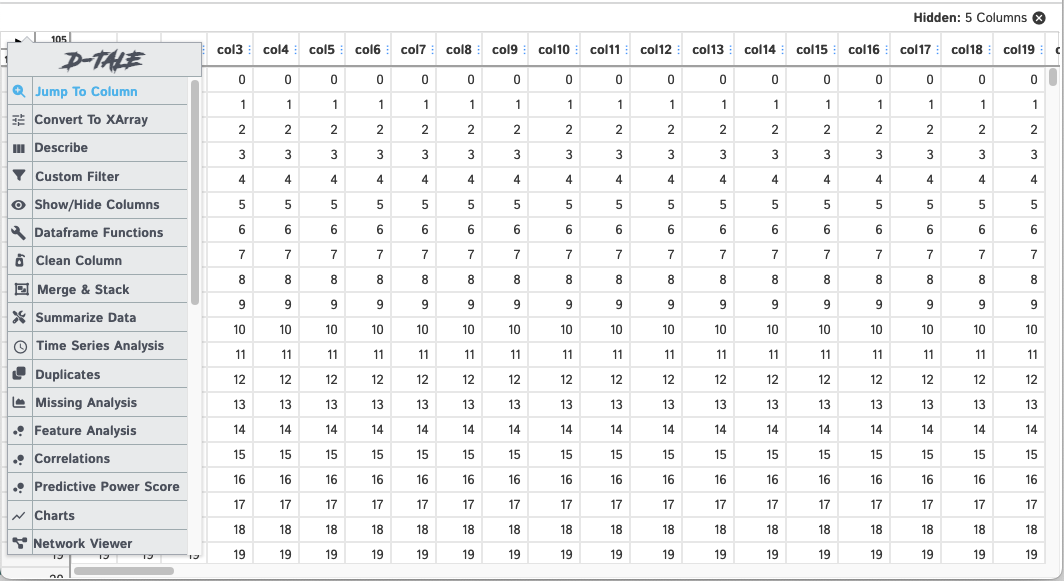
It would be too hard to scroll to the column you're looking for. So now you'll be able to type in the name of the column you're looking for and select it.
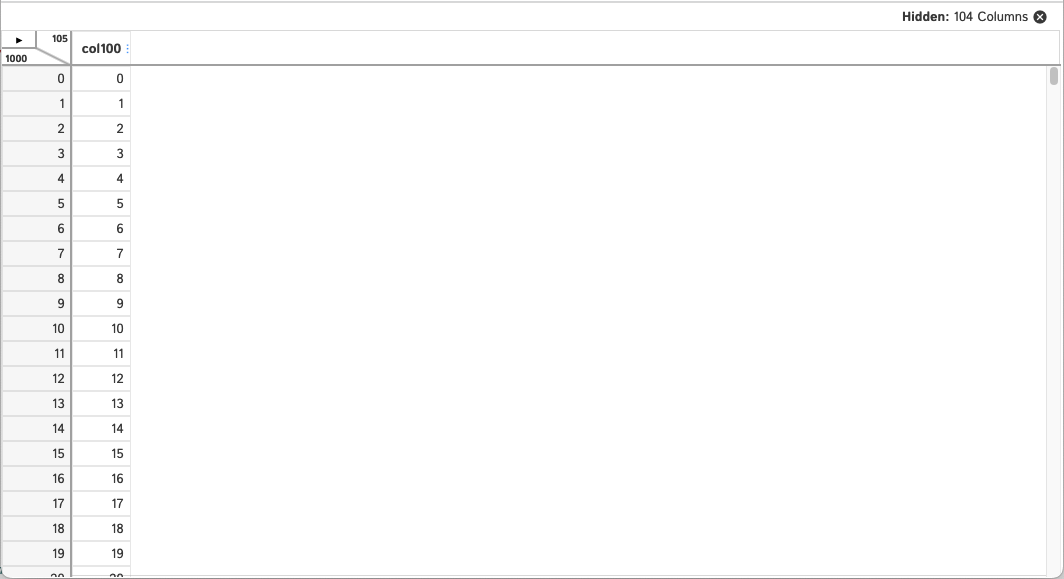
And now you'll see only the columns you've had locked (we've locked no columns in this example) and the column you chose to jump to.
Accessing CLI Loaders in Notebook or Console
I am pleased to announce that all CLI loaders will be available within notebooks & consoles. Here are some examples (the last working if you've installed dtale[arctic]):
dtale.show_csv(path='test.csv', parse_dates=['date'])dtale.show_csv(path='http://csv-endpoint', index_col=0)dtale.show_excel(path='test.xlsx', parse_dates=['date'])dtale.show_excel(path='test.xls', sheet=)dtale.show_excel(path='http://excel-endpoint', index_col=0)dtale.show_json(path='http://json-endpoint', parse_dates=['date'])dtale.show_json(path='test.json', parse_dates=['date'])dtale.show_r(path='text.rda')dtale.show_arctic(uri='uri', library='library', symbol='symbol', start='20200101', end='20200101')dtale.show_arcticdb(uri='uri', library='library', symbol='symbol', start='20200101', end='20200101', use_store=True)
Using ArcticDB as your data store for D-Tale
So one of the major drawbacks of using D-Tale is that it stores a copy of your dataframe in memory (unless you specify the inplace=True when calling dtale.show). One way around this is to switch your storage mechanism to ArcticDB. This will use ArcticDB's QueryBuilder to perform all data loading and filtering. This will significantly drop your memory footprint, but it will remove a lot of the original D-Tale functionality:
- Custom Filtering
- Range filtering in Numeric Column Filters
- Regex filtering on String Column Filters
- Editing Cells
- Data Reshaping
- Dataframe Functions
- Drop Filtered Rows
- Sorting
If the symbol you're loading from ArcticDB contains more than 1,000,000 rows then you will also lose the following:
- Column Filtering using dropdowns of unique values (you'll have to manually type your values)
- Outlier Highlighting
- Most of the details in the "Describe" screen
In order to update your storage mechanism there are a few options, the first being use_arcticdb_store:
import dtale.global_state as global_state
import dtale

global_state.use_arcticdb_store(uri='lmdb:///<path>')
dtale.show_arcticdb(library='my_lib', symbol='my_symbol')
Or you can set your library ahead of time so you can use dtale.show:
import dtale.global_state as global_state
import dtale

global_state.use_arcticdb_store(uri='lmdb:///<path>', library='my_lib')
dtale.show('my_symbol')
Or you can set your library using dtale.show with a pipe-delimited identifier:
import dtale.global_state as global_state
import dtale

global_state.use_arcticdb_store(uri='lmdb:///<path>')
dtale.show('my_lib|my_symbol')
You can also do everything using dtale.show_arcticdb:
import dtale

dtale.show_arcticdb(uri='lmdb:///<path>', library='my_lib', symbol='my_symbol', use_store=True)
Navigating to different libraries/symbols in your ArcticDB database
When starting D-Tale with no data
import dtale.global_state as global_state
import dtale

global_state.use_arcticdb_store(uri='lmdb:///<path>')
dtale.show()
you'll be presented with this screen on startup
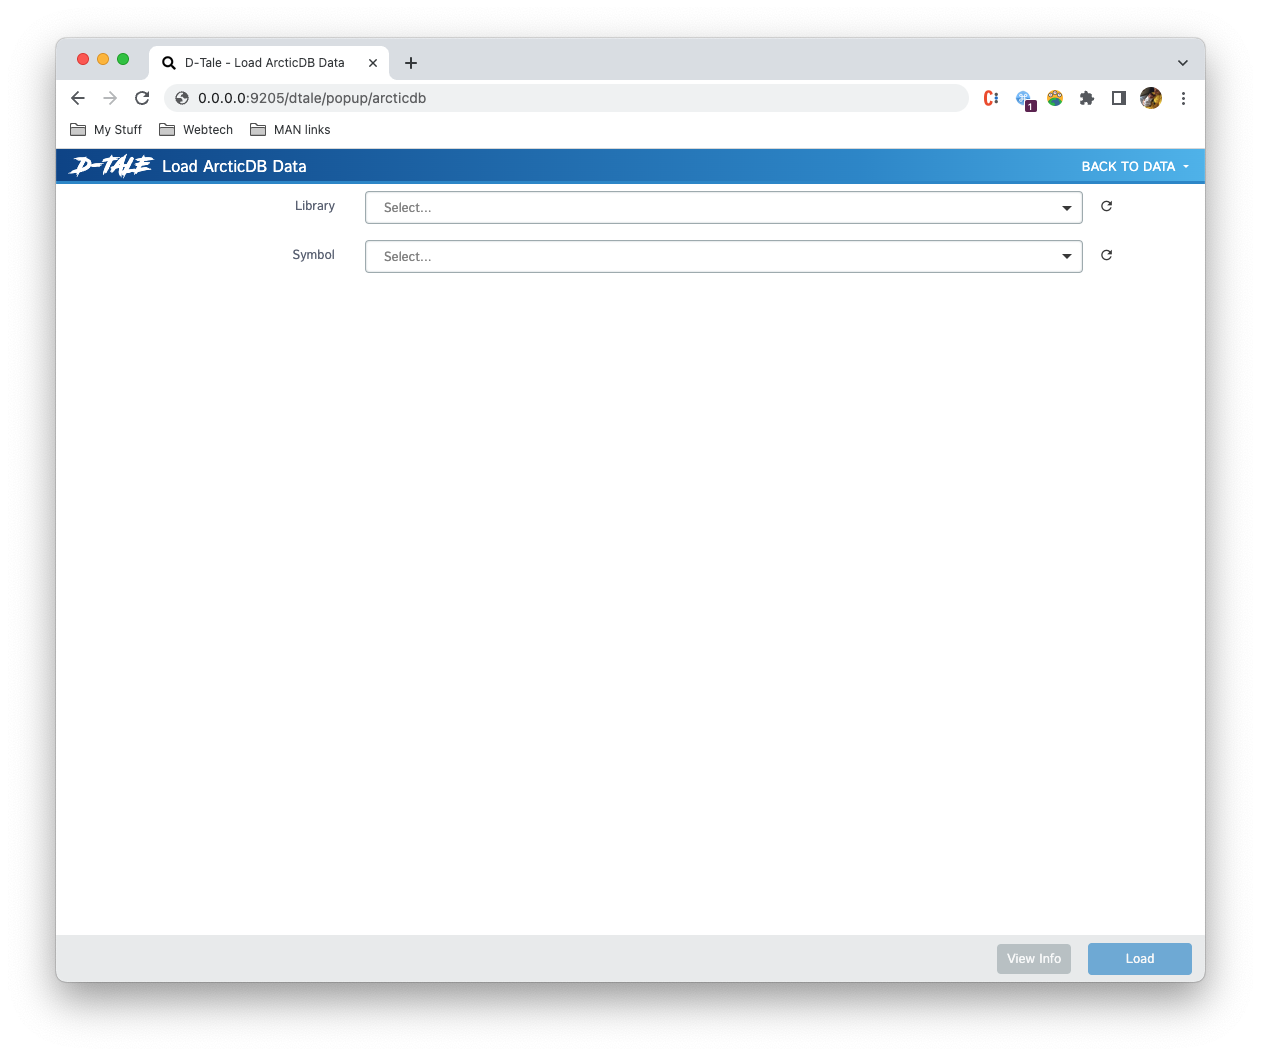
Once you choose a library and a symbol you can click "Load" and it will bring you to the main grid comprised of the data for that symbol.
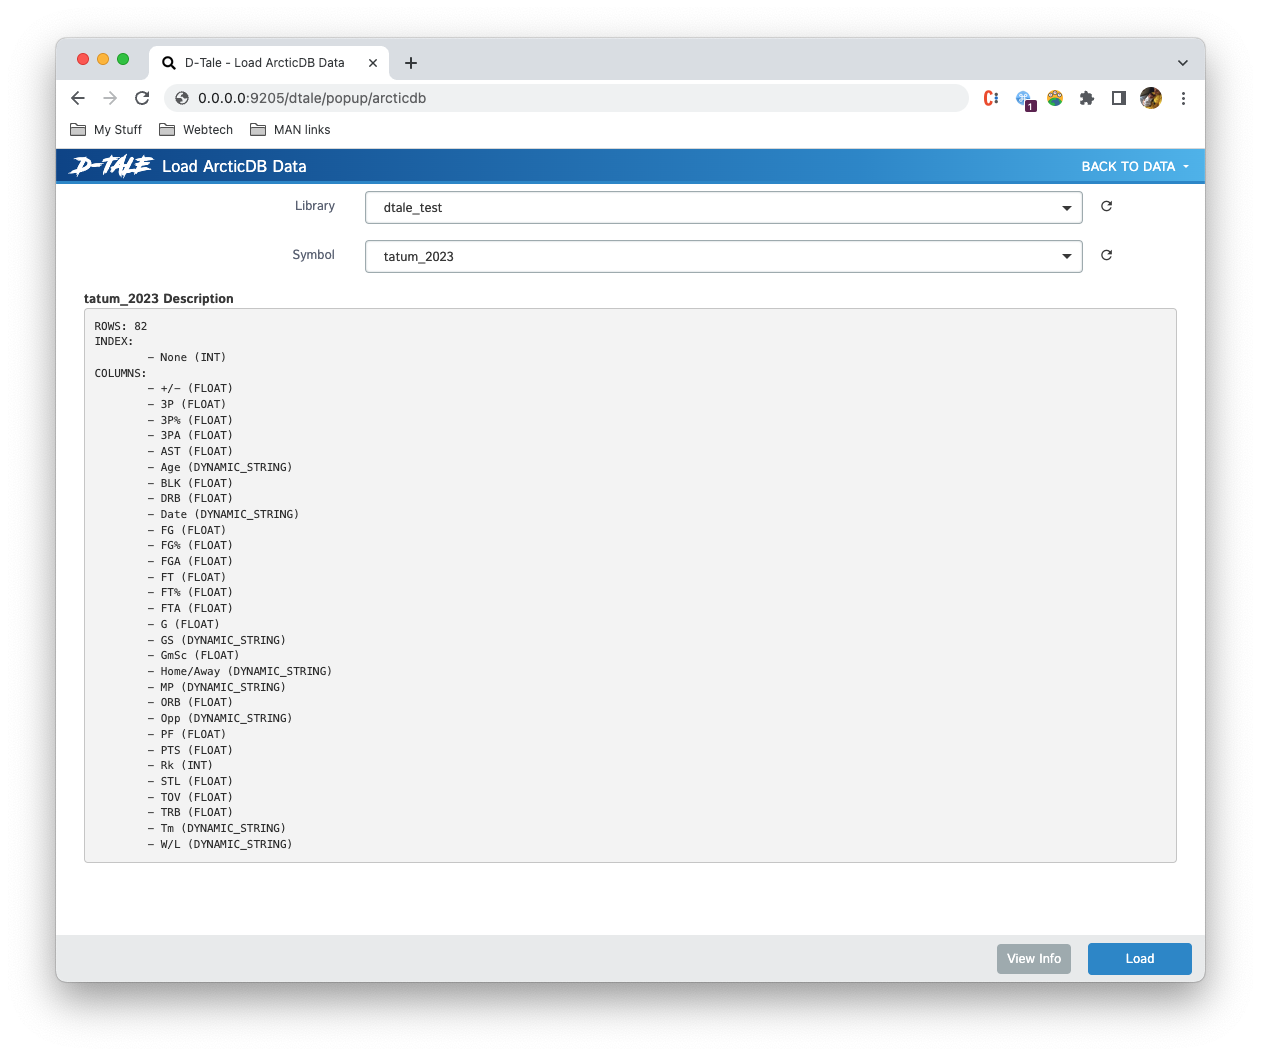
You can also view information about the symbol you've selected before loading it by clicking the "Info" button
UI
Once you have kicked off your D-Tale session please copy & paste the link on the last line of output in your browser
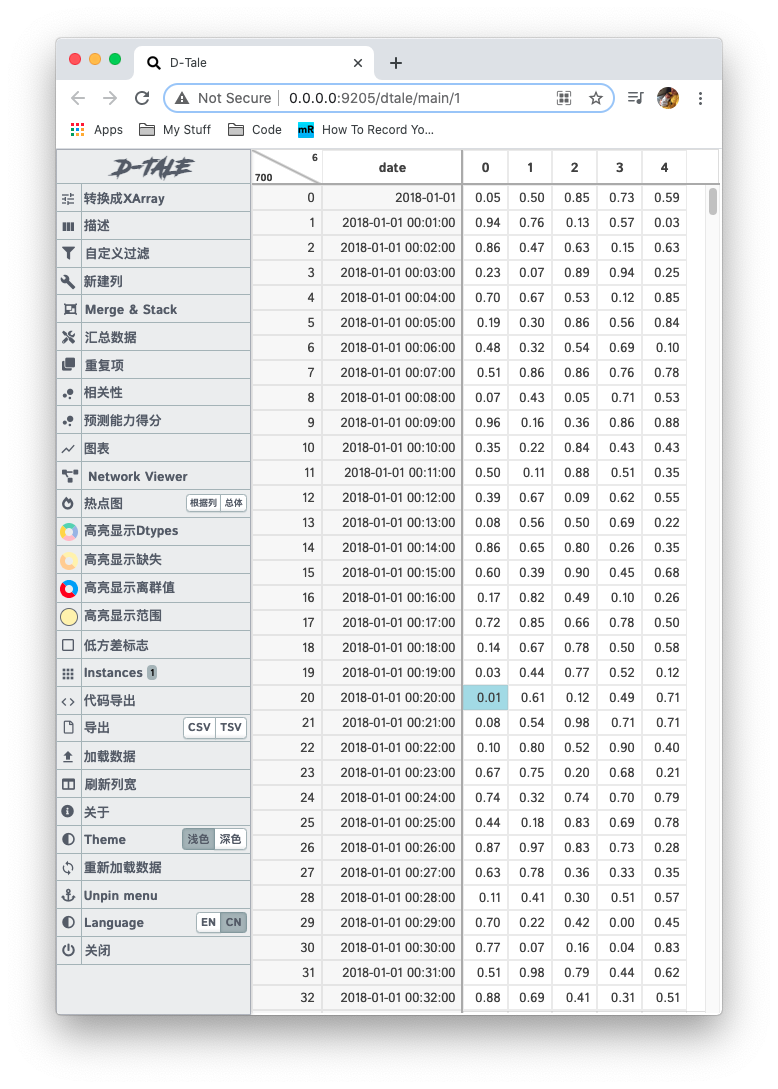
Dimensions/Ribbon Menu/Main Menu
The information in the upper right-hand corner gives grid dimensions 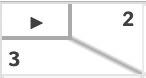
- lower-left => row count
- upper-right => column count
Ribbon Menu
- hovering around to top of your browser will display a menu items (similar to the ones in the main menu) across the top of the screen
- to close the menu simply click outside the menu and/or dropdowns from the menu
Main Menu
- clicking the triangle displays the menu of standard functions (click outside menu to close it)
Header
The header gives users an idea of what operations have taken place on your data (sorts, filters, hidden columns). These values will be persisted across broswer instances. So if you perform one of these operations and then send a link to one of your colleagues they will see the same thing :)
Notice the "X" icon on the right of each display. Clicking this will remove those operations.
When performing multiple of the same operation the description will become too large to display so the display will truncate the description and if users click it they will be presented with a tooltip where you can crop individual operations. Here are some examples:
| Sorts | Filters | Hidden Columns |
|---|---|---|
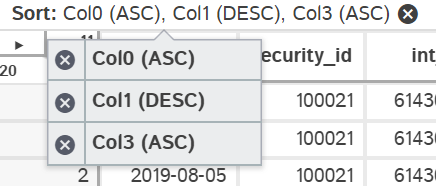 | 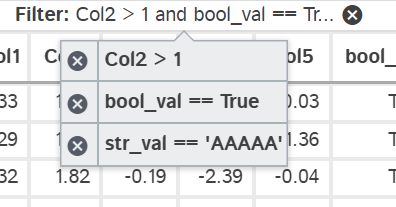 |  |
Resize Columns
Currently there are two ways which you can resize columns.
- Dragging the right border of the column's header cell.
- Altering the "Maximum Column Width" property from the ribbon menu.
- Side Note: You can also set the
max_column_widthproperty ahead of time in your global configuration or programmatically using:
import dtale.global_state as global_state

global_state.set_app_settings(dict(max_column_width=100))
Editing Cells
You may edit any cells in your grid (with the exception of the row indexes or headers, the ladder can be edited using the Rename column menu function).
In order to edit a cell simply double-click on it. This will convert it into a text-input field and you should see a blinking cursor. In addition to turning that cell into an input it will also display an input at the top of the screen for better viewing of long strings. It is assumed that the value you type in will match the data type of the column you editing. For example:
- integers -> should be a valid positive or negative integer
- float -> should be a valid positive or negative float
- string -> any valid string will do
- category -> either a pre-existing category or this will create a new category for (so beware!)
- date, timestamp, timedelta -> should be valid string versions of each
- boolean -> any string you input will be converted to lowercase and if it equals "true" then it will make the cell
True, otherwiseFalse
Users can make use of two protected values as well:
- "nan" ->
numpy.nan - "inf" ->
numpy.inf
To save your change simply press "Enter" or to cancel your changes press "Esc".
If there is a conversion issue with the value you have entered it will display a popup with the specific exception in question.
Here's a quick demo:
Here's a demo of editing cells with long strings:
Copy Cells Into Clipboard
| Select | Copy | Paste |
|---|---|---|
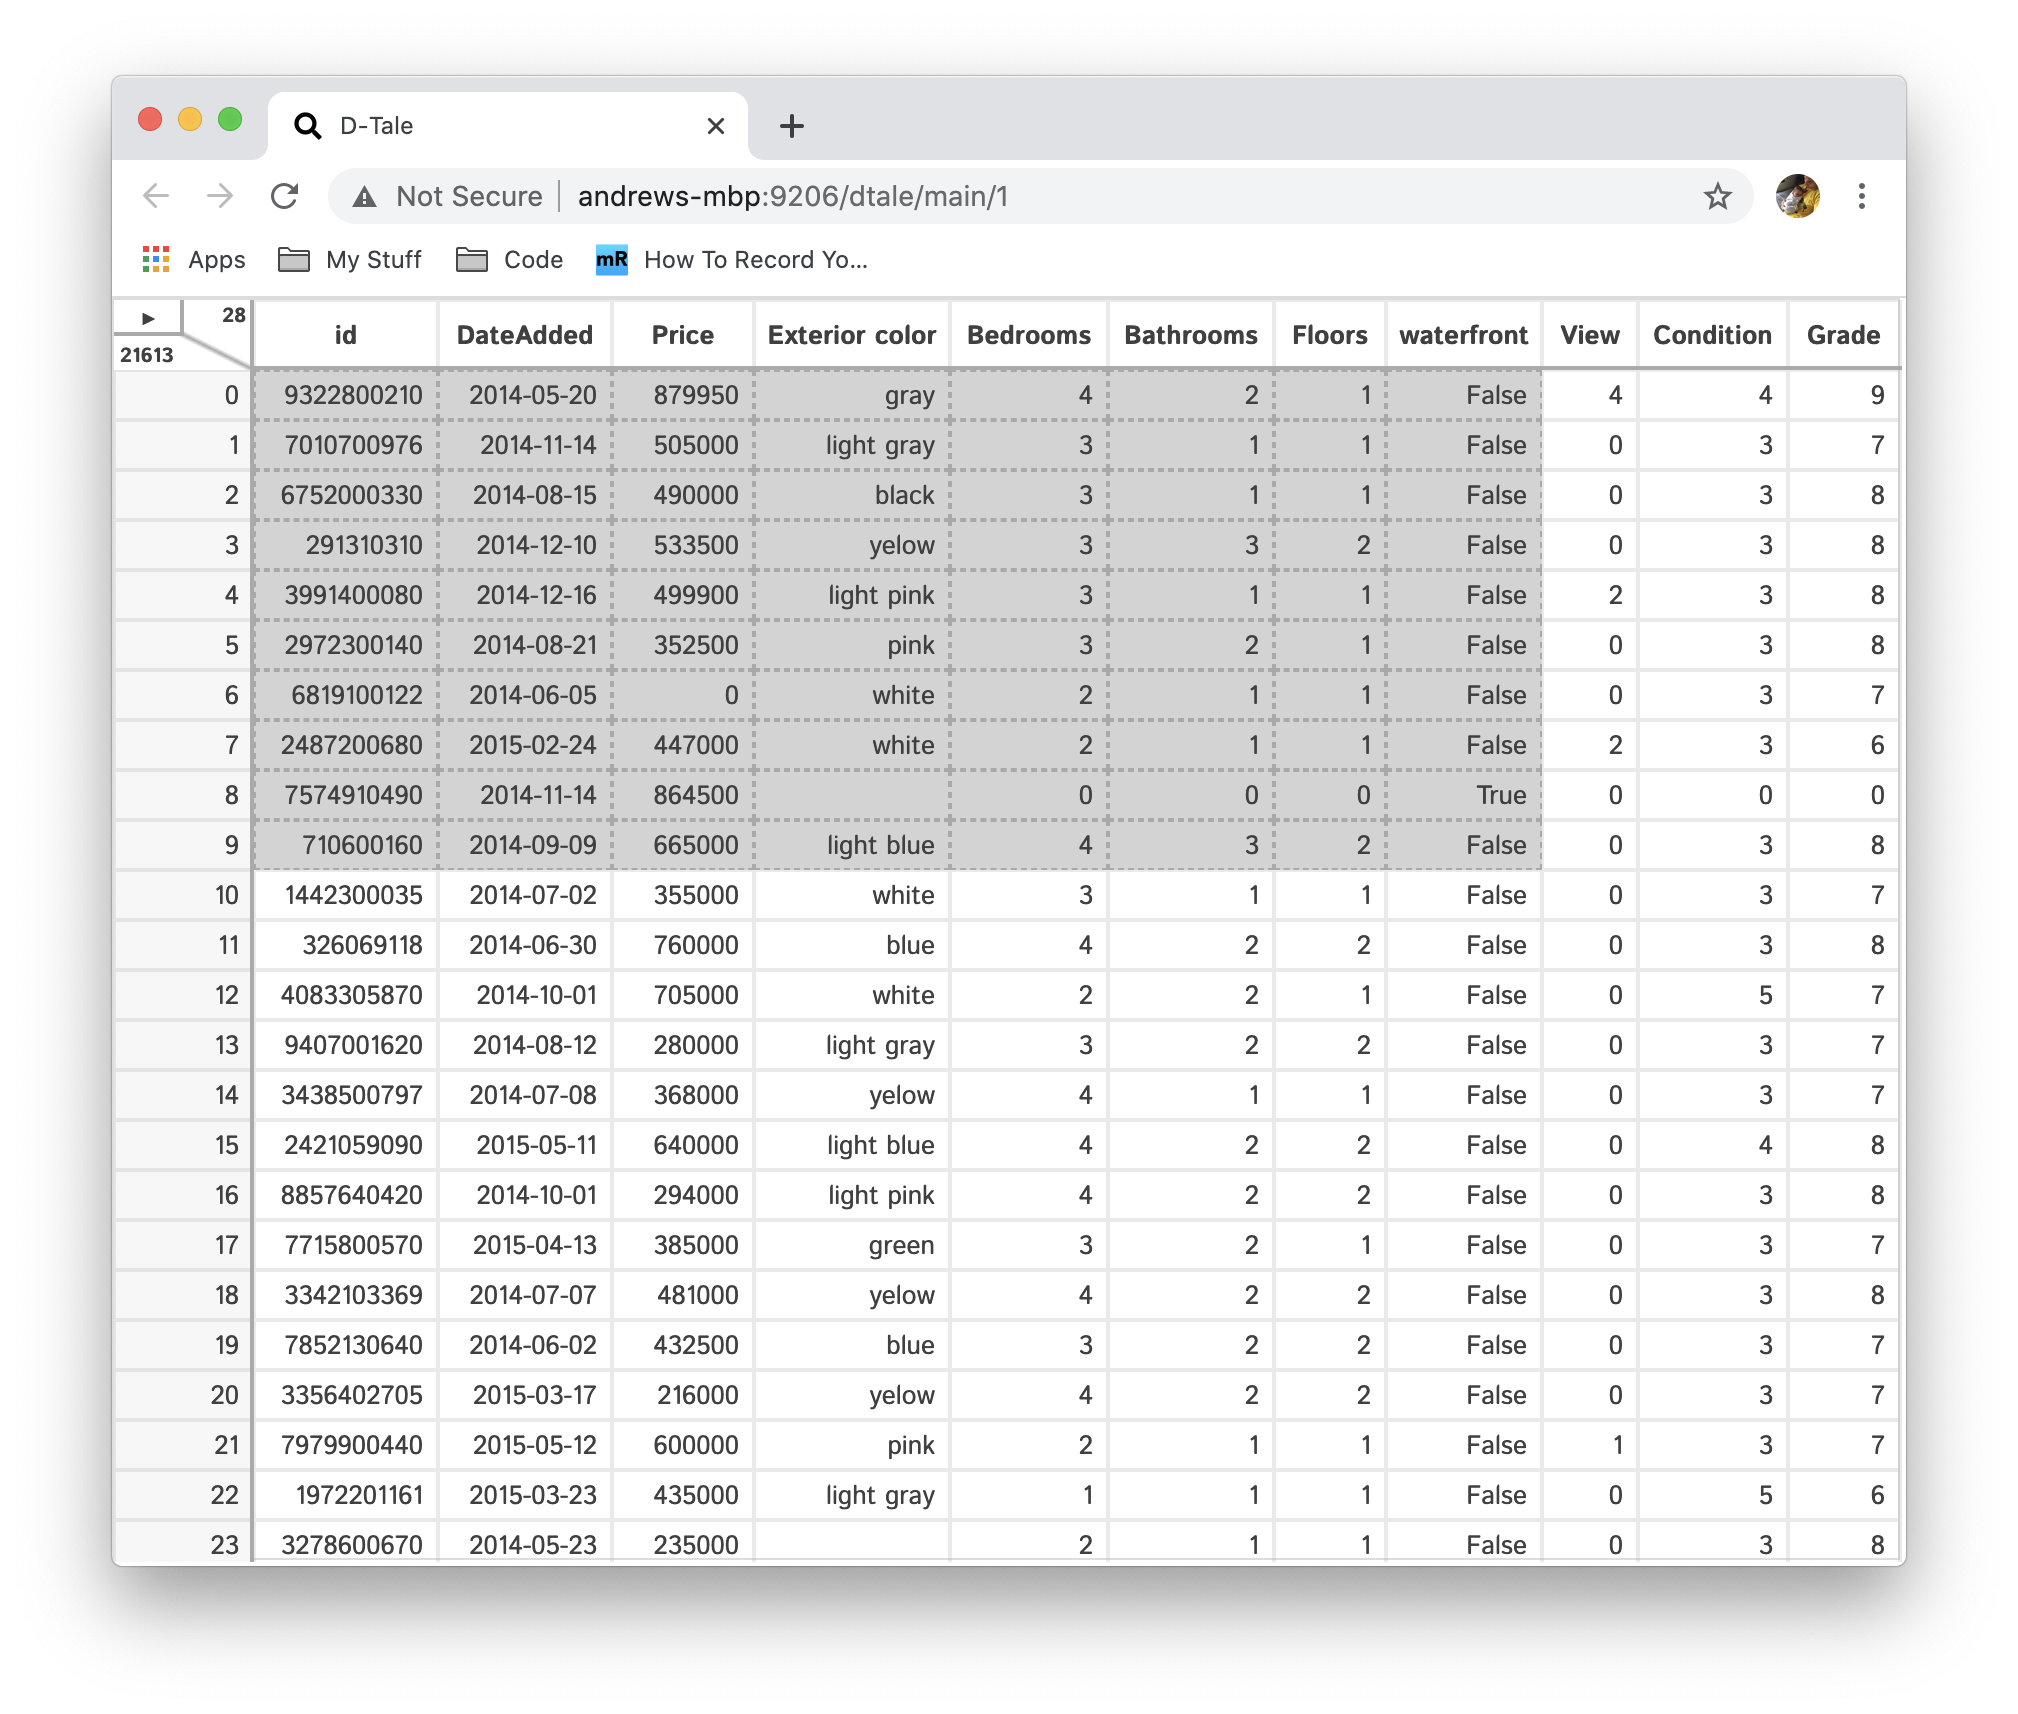 | 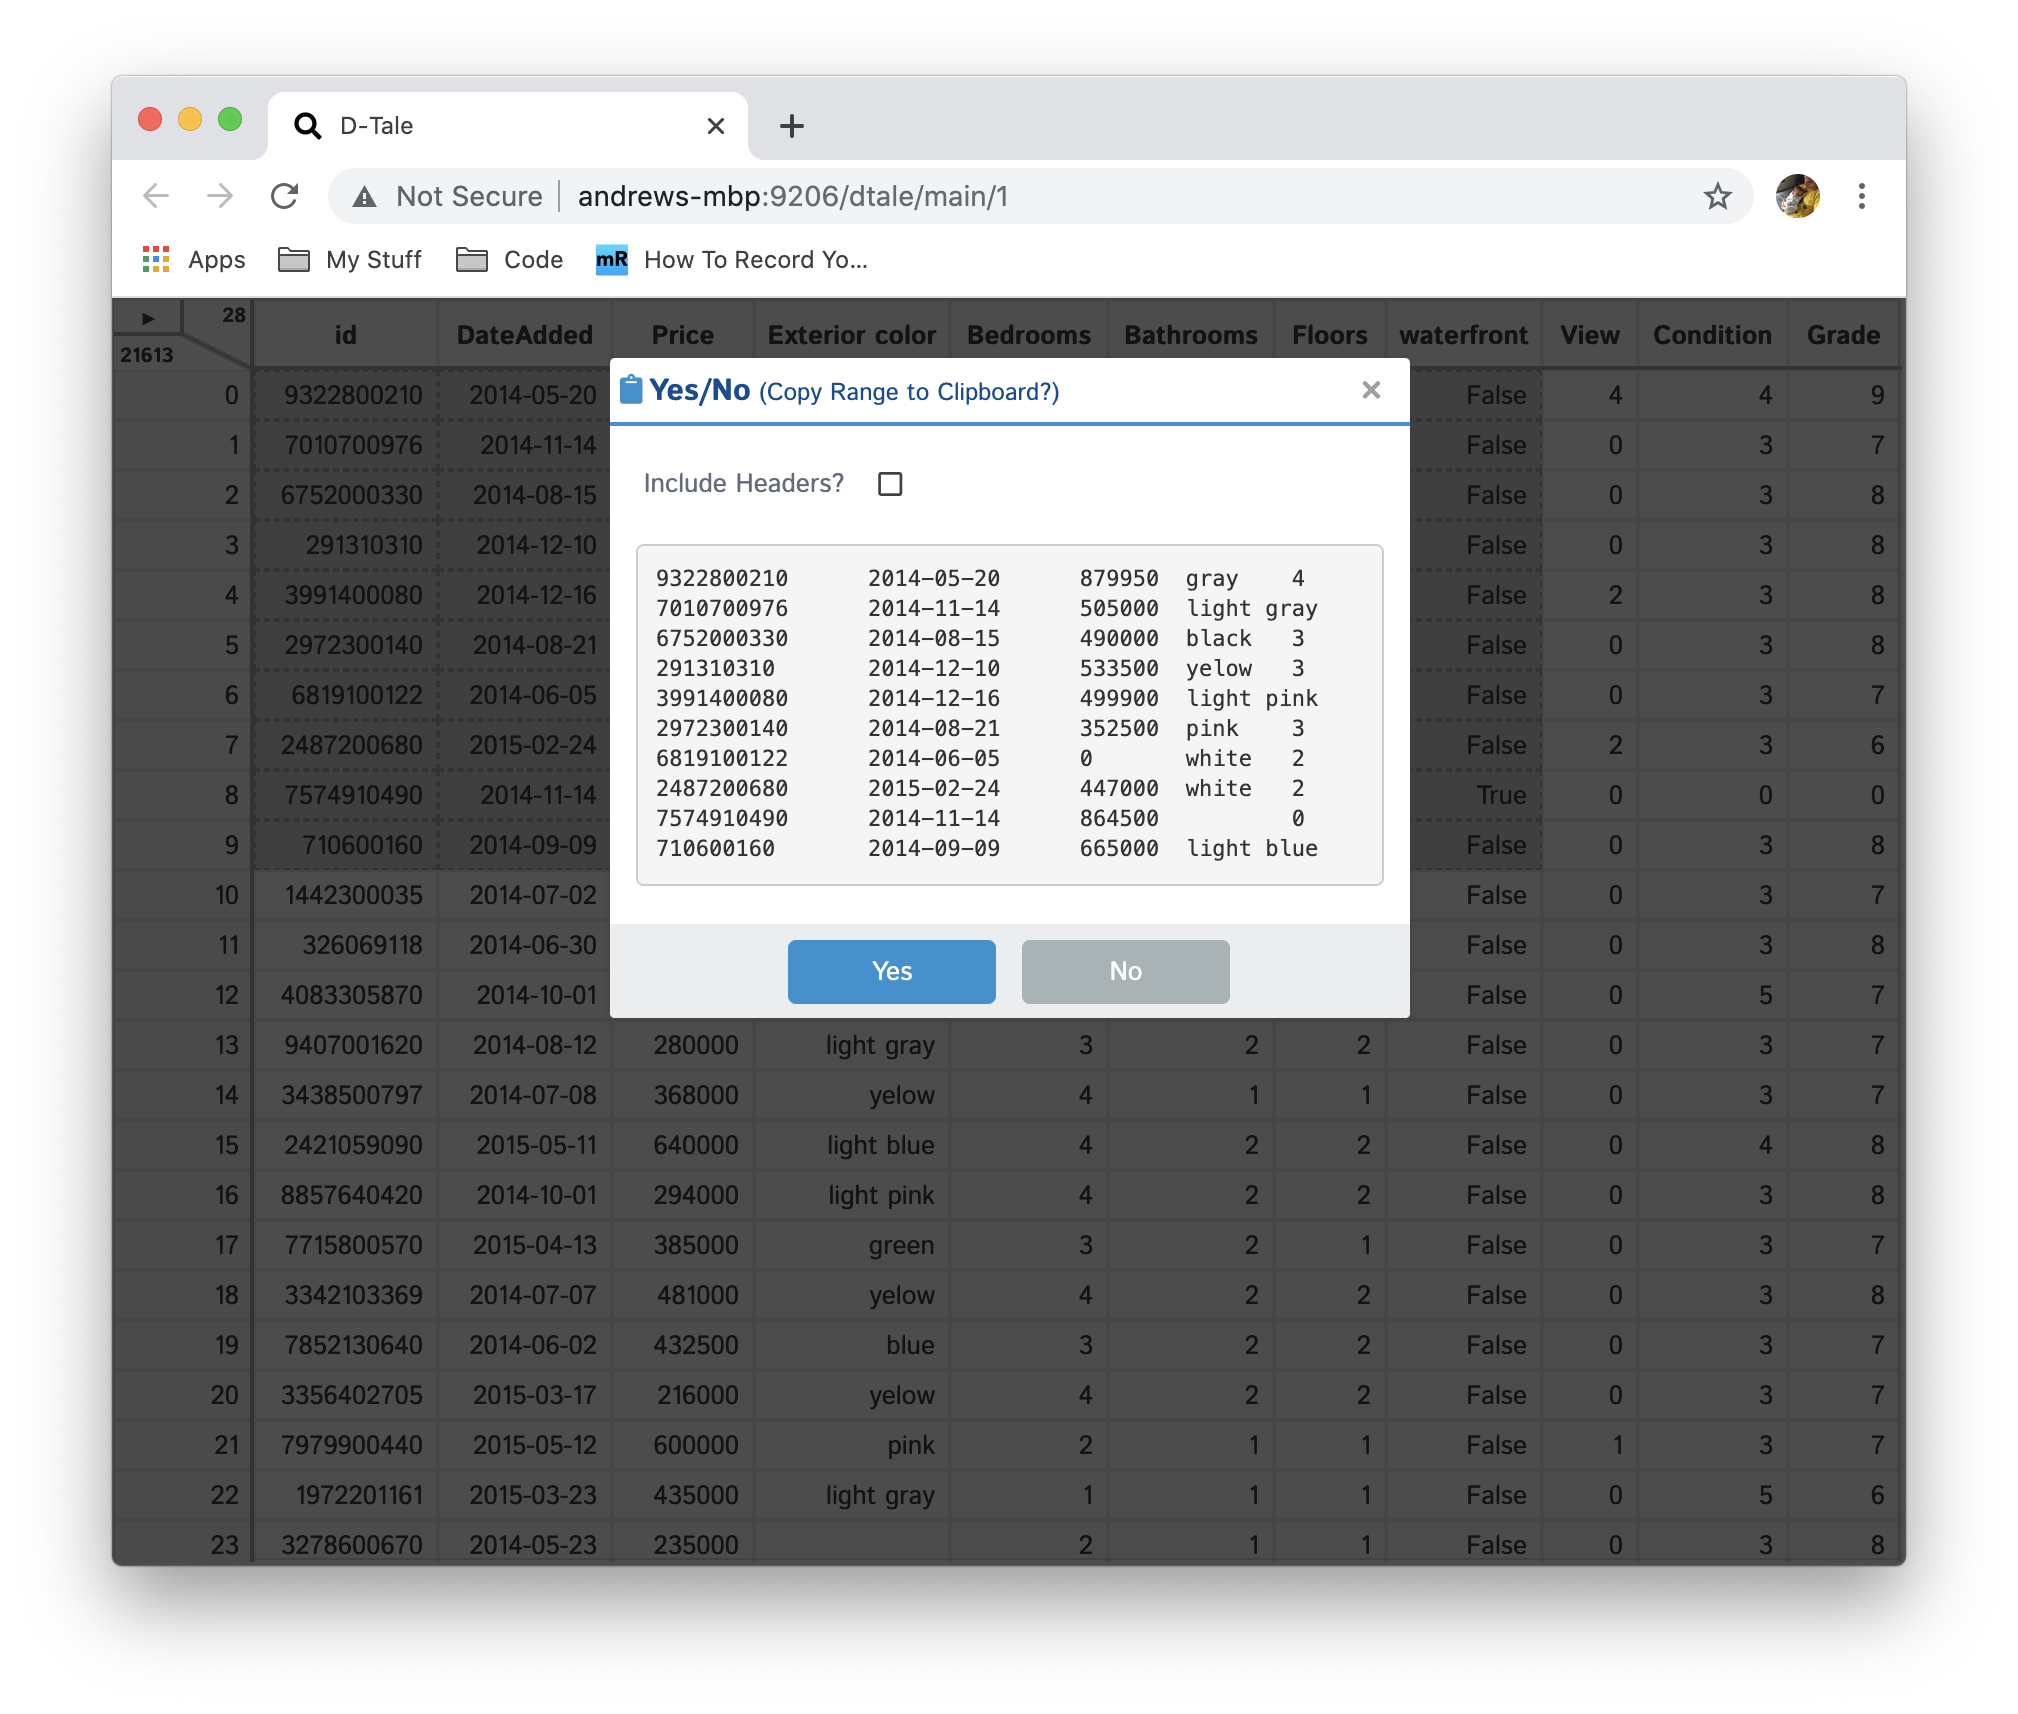 |  |
One request that I have heard time and time again while working on D-Tale is "it would be great to be able to copy a range of cells into excel". Well here is how that is accomplished:
- Shift + Click on a cell
- Shift + Click on another cell (this will trigger a popup)
- Choose whether you want to include headers in your copy by clicking the checkbox
- Click Yes
- Go to your excel workbook and execute Ctrl + V or manually choose "Paste"
- You can also paste this into a standard text editor and what you're left with is tab-delimited data
Main Menu Functions
XArray Operations
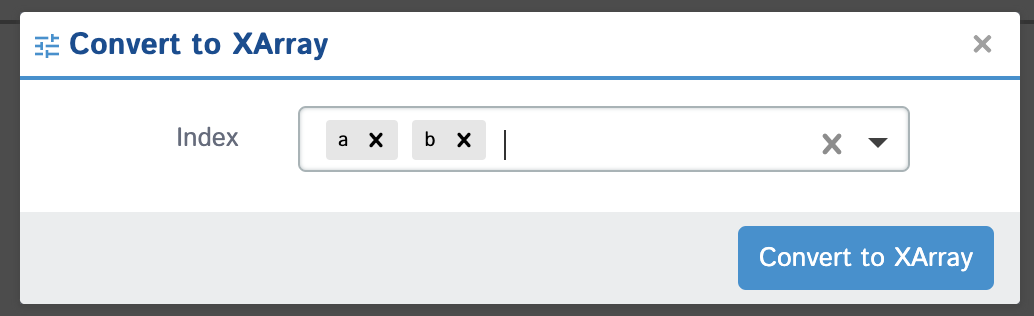
- Convert To XArray: If you have are currently viewing a pandas dataframe in D-Tale you will be given this option to convert your data to an
xarray.Dataset. It is as simple as selecting one or many columns as an index and then your dataframe will be converted to a dataset (df.set_index([...]).to_xarray()) which makes toggling between indexes slices much easier.
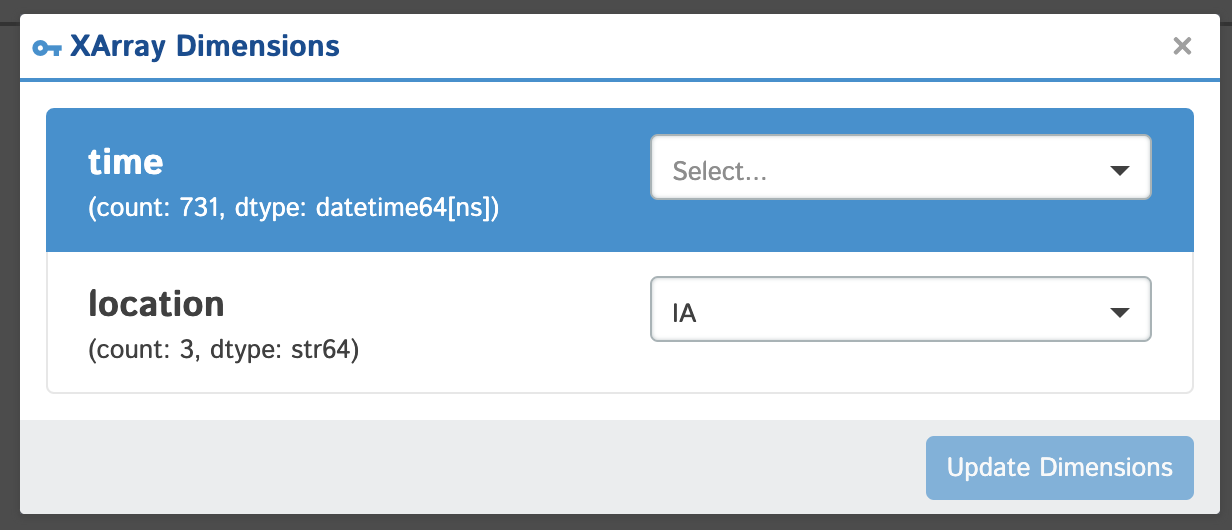
- XArray Dimensions: If you are currently viewing data associated with an
xarray.Datasetyou will be given the ability to toggle which dimension coordinates you're viewing by clicking this button. You can select values for all, some or none (all data - no filter) of your coordinates and the data displayed in your grid will match your selections. Under the hood the code being executed is as follows:ds.sel(dim1=coord1,...).to_dataframe()
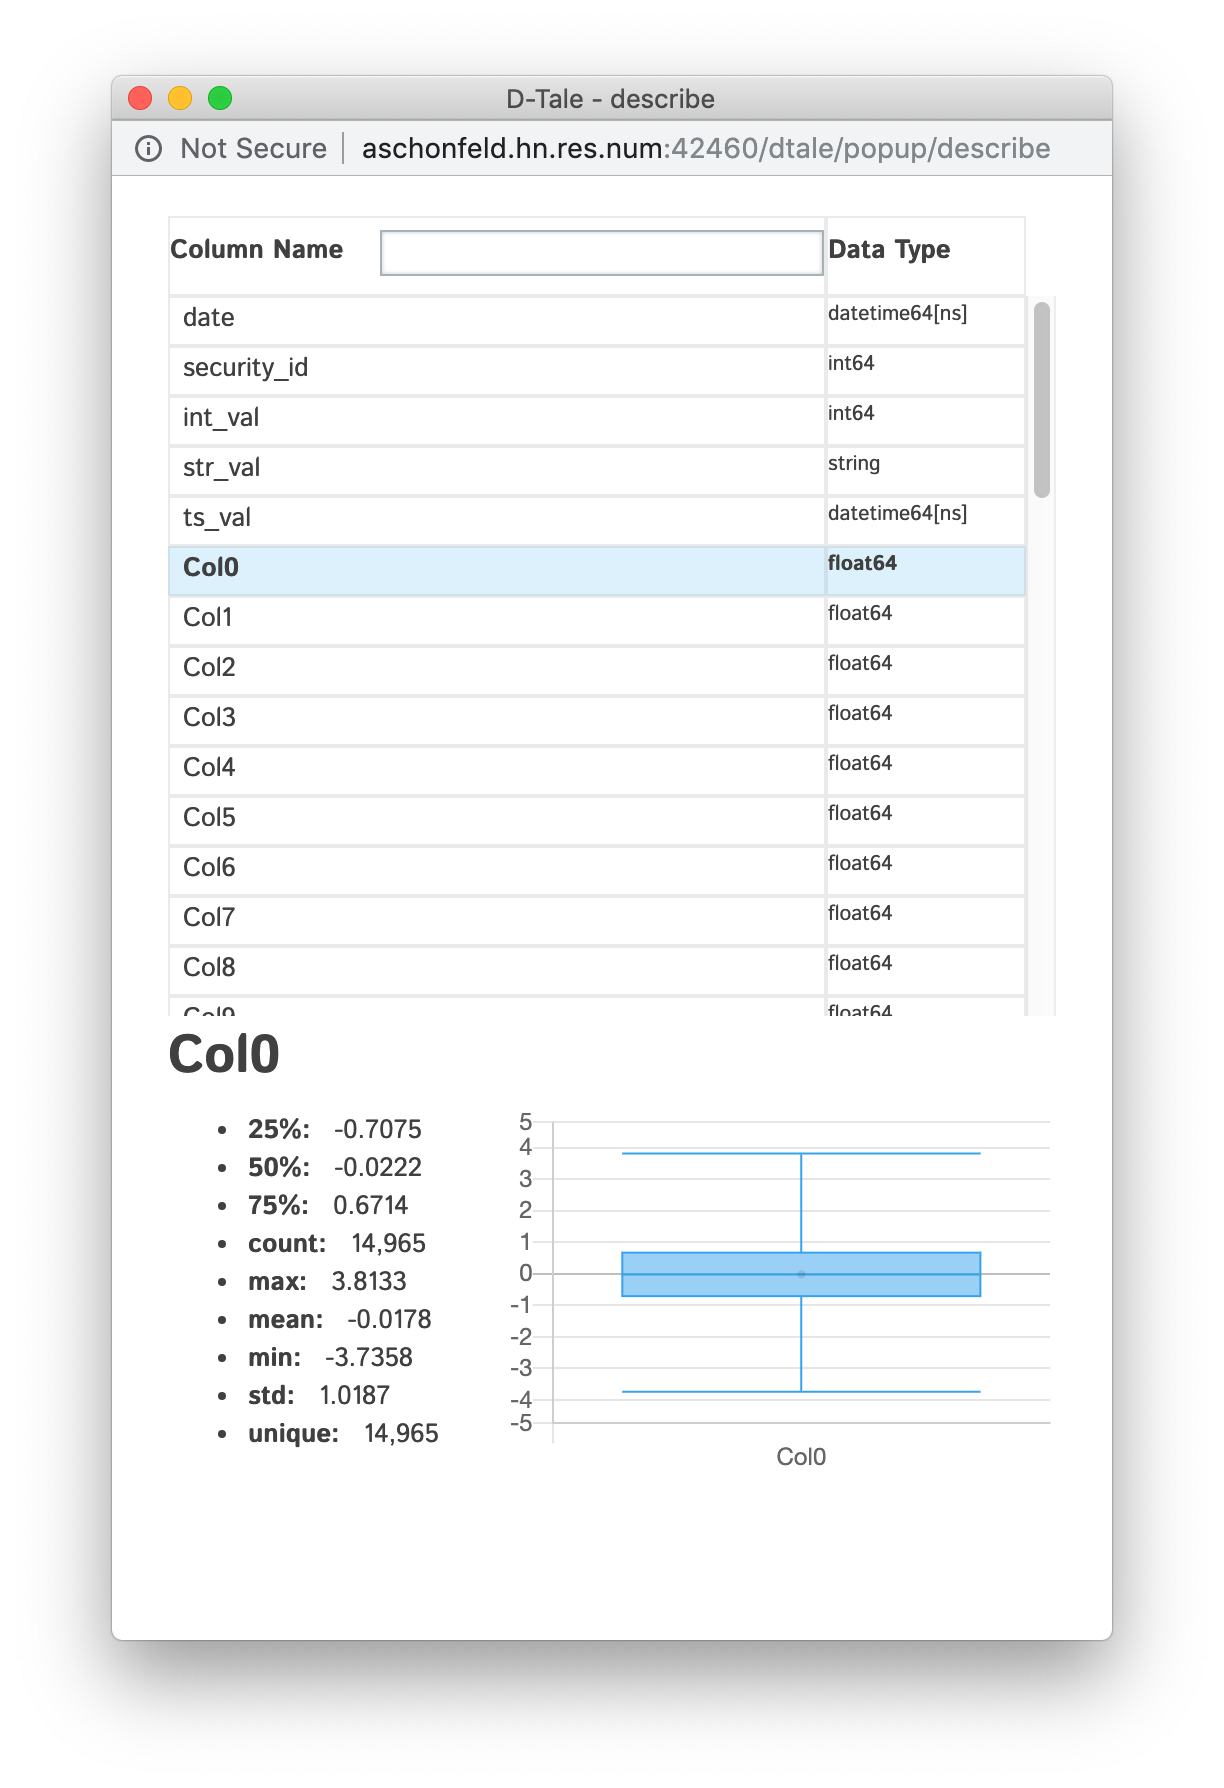
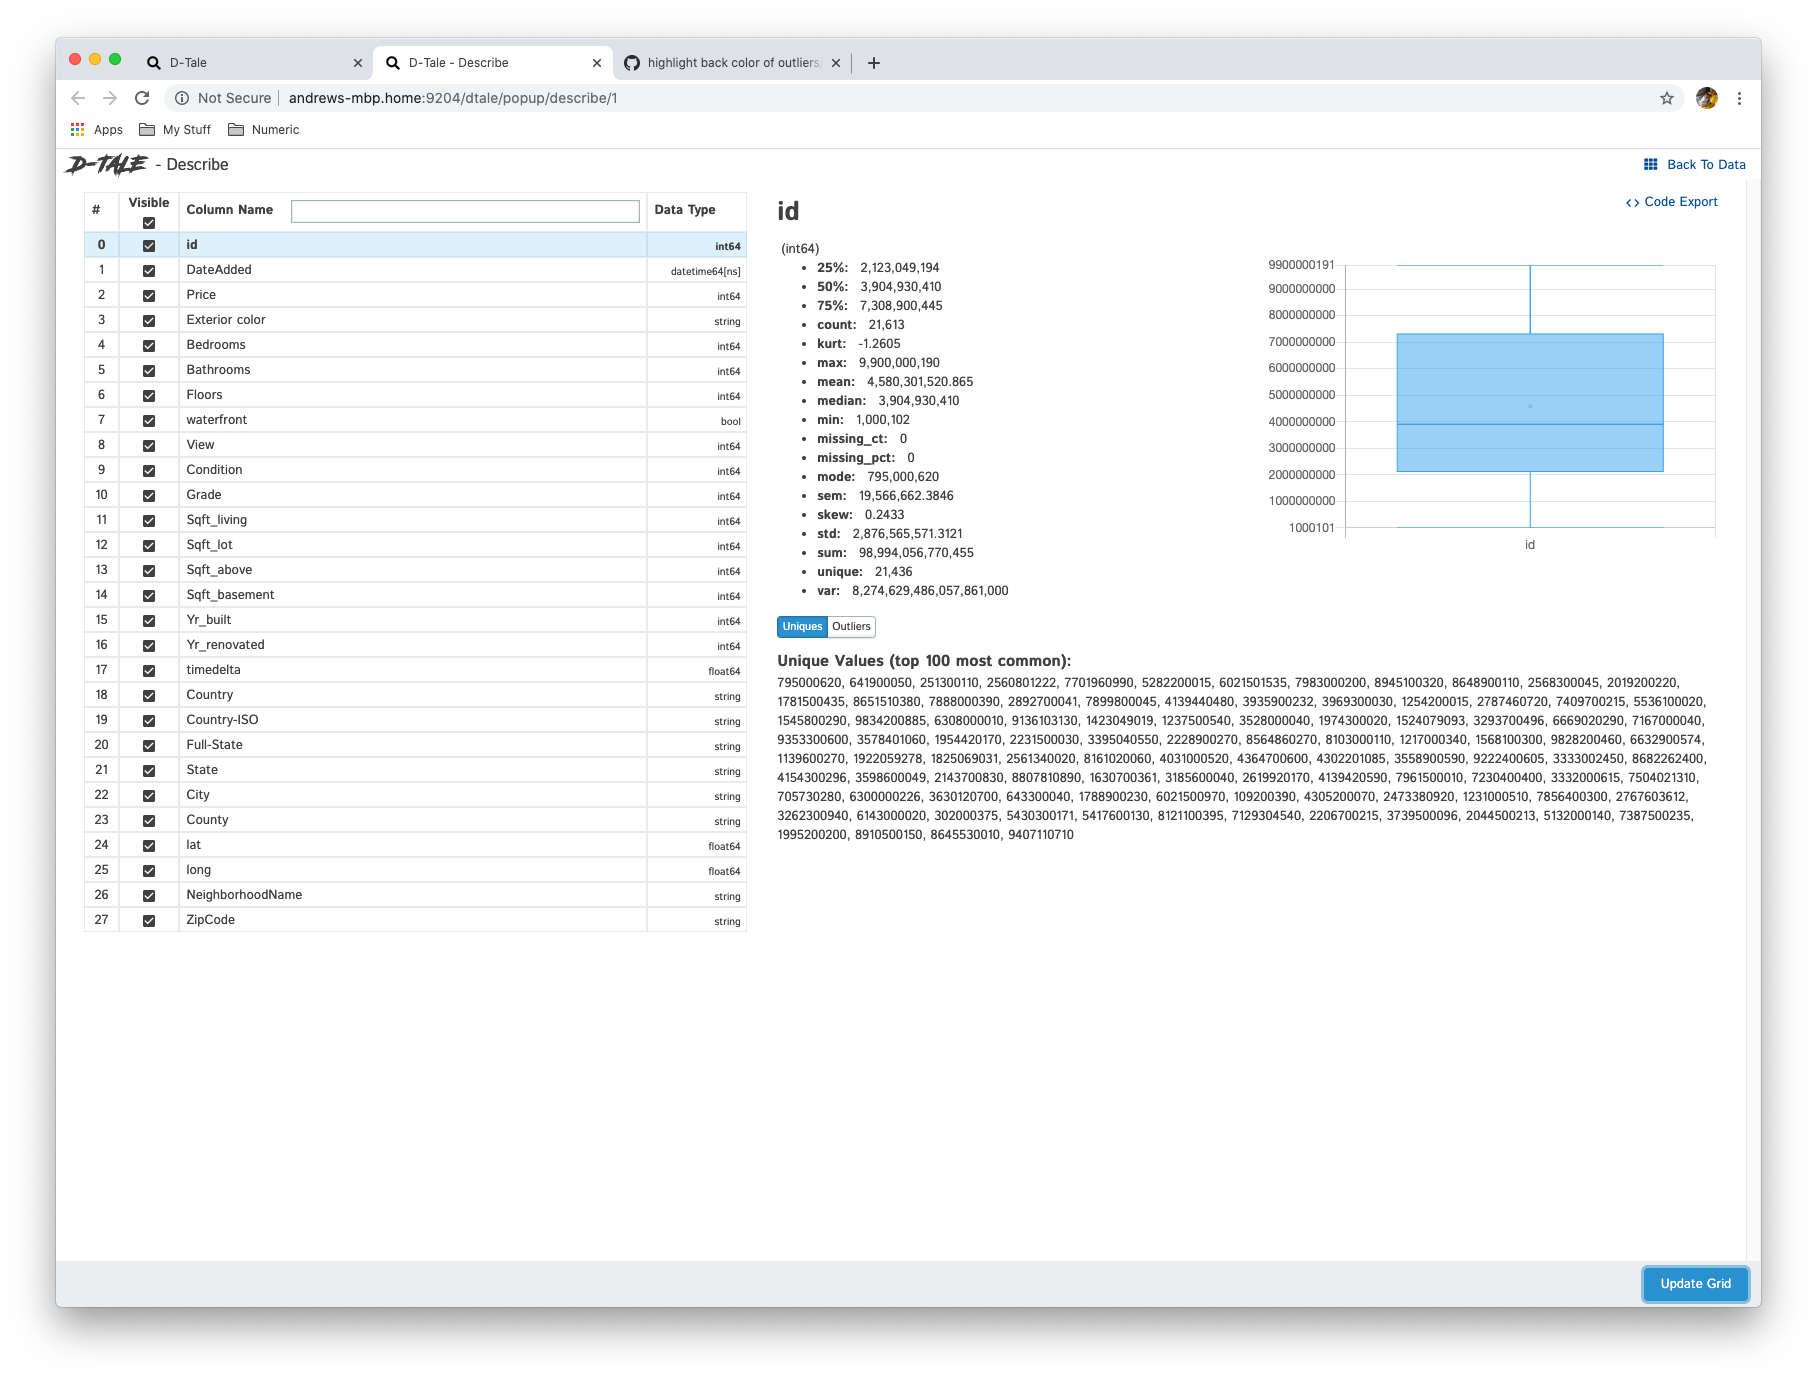
Describe
View all the columns & their data types as well as individual details of each column
| Data Type | Display | Notes |
|---|---|---|
| date | 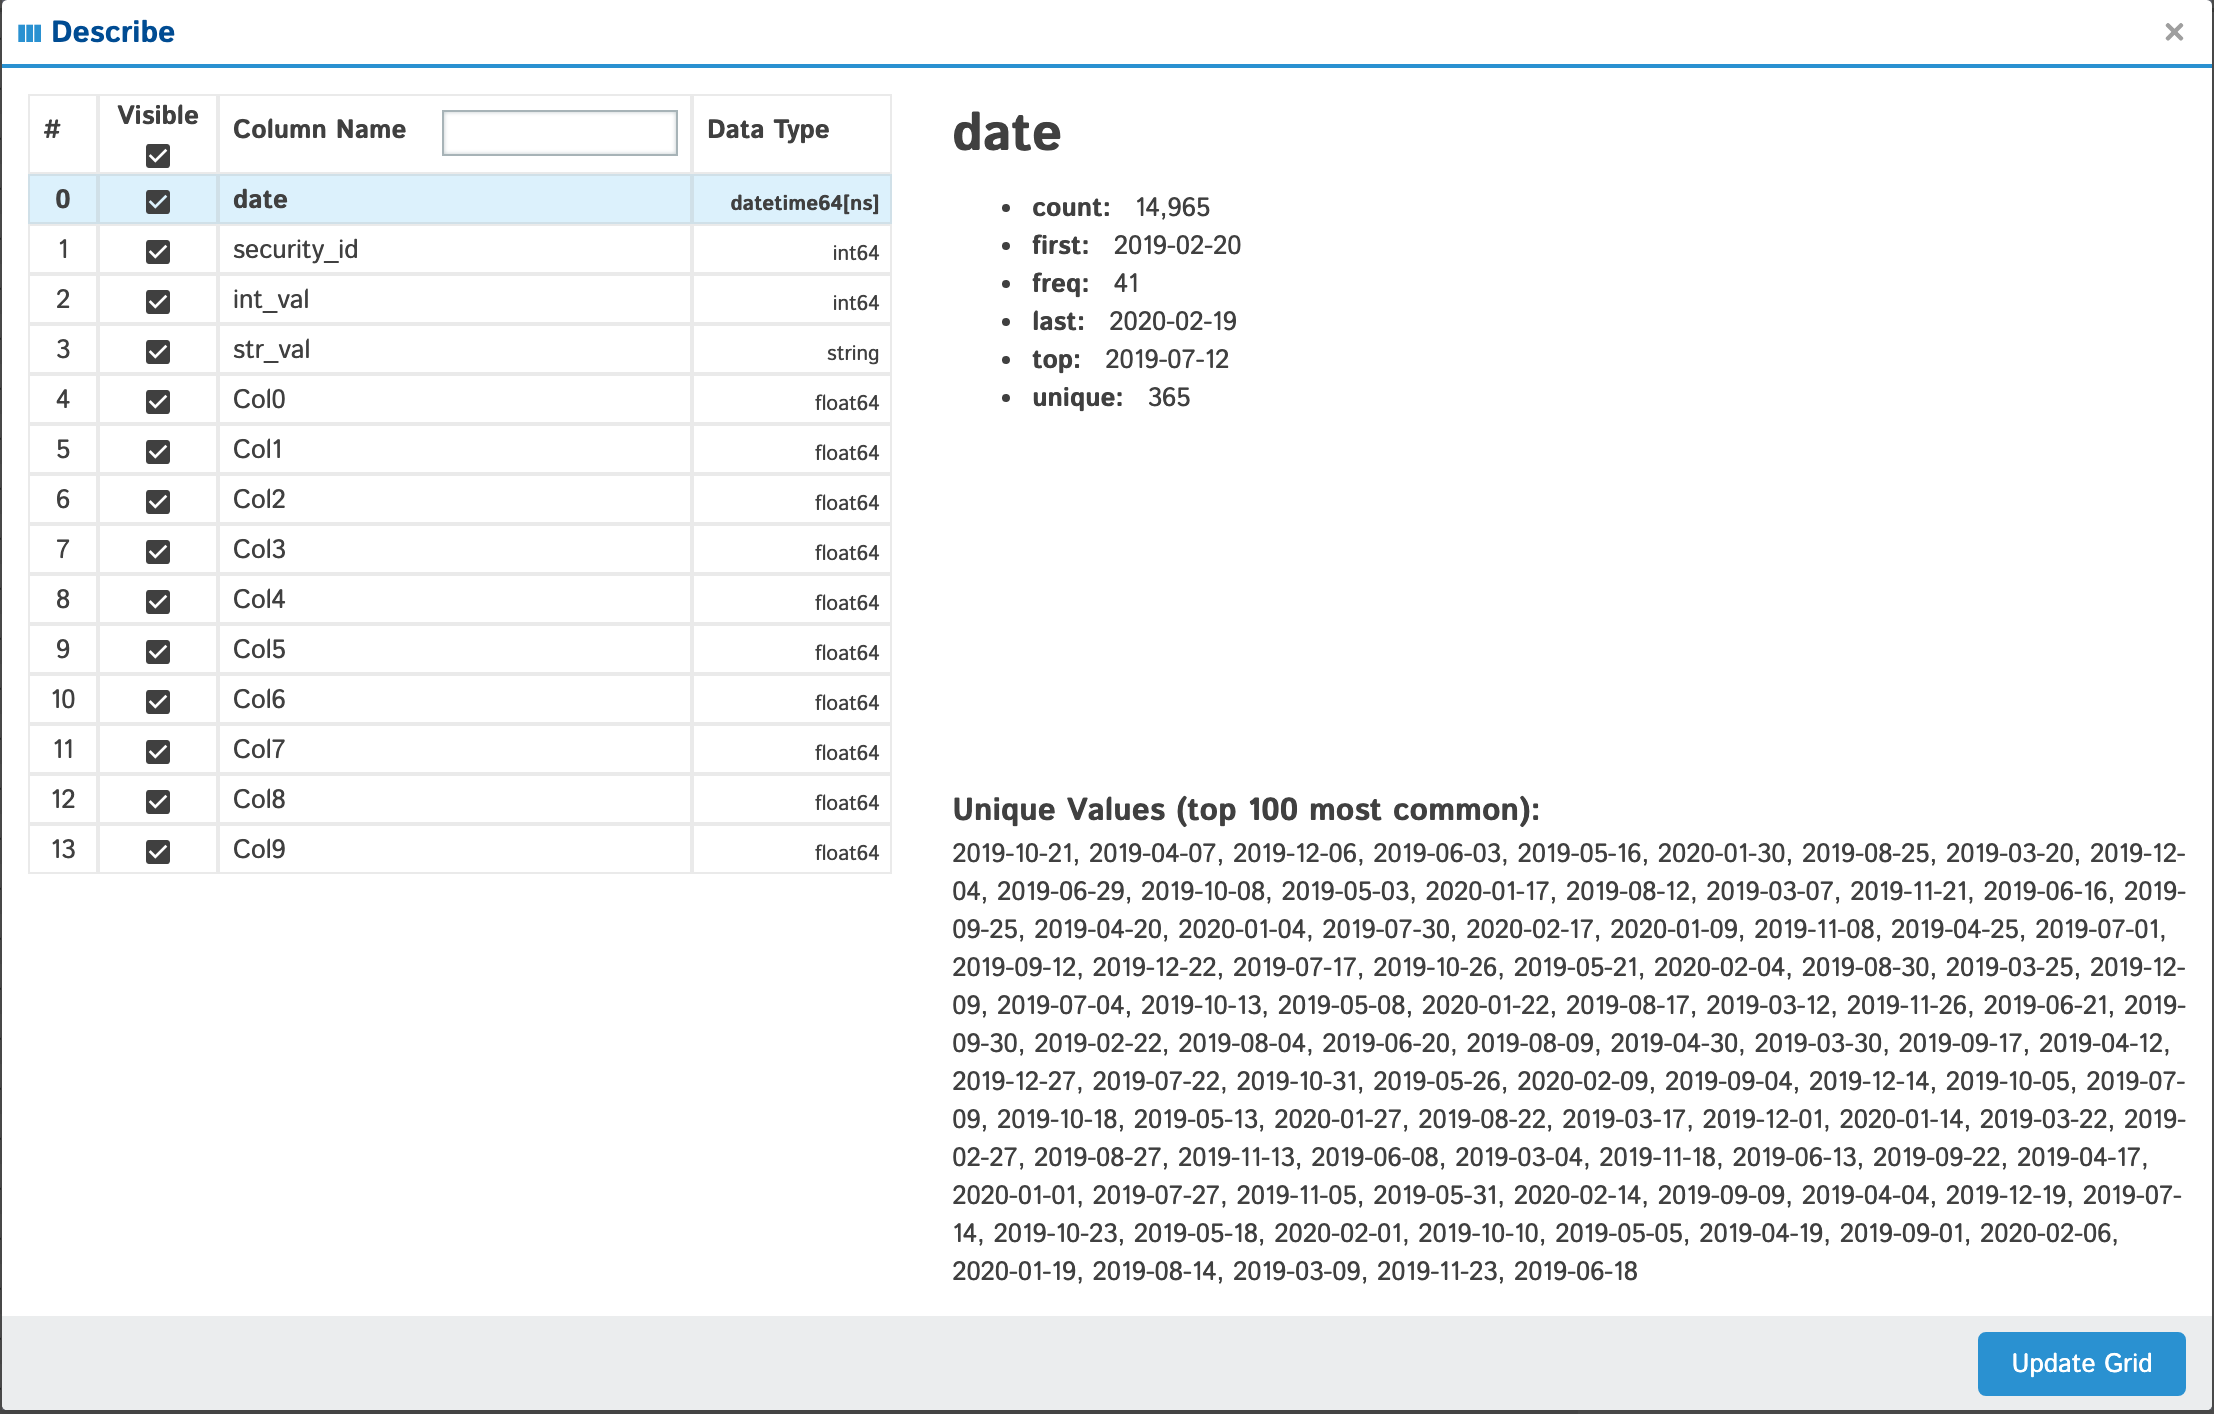 | |
| string |  | If you have less than or equal to 100 unique values they will be displayed at the bottom of your popup |
| int | 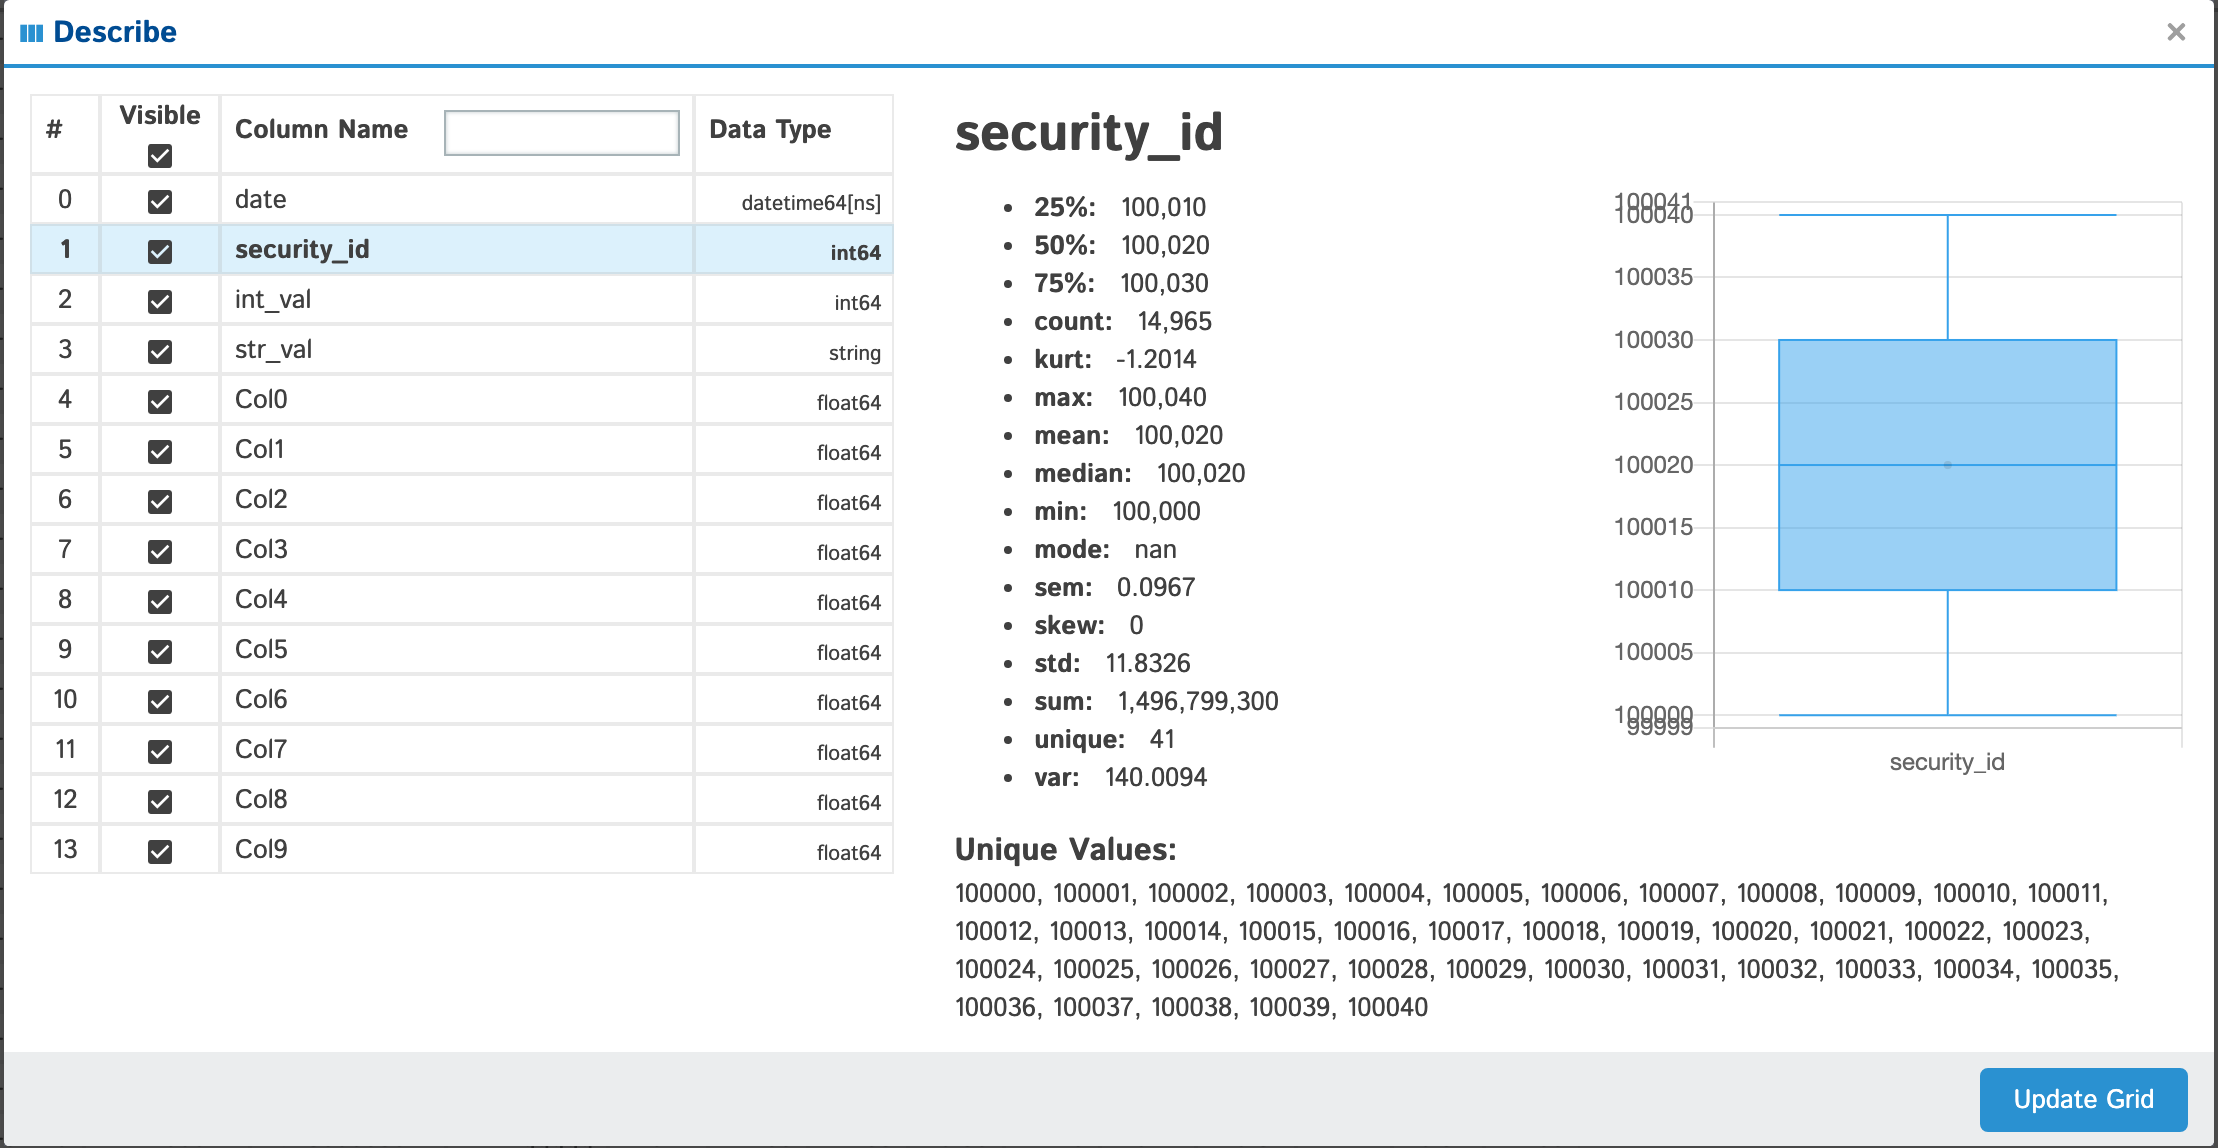 | Anything with standard numeric classifications (min, max, 25%, 50%, 75%) will have a nice boxplot with the mean (if it exists) displayed as an outlier if you look closely. |
| float | 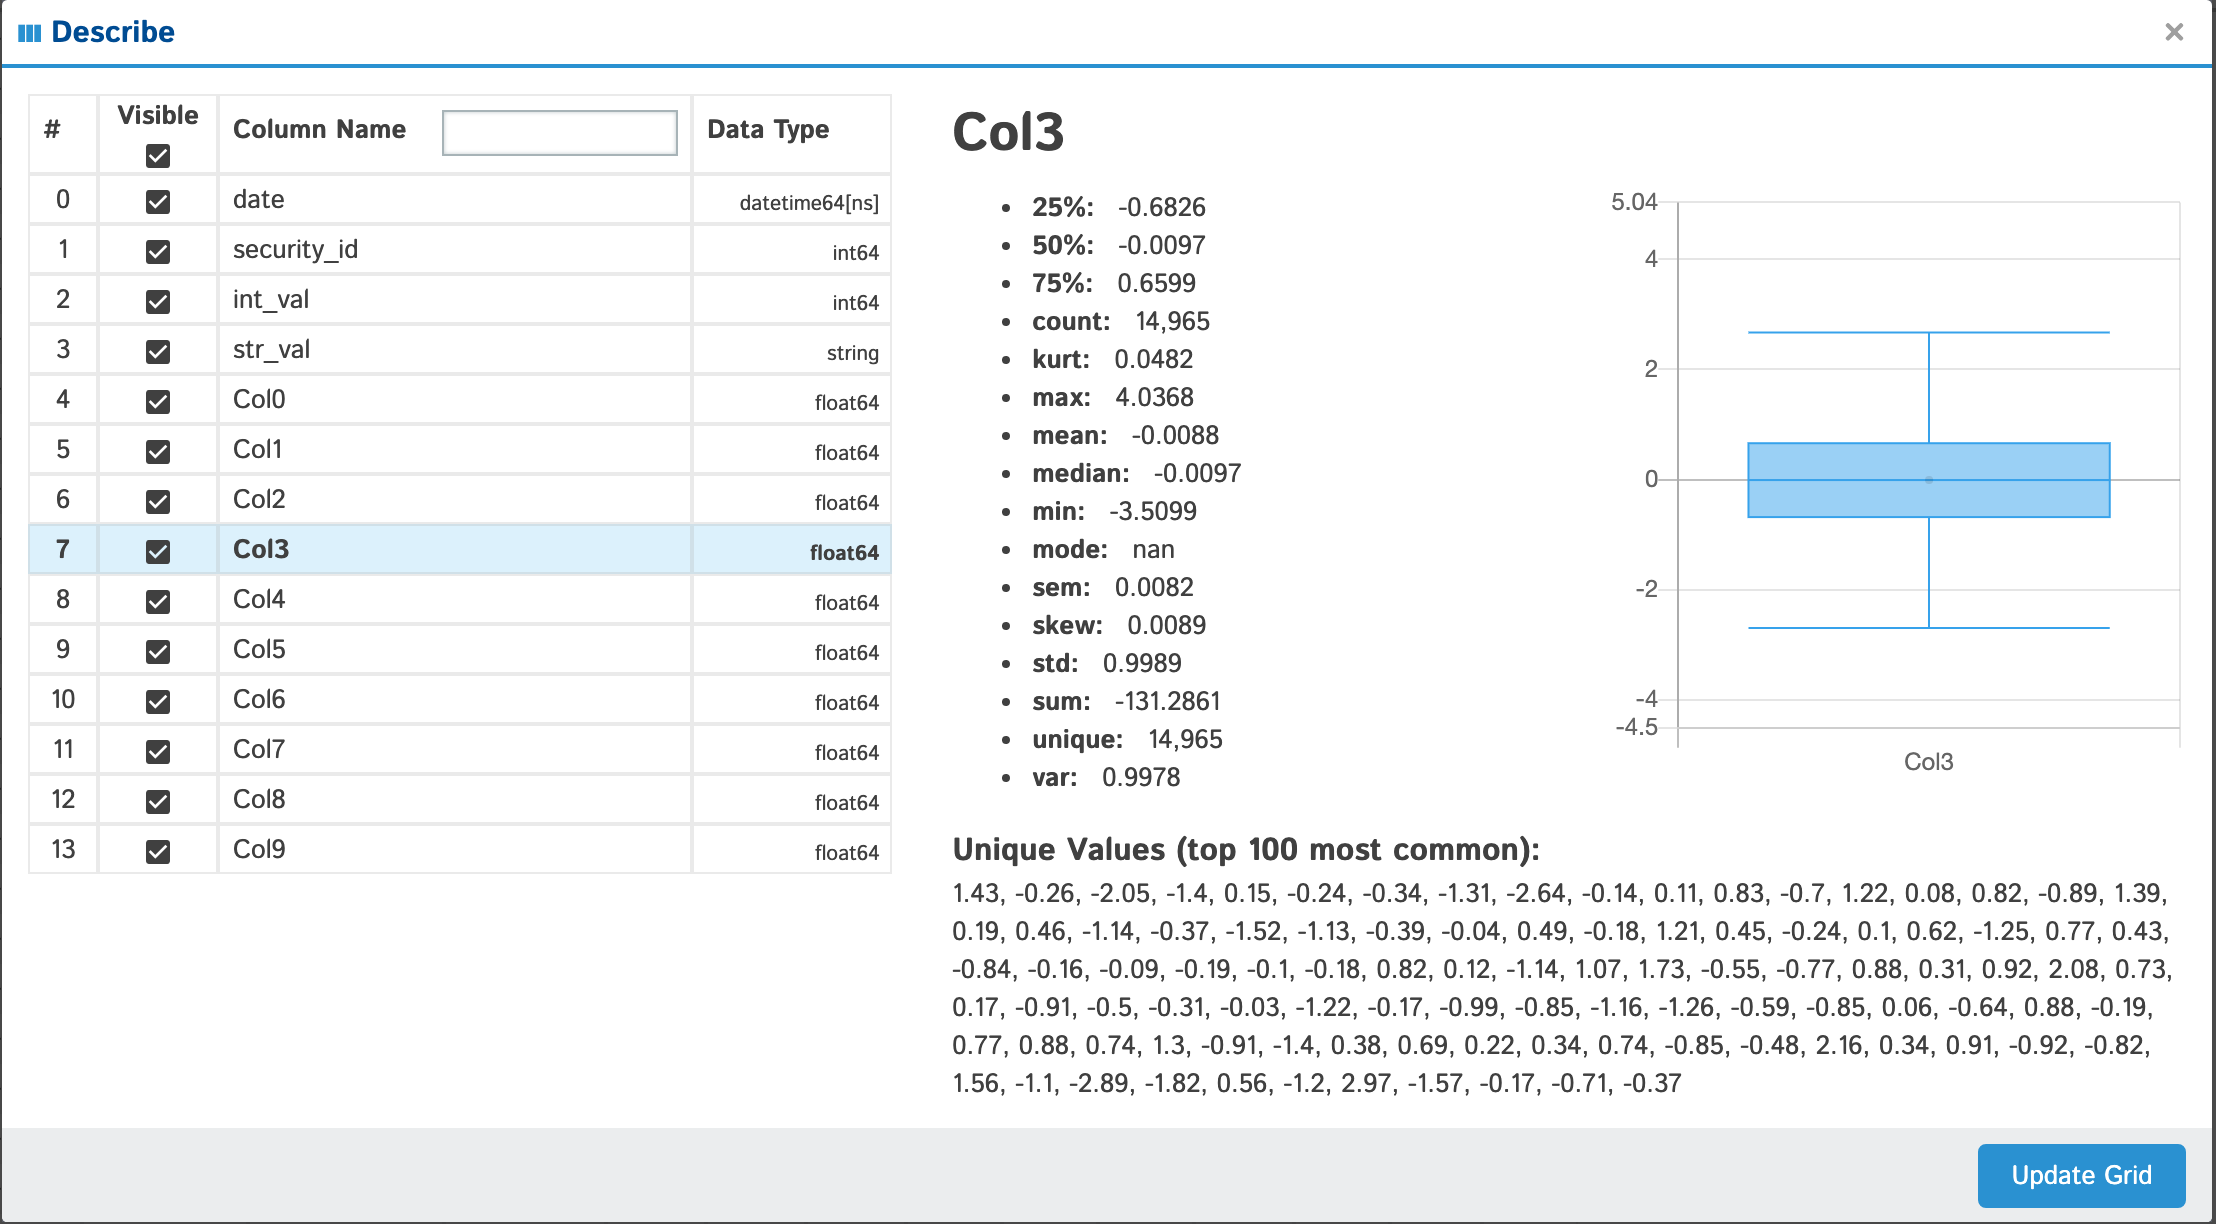 |
Outlier Detection
When viewing integer & float columns in the "Describe" popup you will see in the lower right-hand corner a toggle for Uniques & Outliers.
| Outliers | Filter |
|---|---|
 | 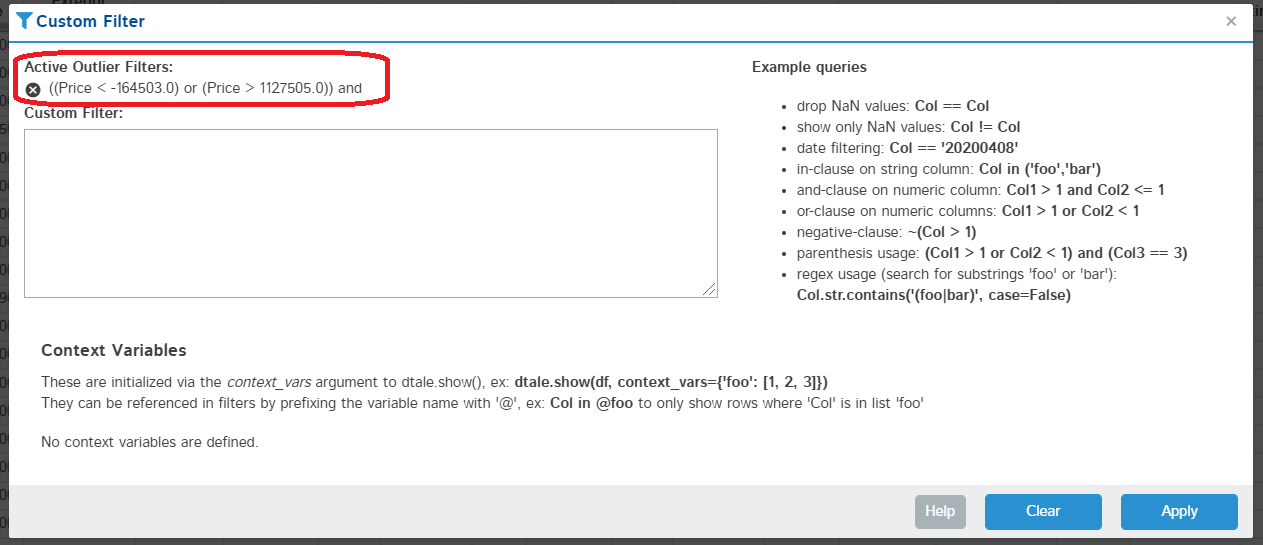 |
If you click the "Outliers" toggle this will load the top 100 outliers in your column based on the following code snippet:
s = df[column]
q1 = s.quantile(0.25)
q3 = s.quantile(0.75)
iqr = q3 - q1
iqr_lower = q1 - 1.5 * iqr
iqr_upper = q3 + 1.5 * iqr
outliers = s[(s < iqr_lower) | (s > iqr_upper)]
If you click on the "Apply outlier filter" link this will add an addtional "outlier" filter for this column which can be removed from the header or the custom filter shown in picture above to the right.
Custom Filter
Starting with version 3.7.0 this feature will be turned off by default. Custom filters are vulnerable to code injection attacks, please only use in trusted environments.
You can turn this feature on by doing one of the following:
- add
enable_custom_filters=Trueto yourdtale.showcall - add
enable_custom_filters = Trueto the [app] section of your dtale.ini config file (more info) - run this code before calling dtale.show:
import dtale.global_state as global_state
global_state.set_app_settings(dict(enable_custom_filters=True))
Apply a custom pandas query to your data (link to pandas documentation included in popup)
| Editing | Result |
|---|---|
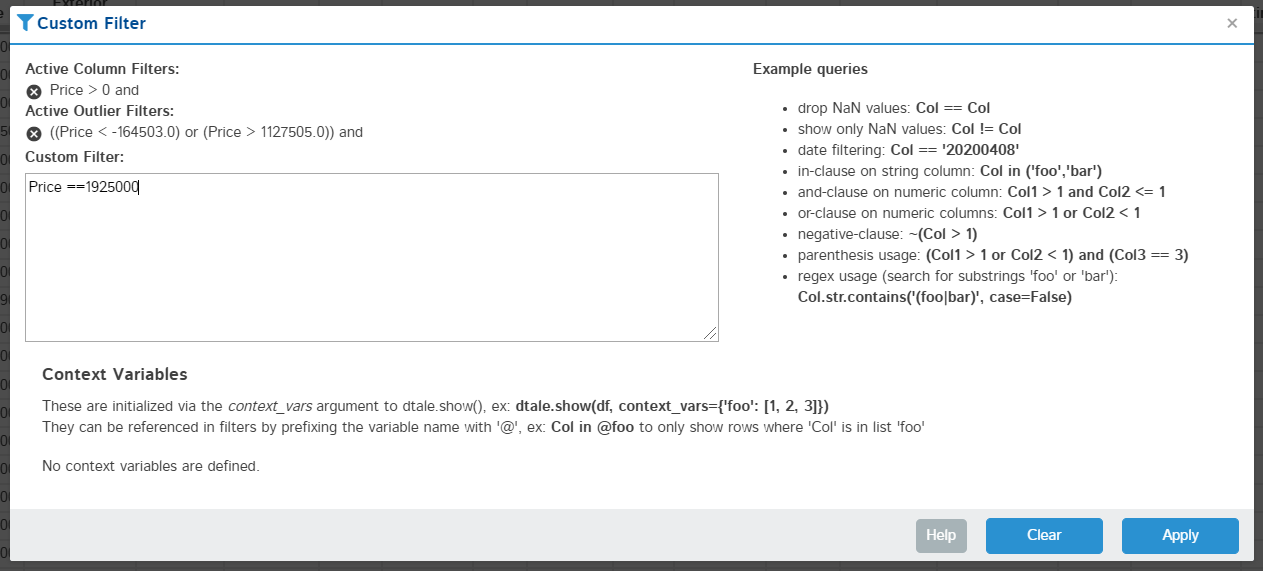 | 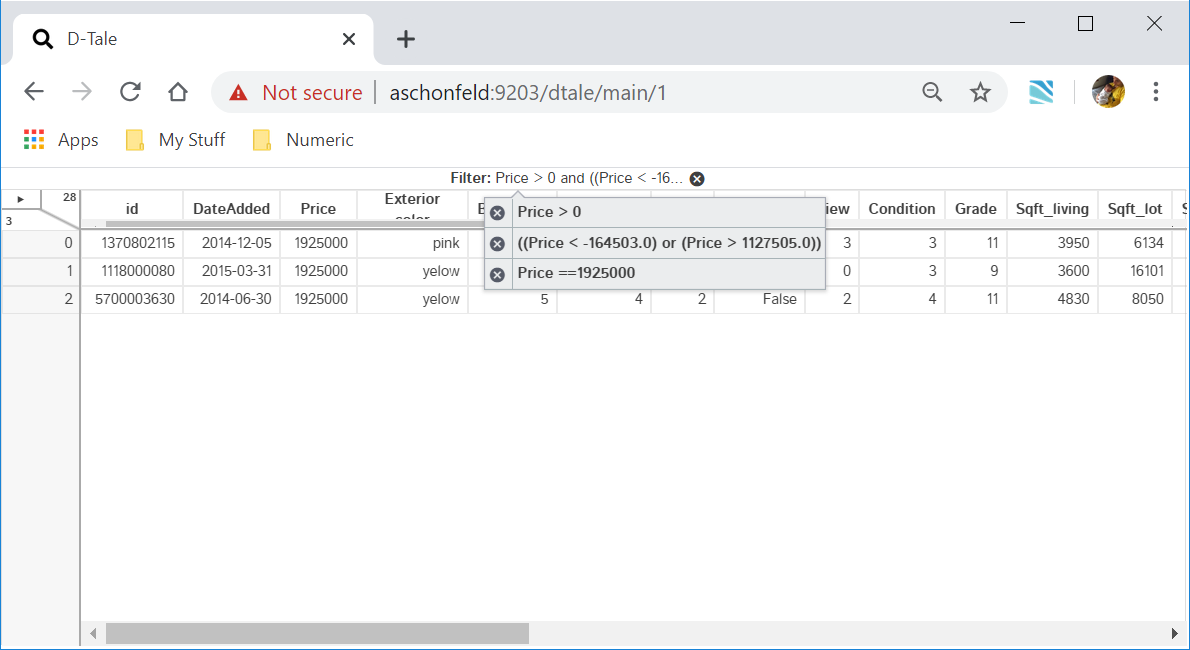 |
You can also see any outlier or column filters you've applied (which will be included in addition to your custom query) and remove them if you'd like.
Context Variables are user-defined values passed in via the context_variables argument to dtale.show(); they can be referenced in filters by prefixing the variable name with '@'.
For example, here is how you can use context variables in a pandas query:
import pandas as pd

df = pd.DataFrame([
  dict(name='Joe', age=7),
  dict(name='Bob', age=23),
  dict(name='Ann', age=45),
  dict(name='Cat', age=88),
])
two_oldest_ages = df['age'].nlargest(2)
df.query('age in @two_oldest_ages')
And here is how you would pass that context variable to D-Tale: dtale.show(df, context_variables=dict(two_oldest_ages=two_oldest_ages))
Here's some nice documentation on the performance of pandas queries
Dataframe Functions
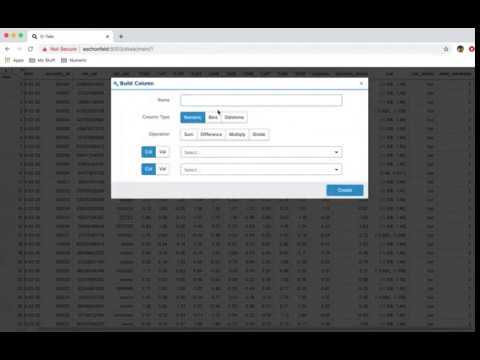
This video shows you how to build the following:
- Numeric: adding/subtracting two columns or columns with static values
- Bins: bucketing values using pandas cut & qcut as well as assigning custom labels
- Dates: retrieving date properties (hour, weekday, month...) as well as conversions (month end)
- Random: columns of data type (int, float, string & date) populated with random uniformly distributed values.
- Type Conversion: switch columns from one data type to another, fun. :smile:
Merge & Stack
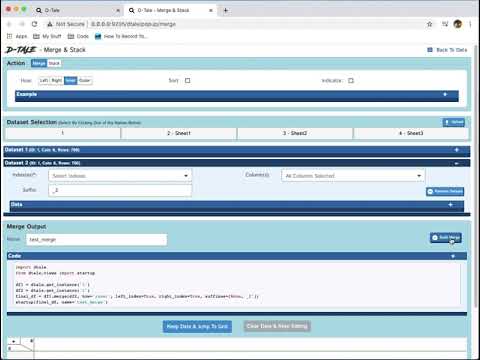
This feature allows users to merge or stack (vertically concatenate) dataframes they have loaded into D-Tale. They can also upload additional data to D-Tale while wihin this feature. The demo shown above goes over the following actions:
- Editing of parameters to either a pandas merge or stack (vertical concatenation) of dataframes
- Viewing direct examples of each from the pandas documentation
- Selection of dataframes
- Uploading of additional dataframes from an excel file
- Viewing code & resulting data from a merge or stack
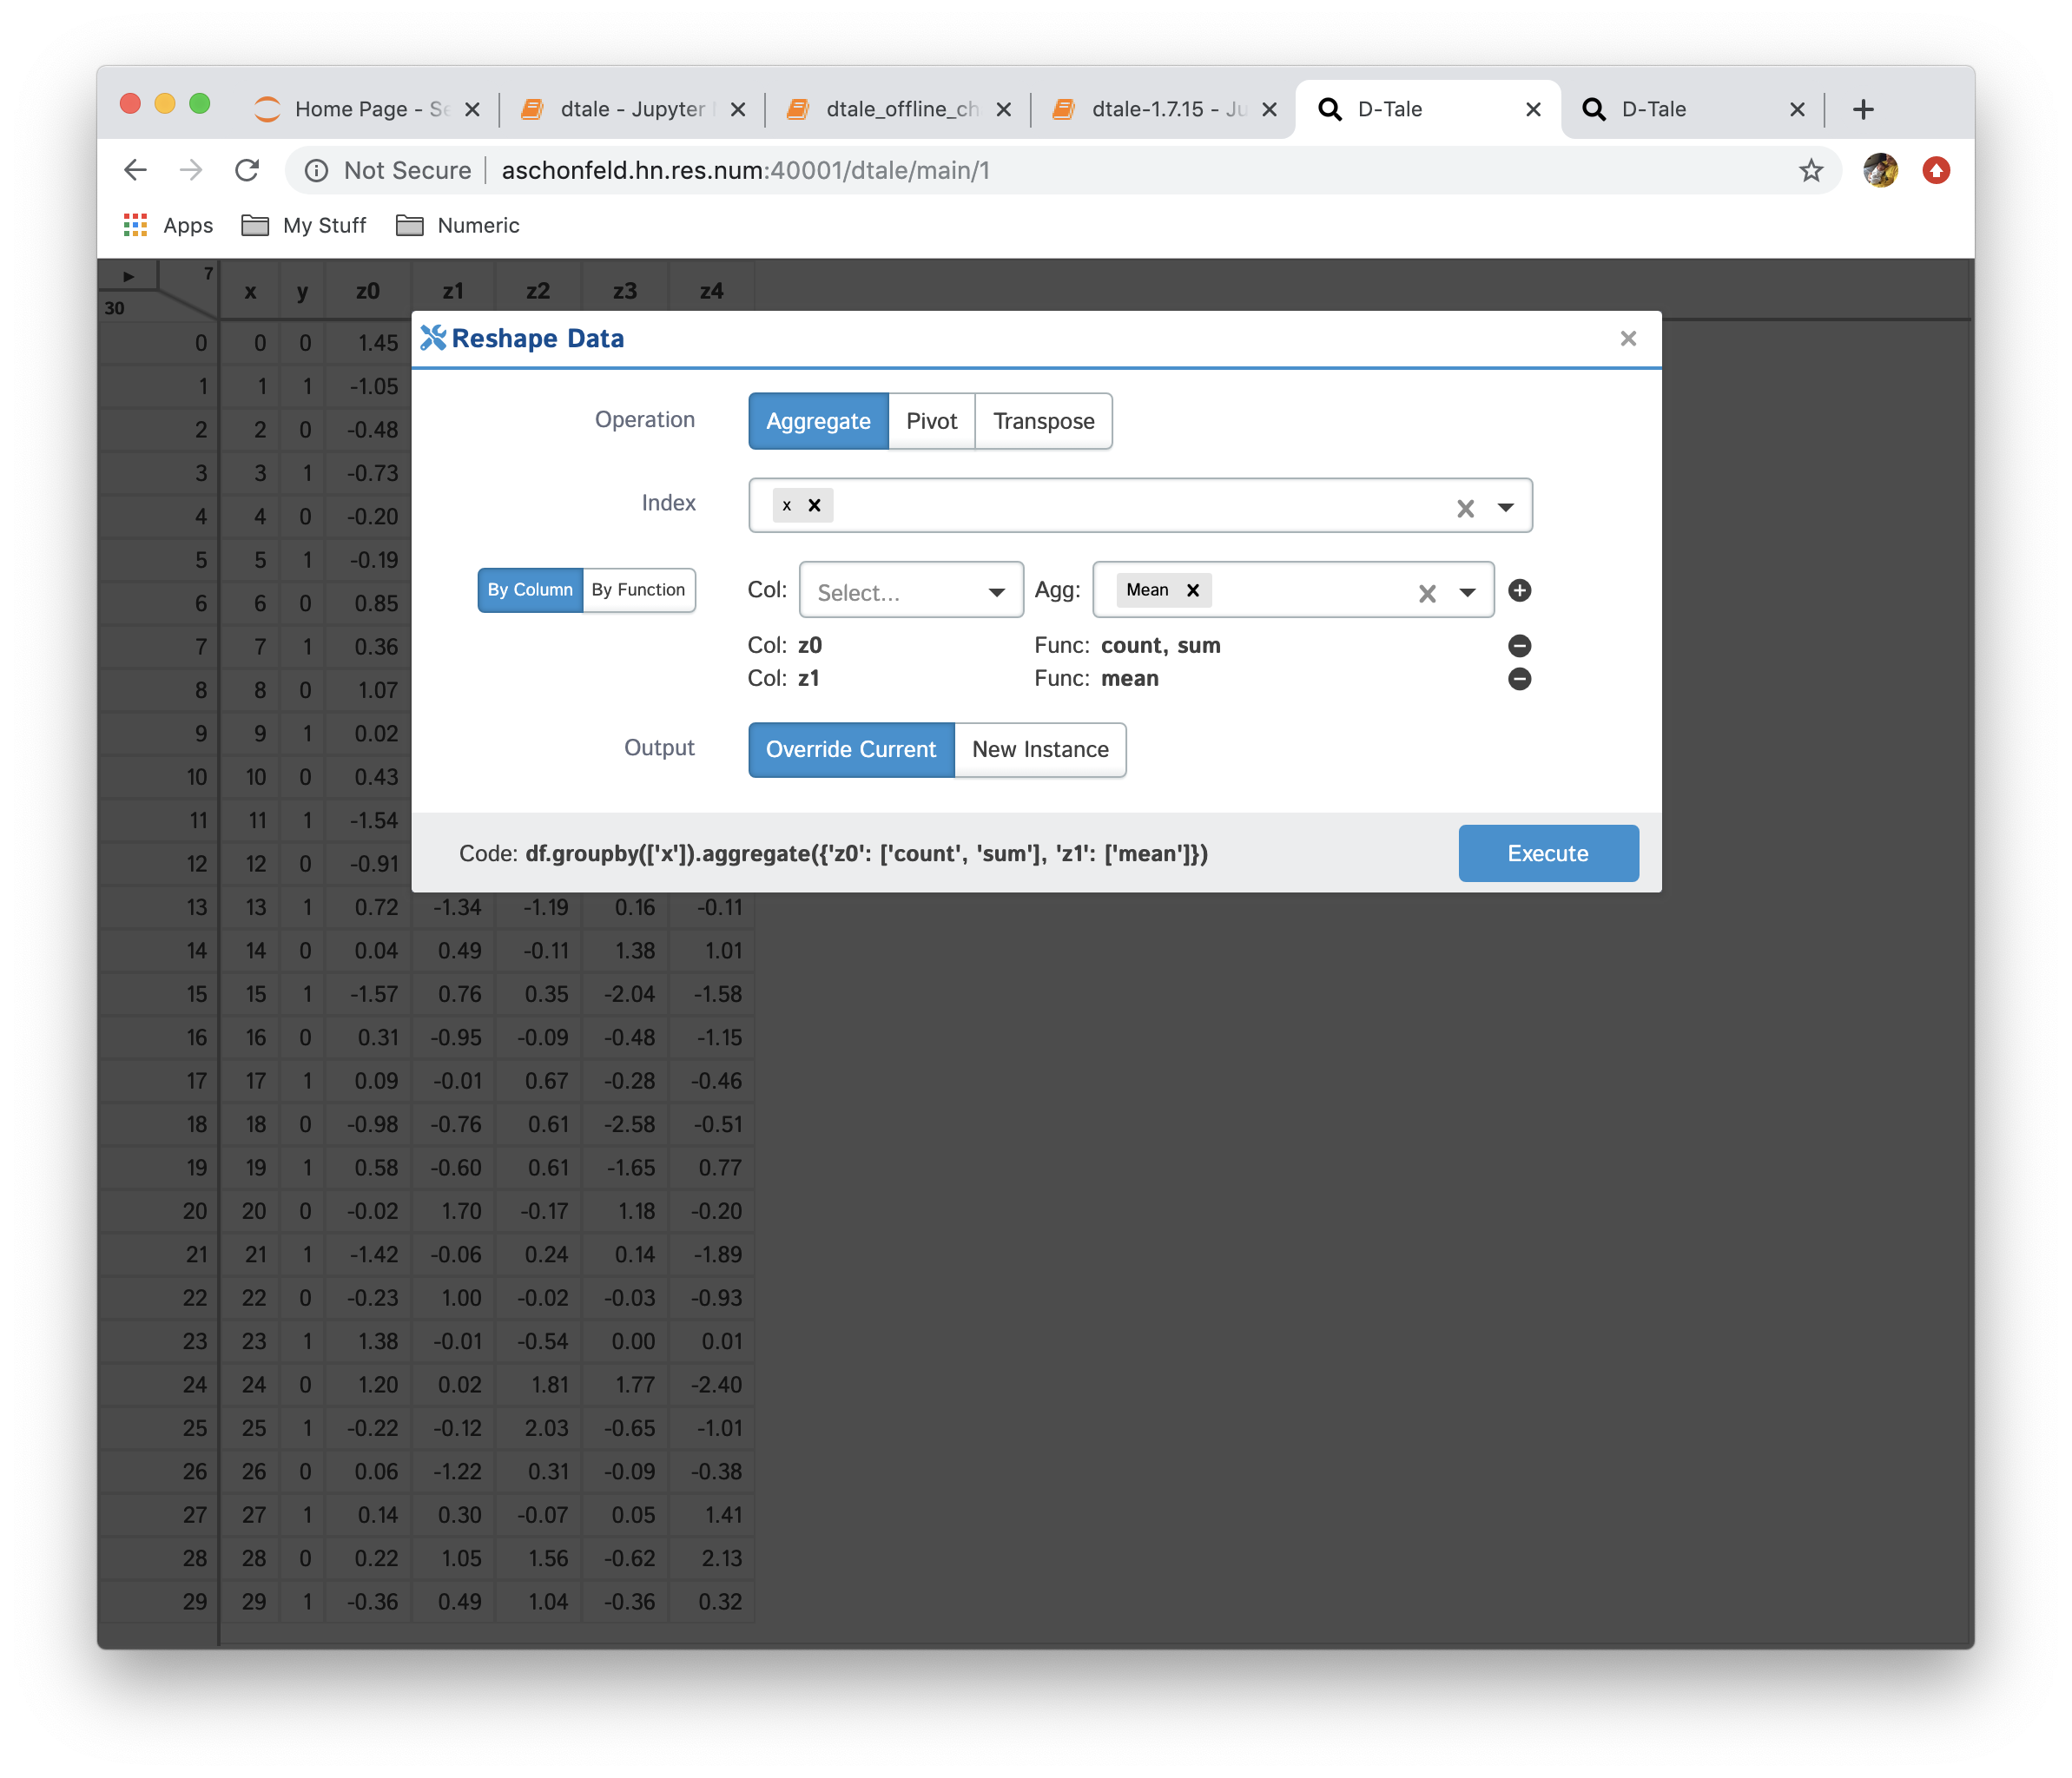
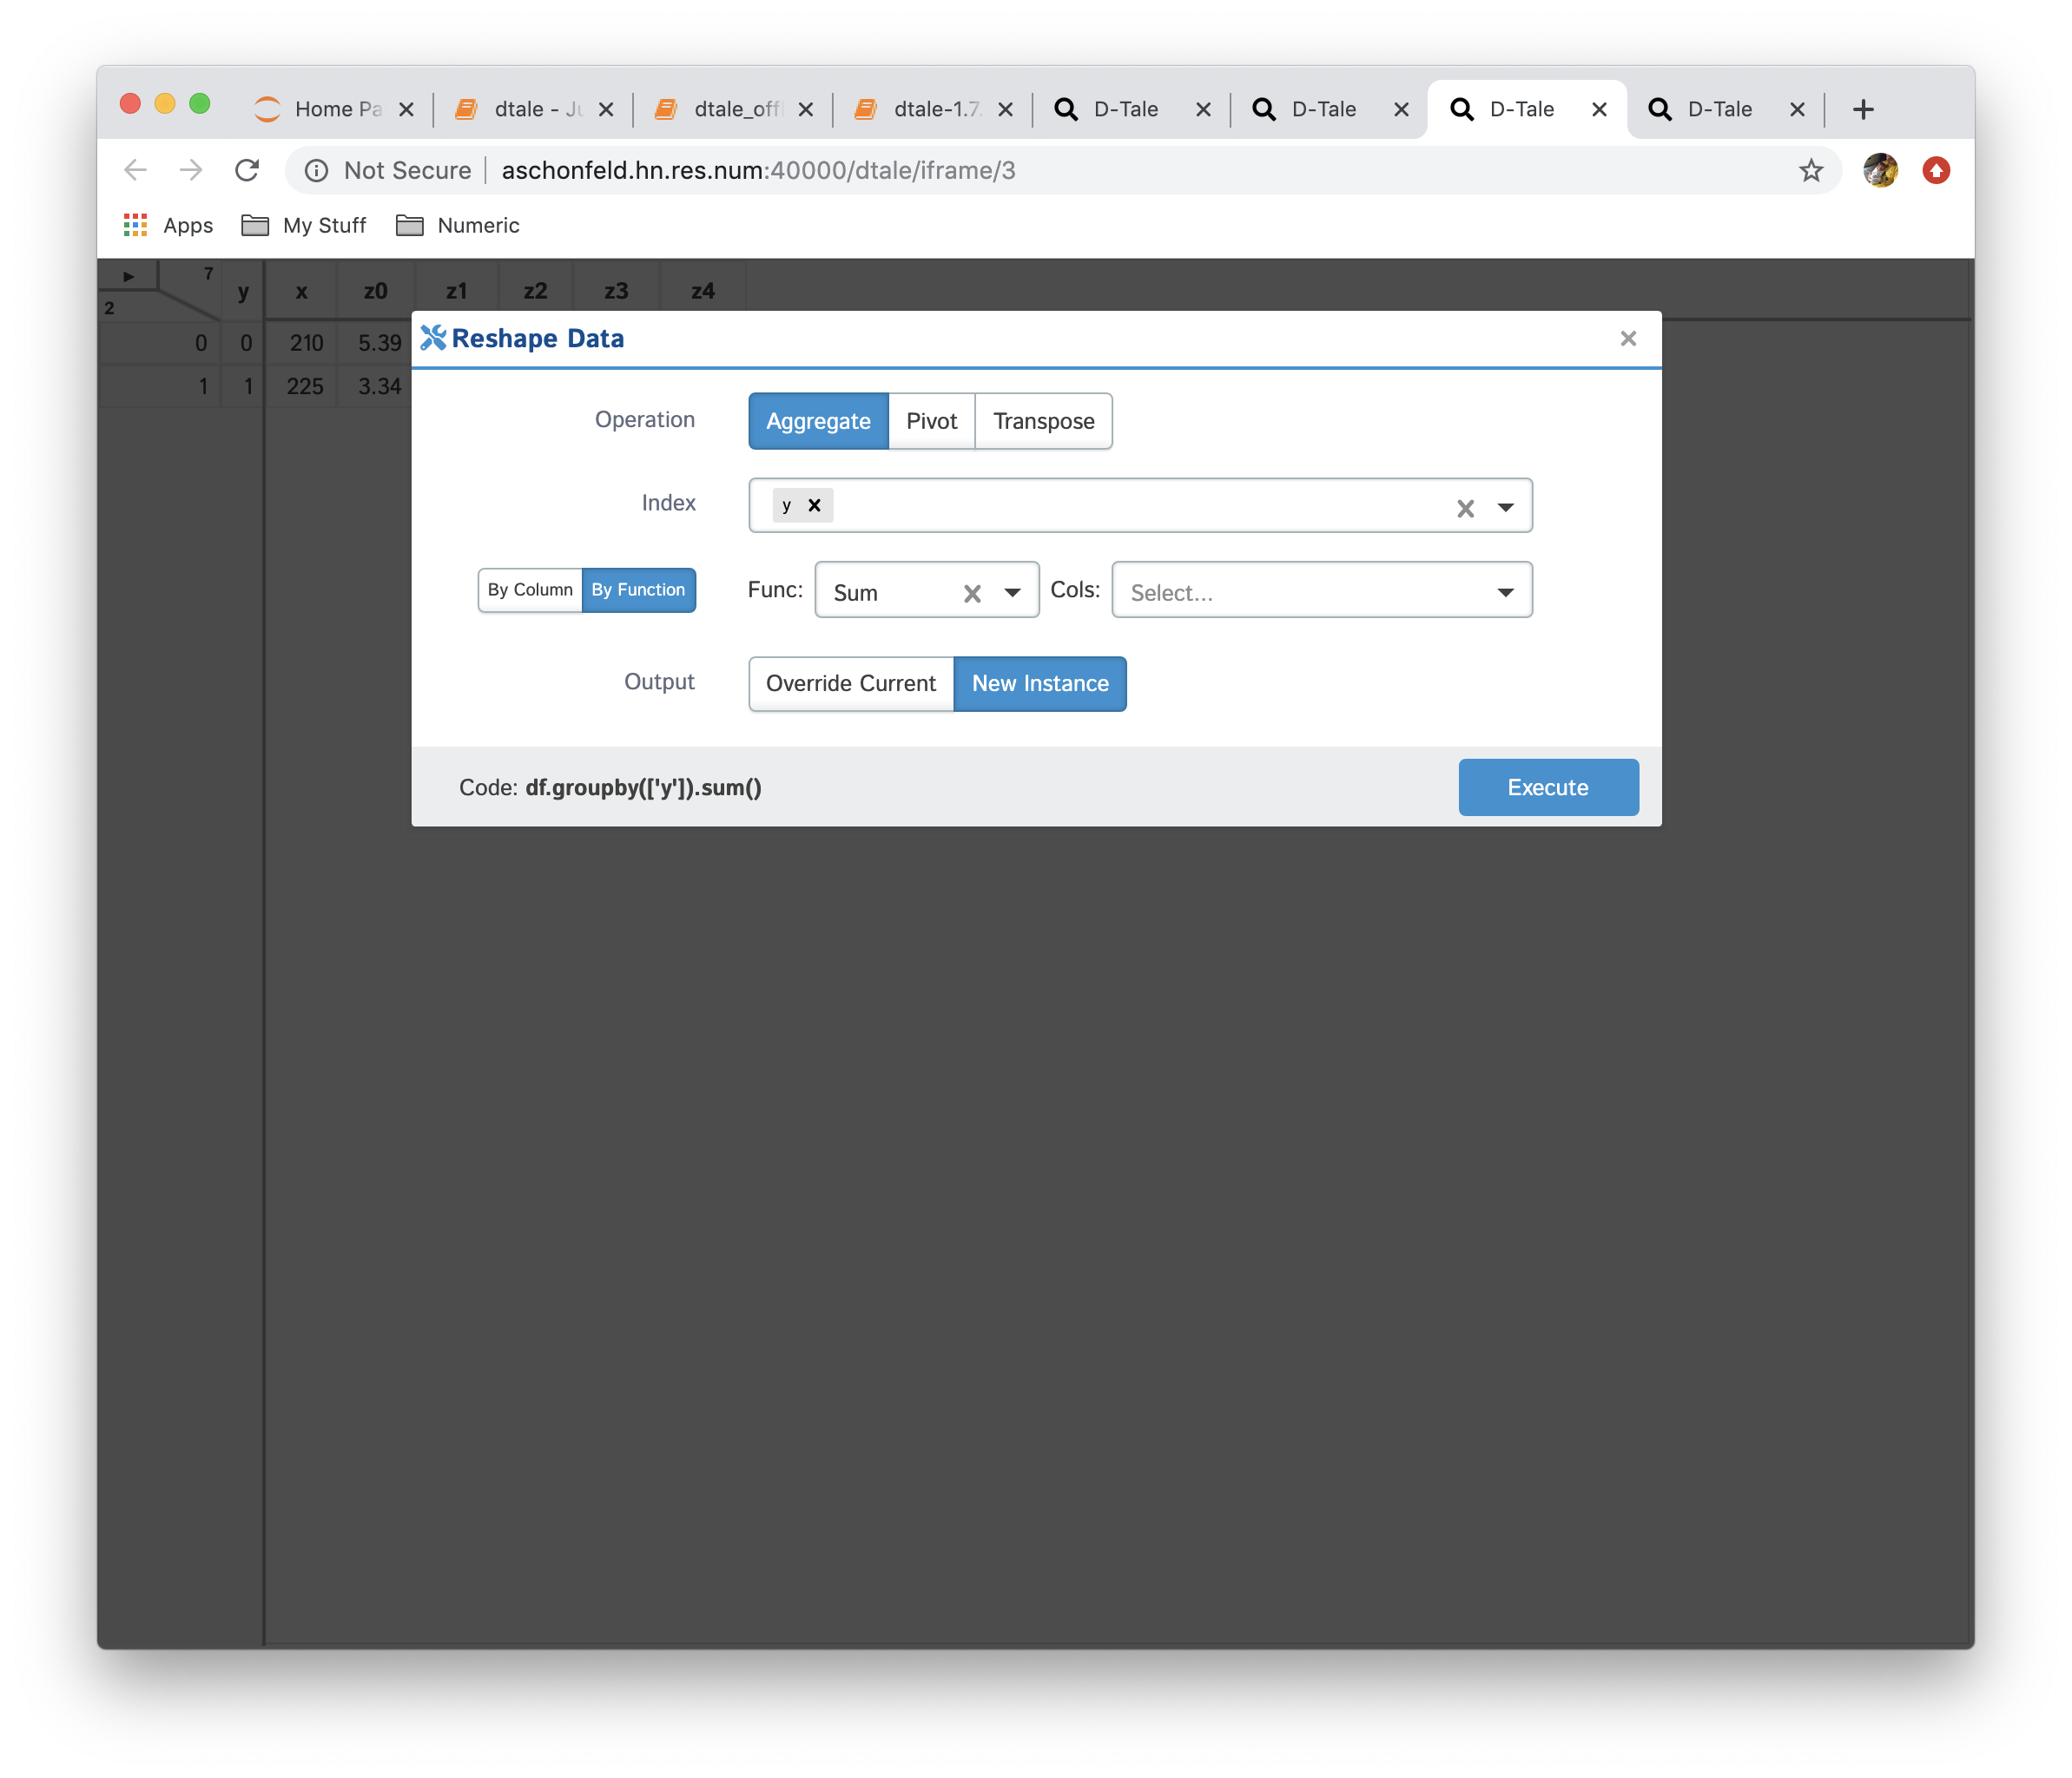
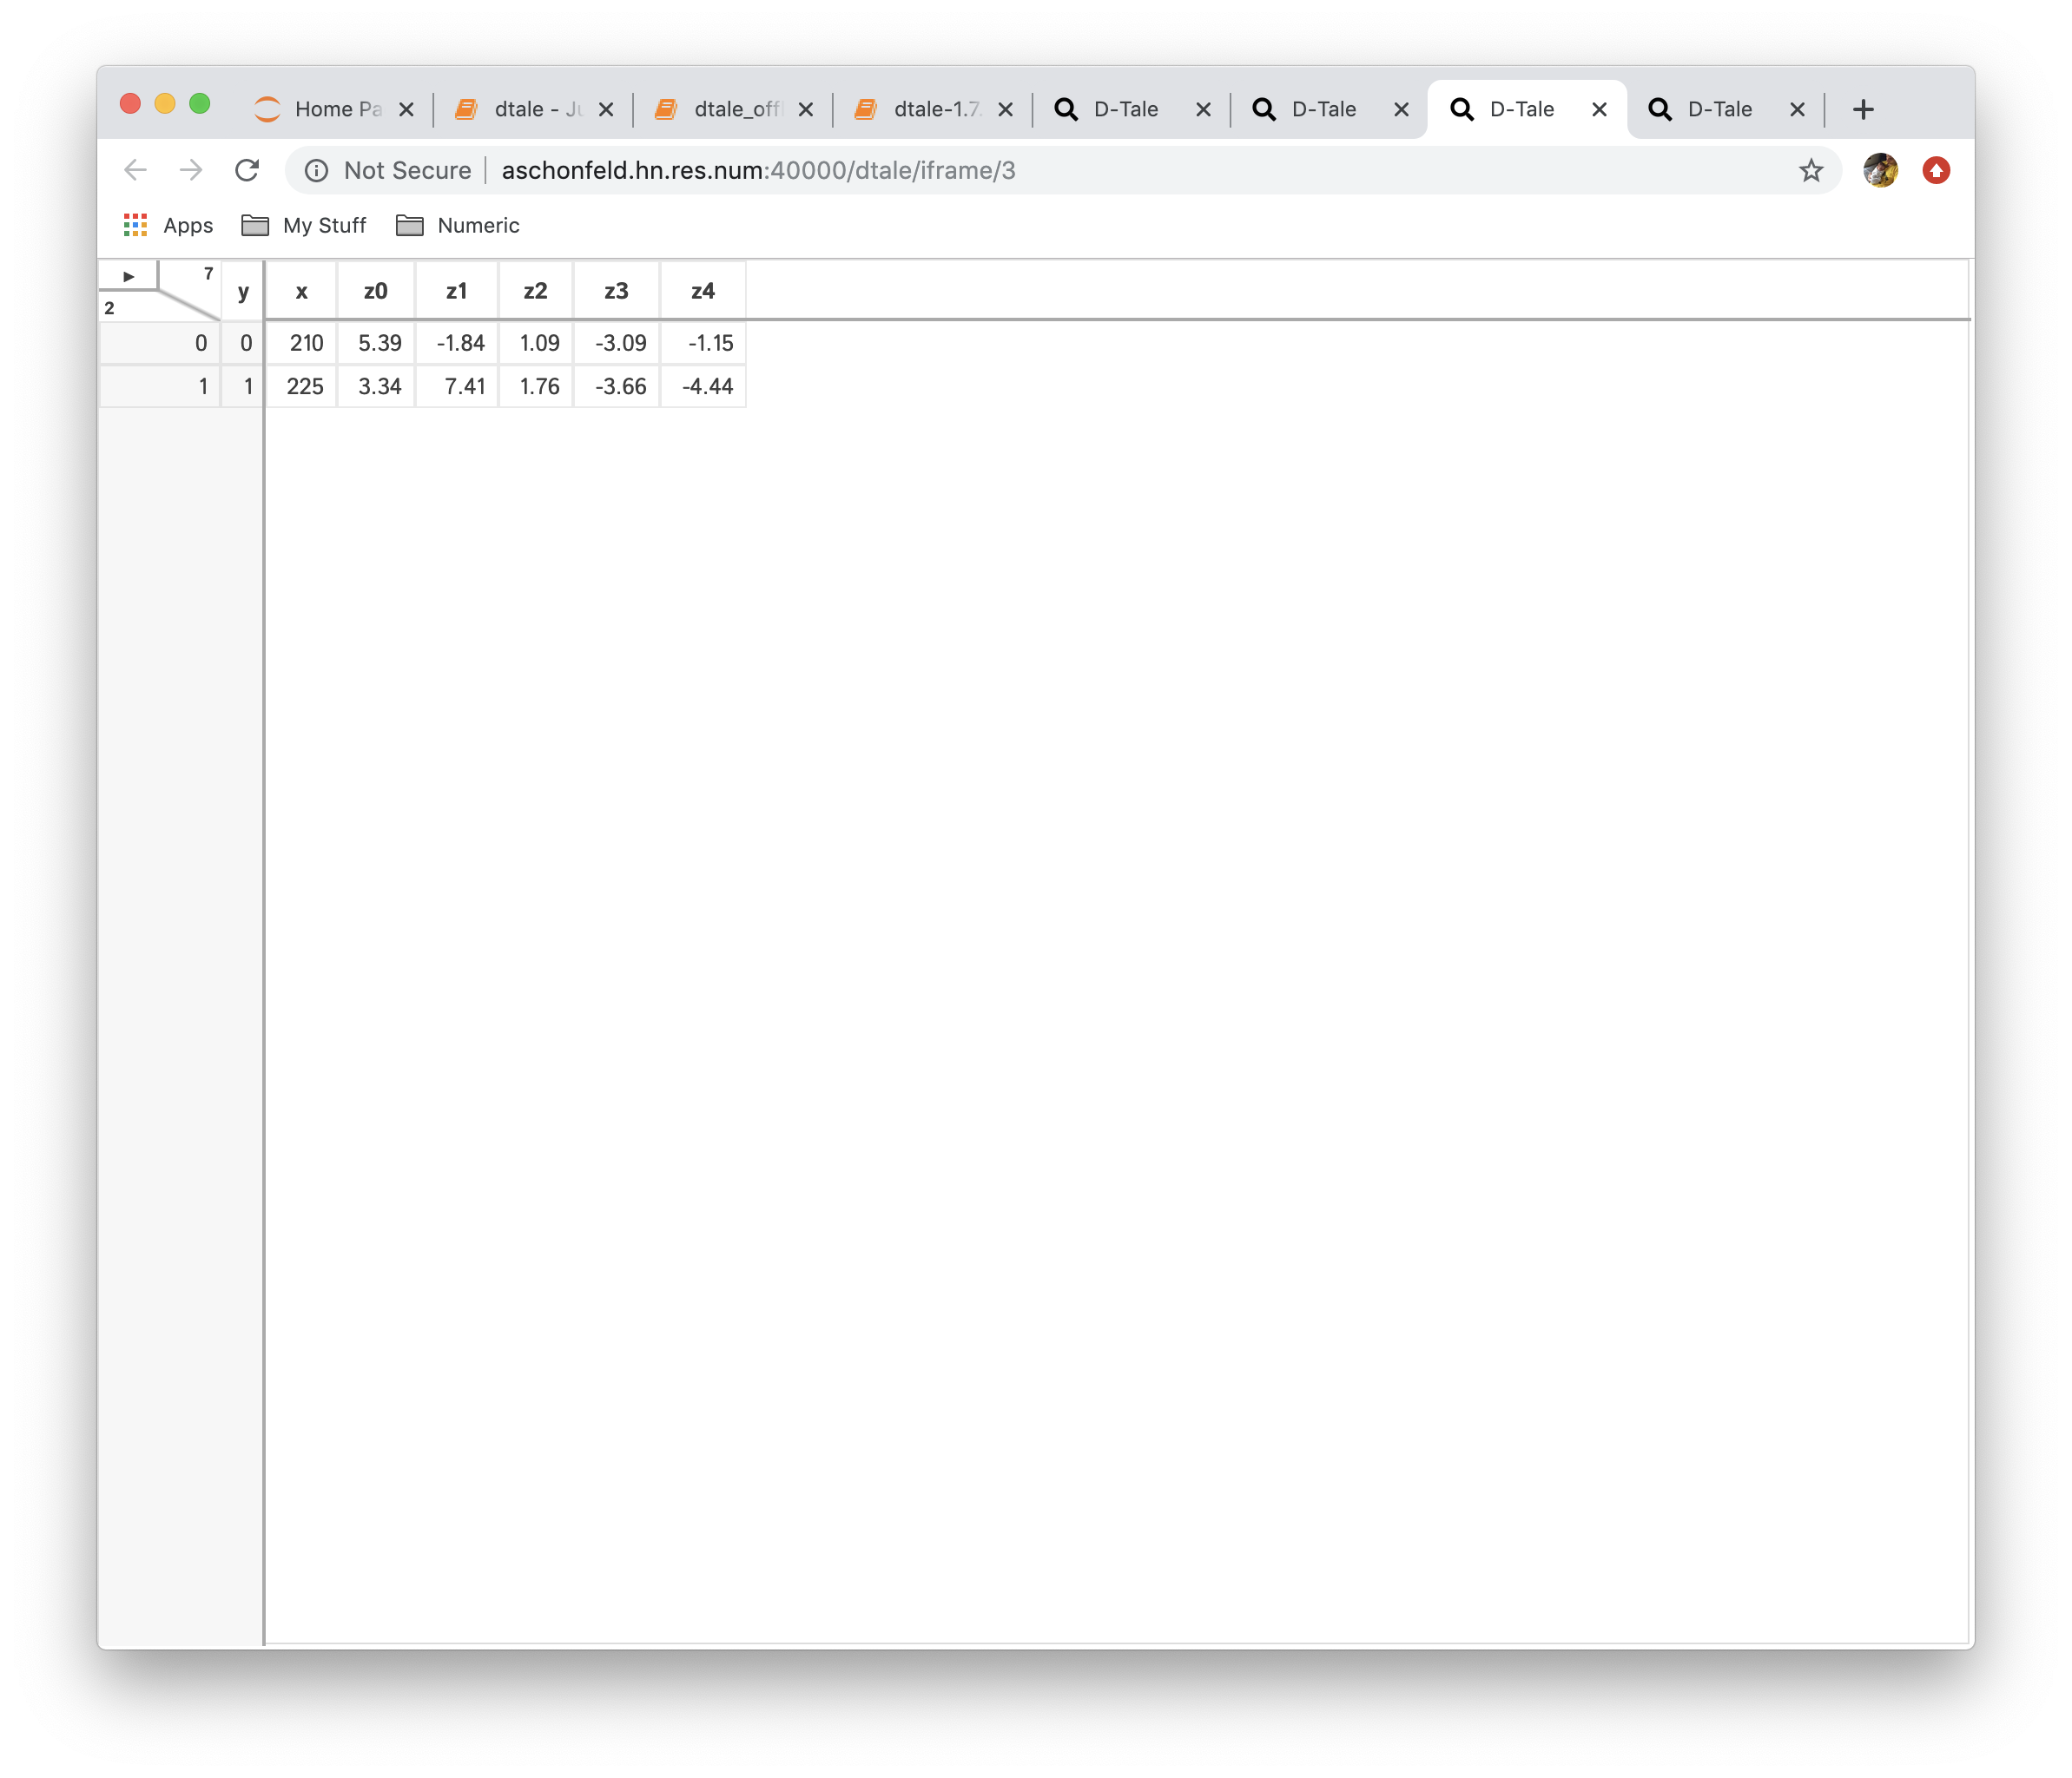
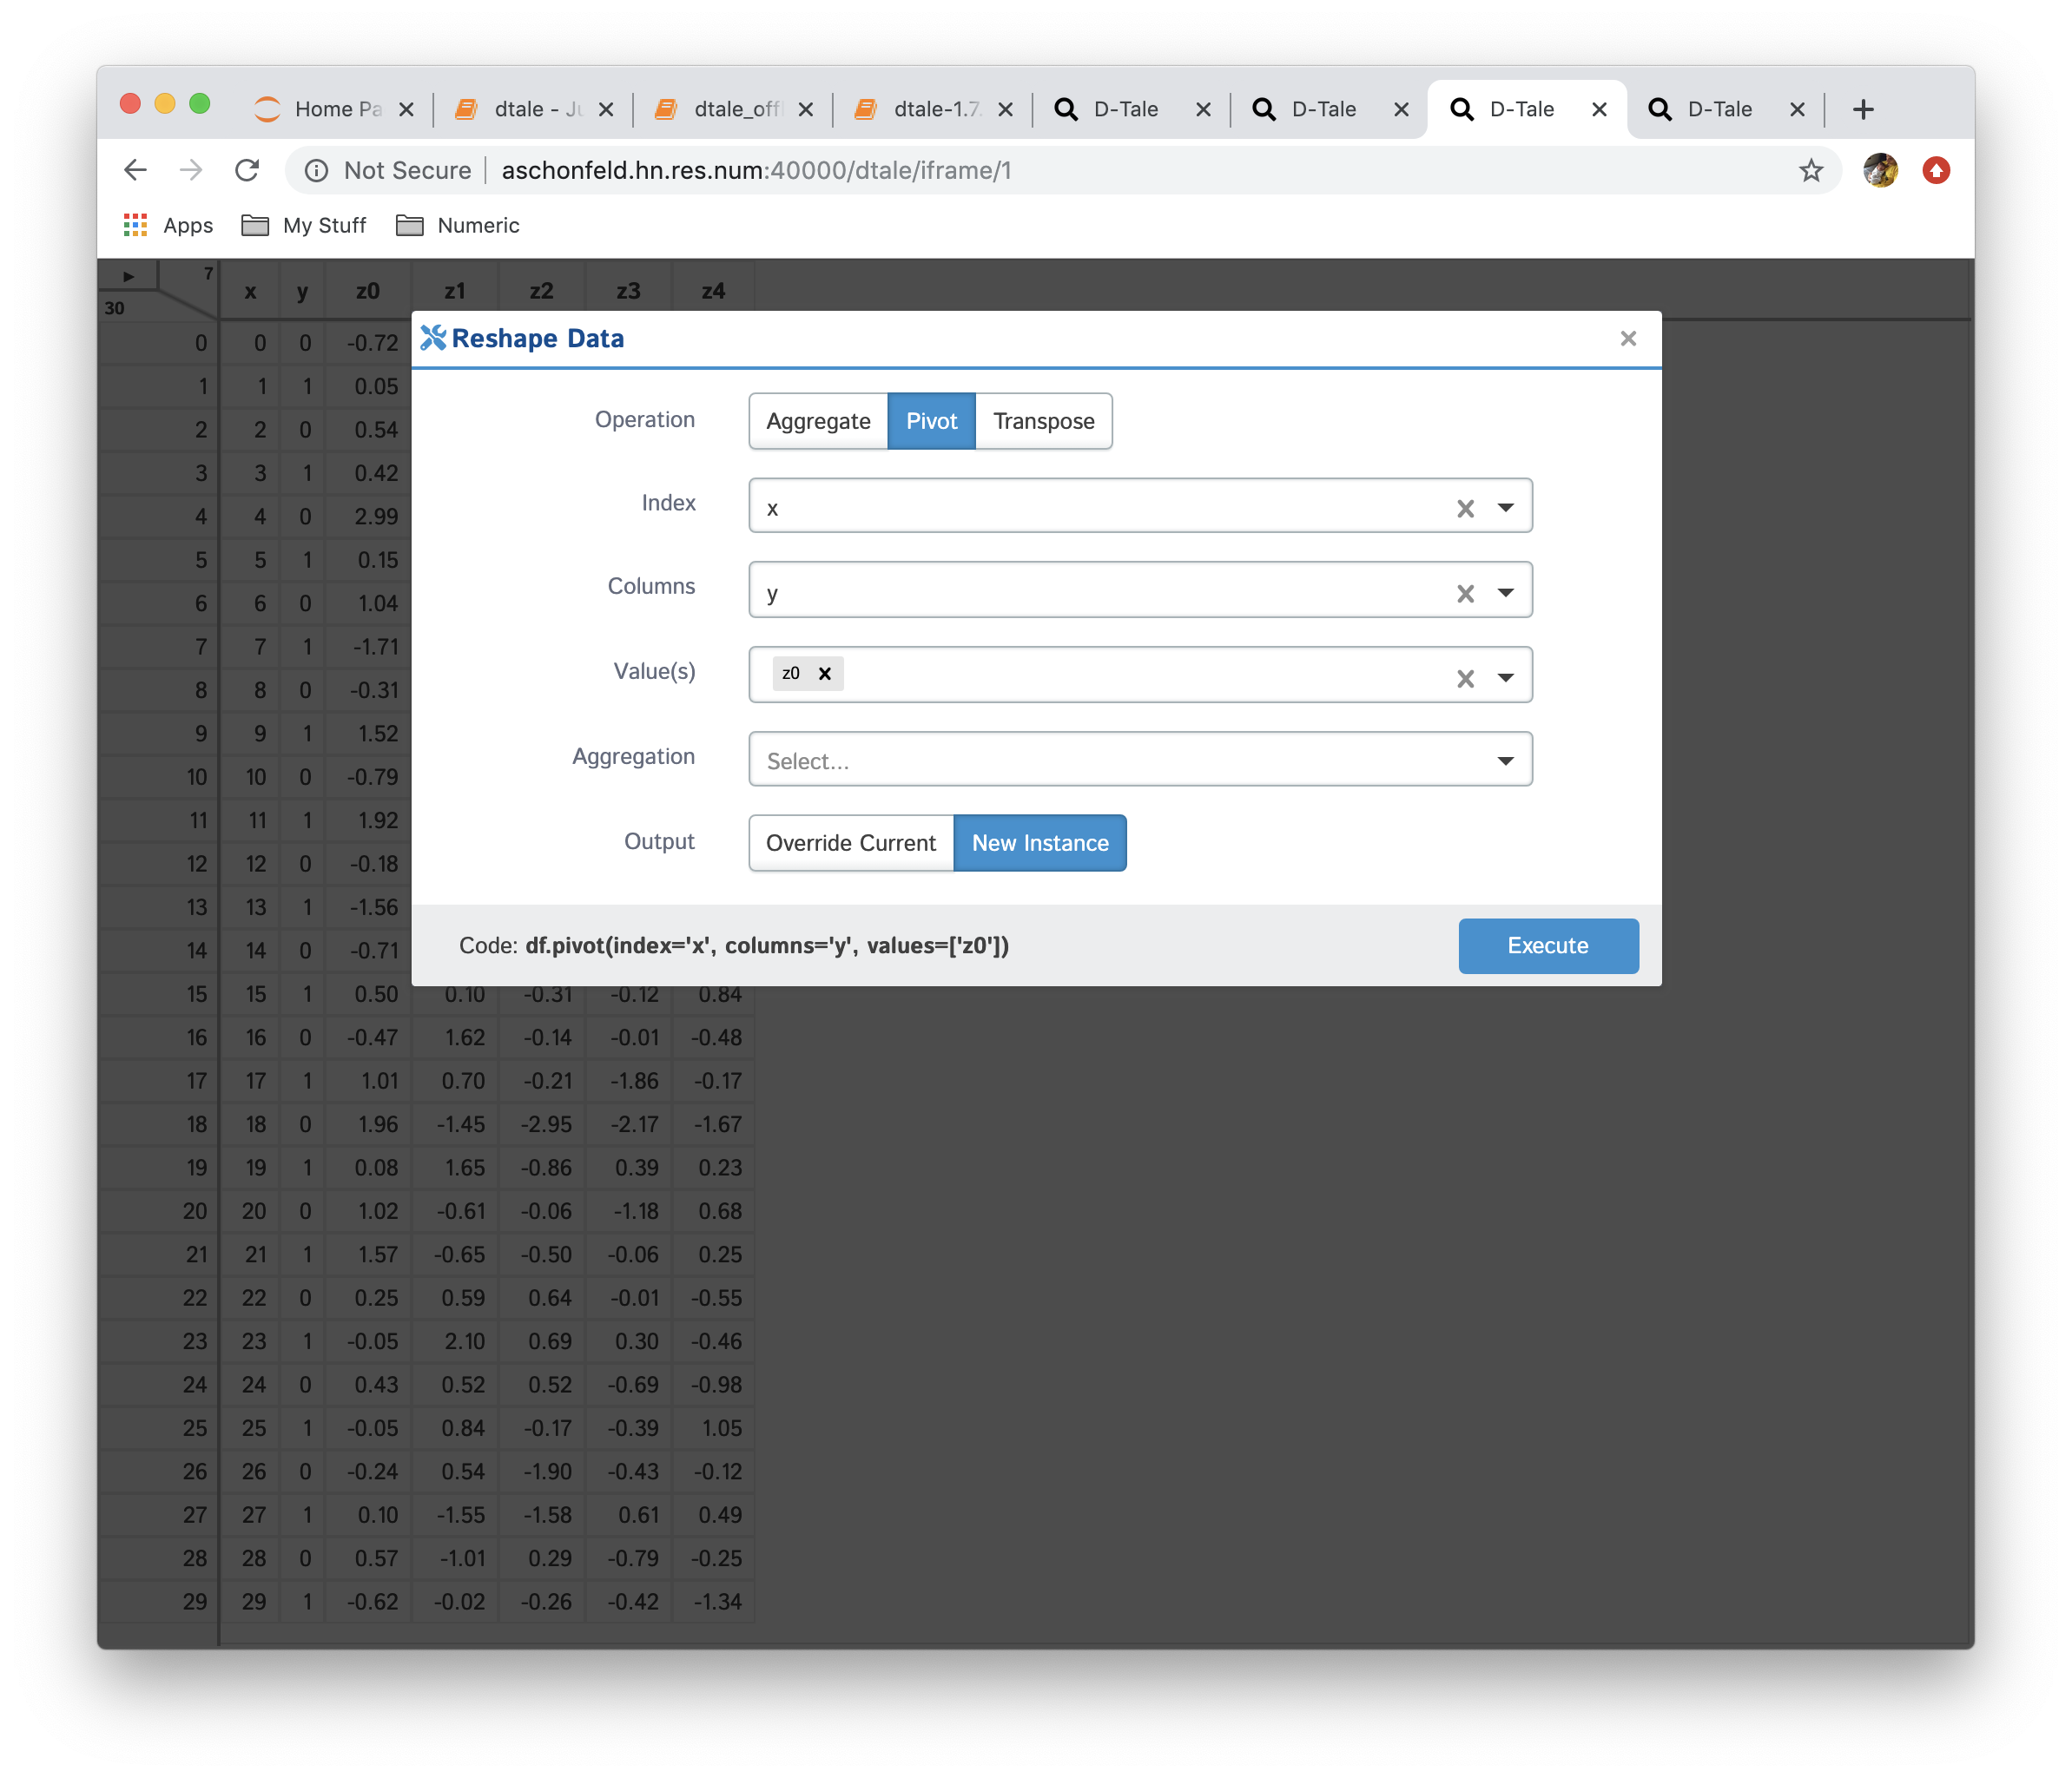
Summarize Data
This is very powerful functionality which allows users to create a new data from currently loaded data. The operations currently available are:
- Aggregation: consolidate data by running different aggregations on columns by a specific index
- Pivot: this is simple wrapper around pandas.Dataframe.pivot and pandas.pivot_table
- Transpose: transpose your data on a index (be careful dataframes can get very wide if your index has many unique values)
| Function | Data |
|---|---|
| No Reshaping | 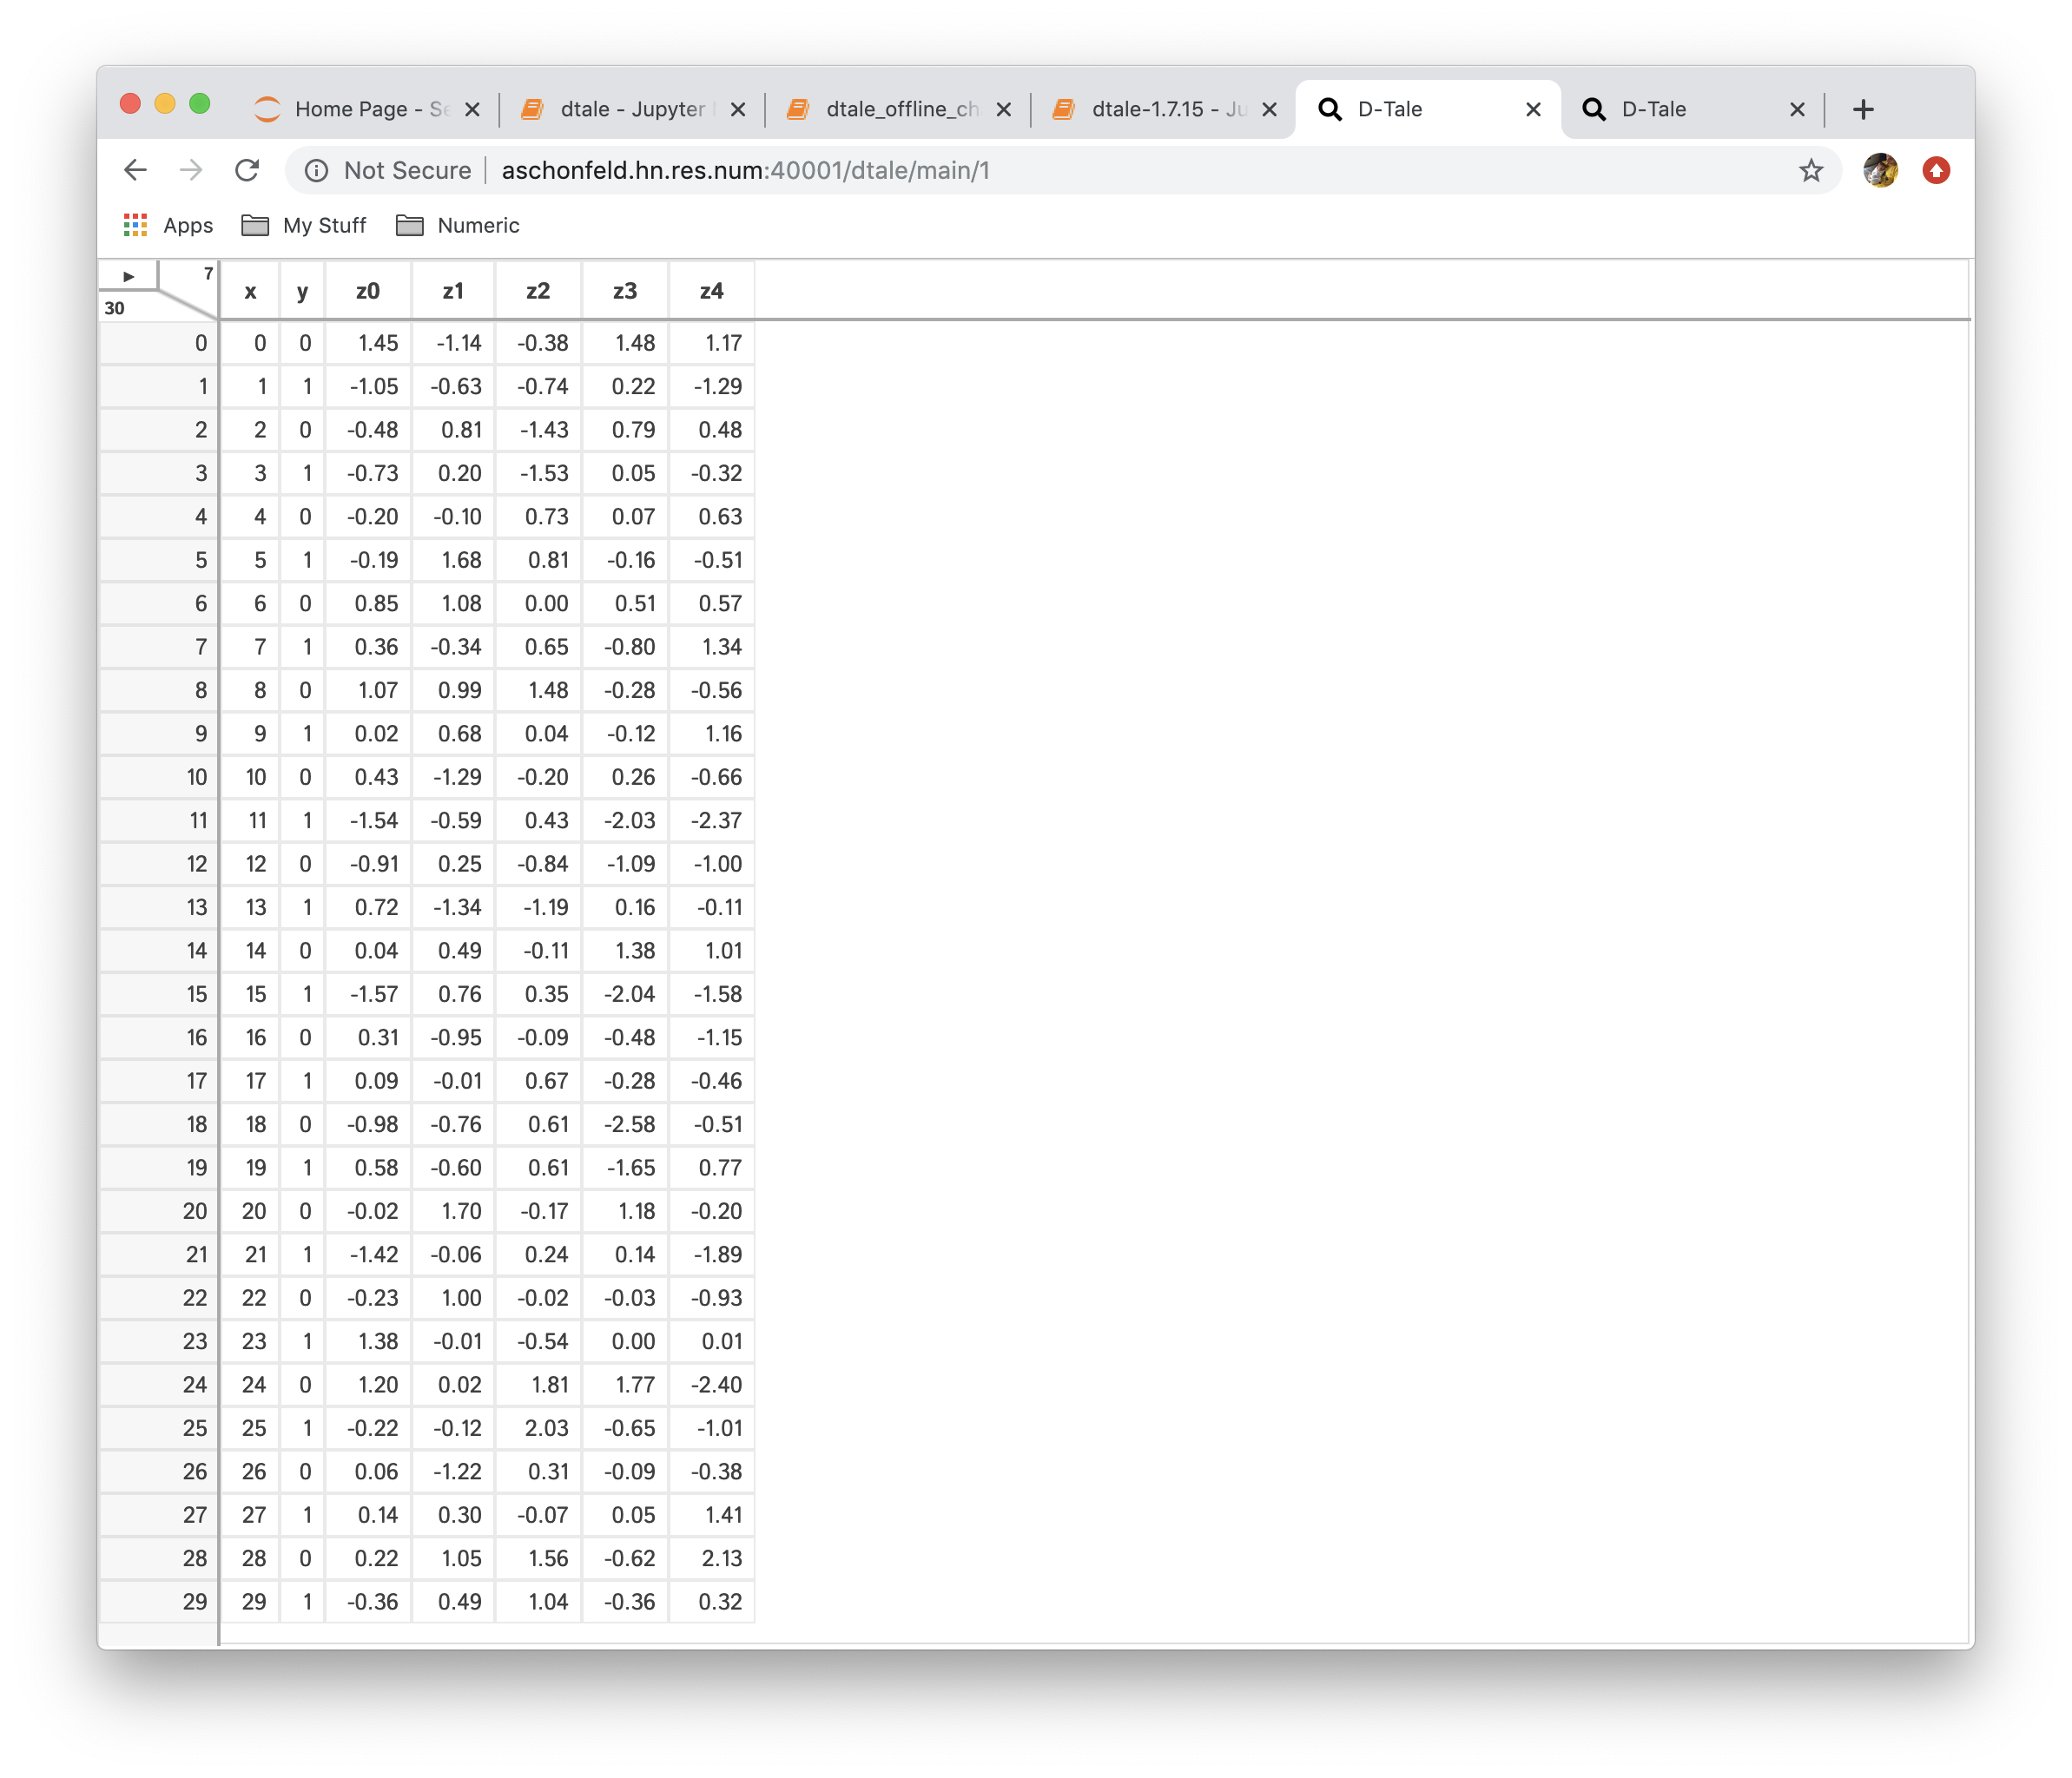 |
 |  |
 |  |
 |  |
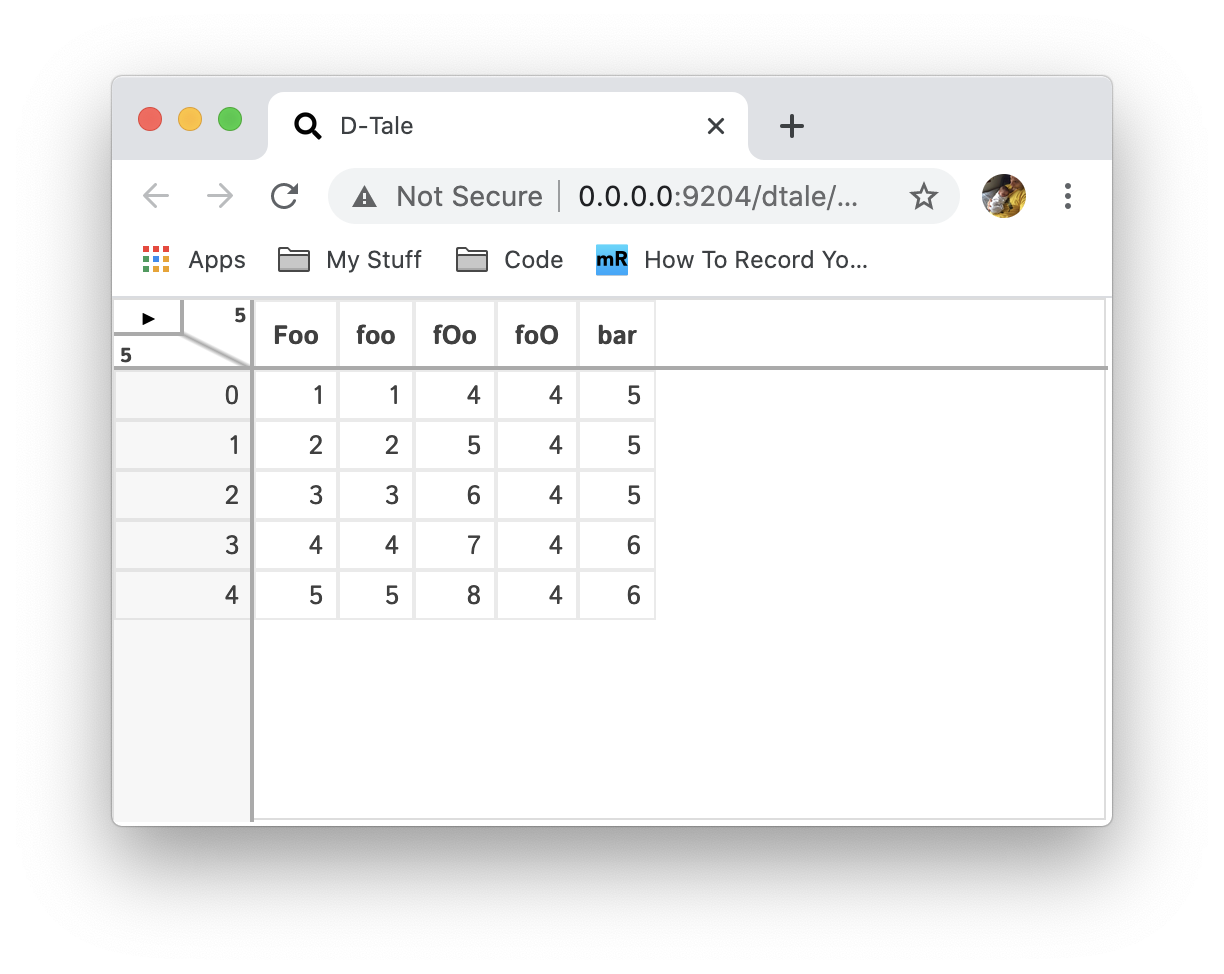
Duplicates
Remove duplicate columns/values from your data as well as extract duplicates out into separate instances.
The folowing screen shots are for a dataframe with the following data:
| Function | Description | Preview |
|---|---|---|
| Remove Duplicate Columns | Remove any columns that contain the same data as another and you can either keep the first, last or none of these columns that match this criteria. You can test which columns will be removed by clicking the "View Duplicates" button. |  |
| Remove Duplicate Column Names | Remove any columns with the same name (name comparison is case-insensitive) and you can either keep the first, last or none of these columns that match this criteria. You can test which columns will be removed by clicking the "View Duplicates" button. | 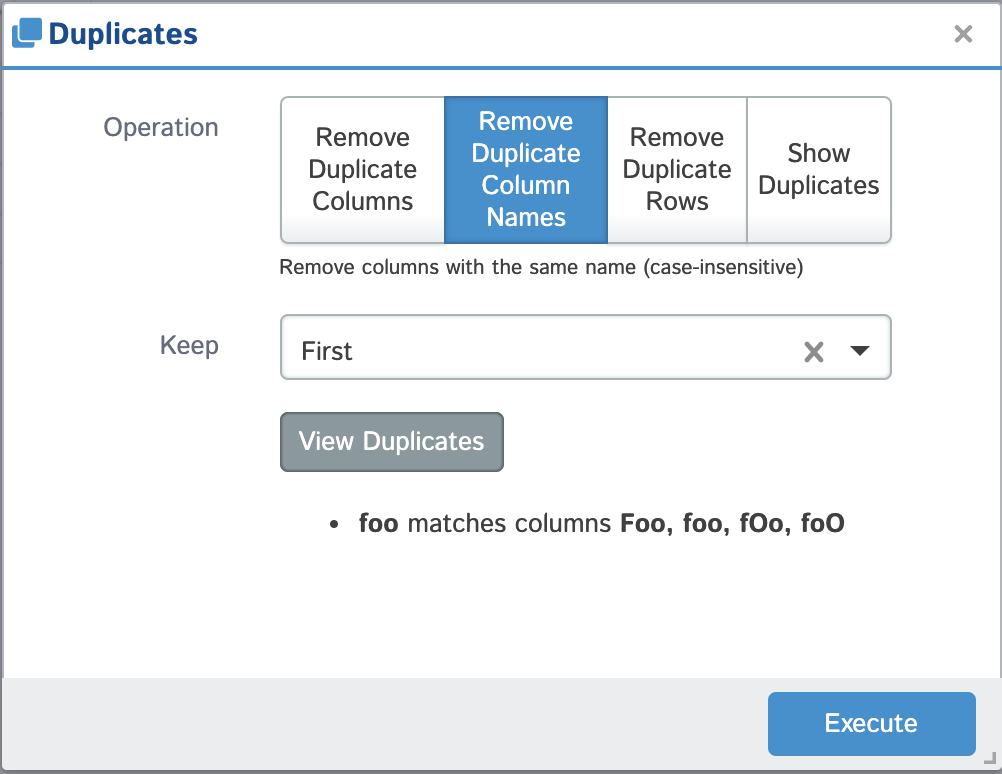 |
| Remove Duplicate Rows | Remove any rows from your dataframe where the values of a subset of columns are considered duplicates. You can choose to keep the first, last or none of the rows considered duplicated. | 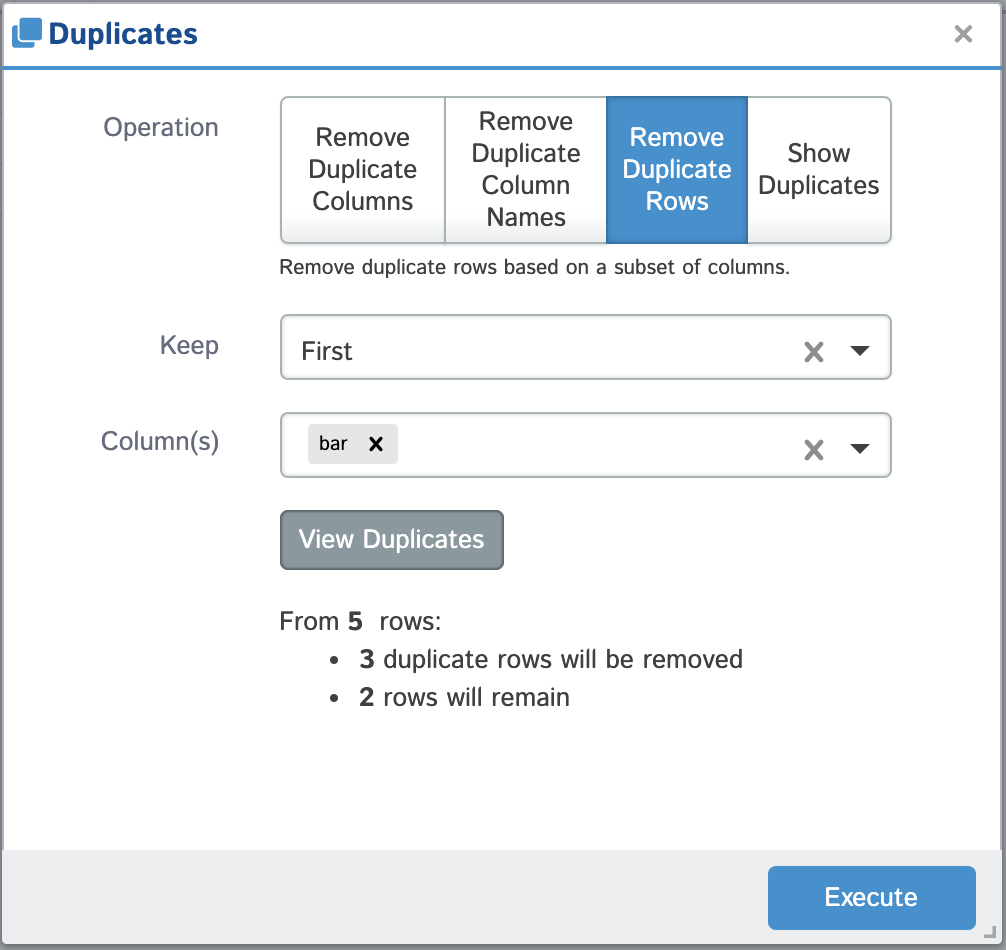 |
| Show Duplicates | Break any duplicate rows (based on a subset of columns) out into another dataframe viewable in your D-Tale session. You can choose to view all duplicates or select specific groups based on the duplicated value. | 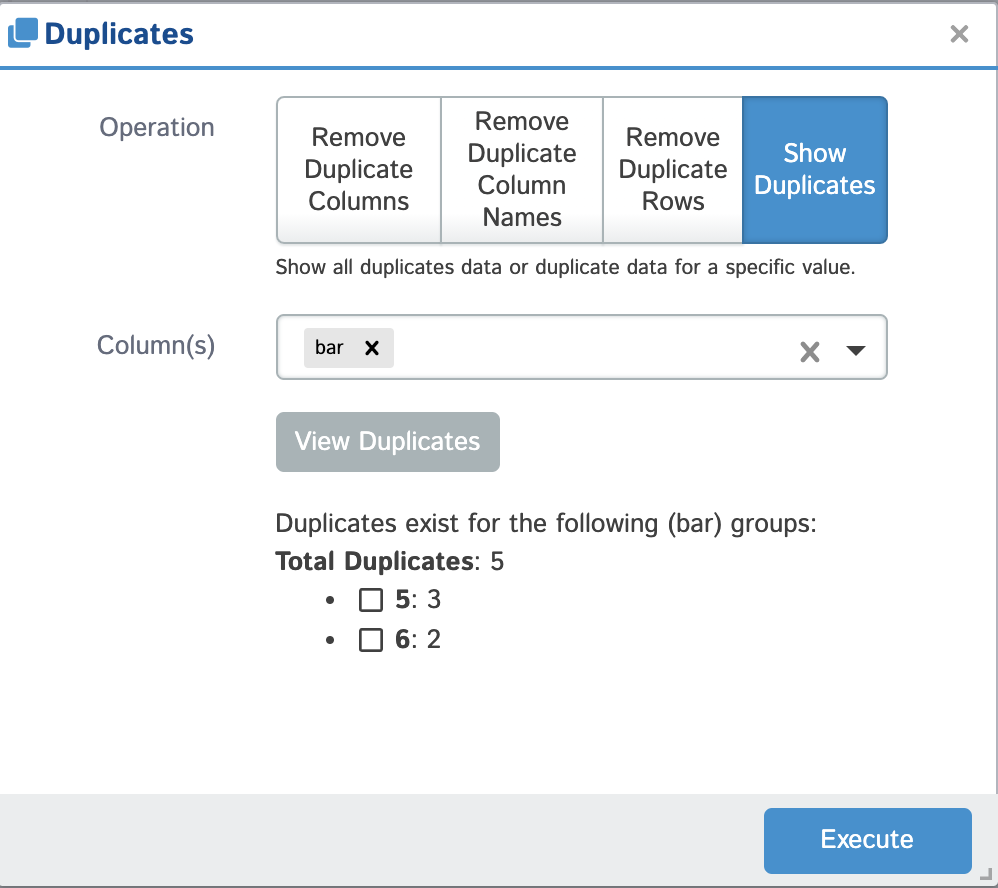 |
Missing Analysis
Display charts analyzing the presence of missing (NaN) data in your dataset using the missingno pacakage. You can also open them in a tab by themselves or export them to a static PNG using the links in the upper right corner. You can also close the side panel using the ESC key.
| Chart | Sample |
|---|---|
| Matrix | 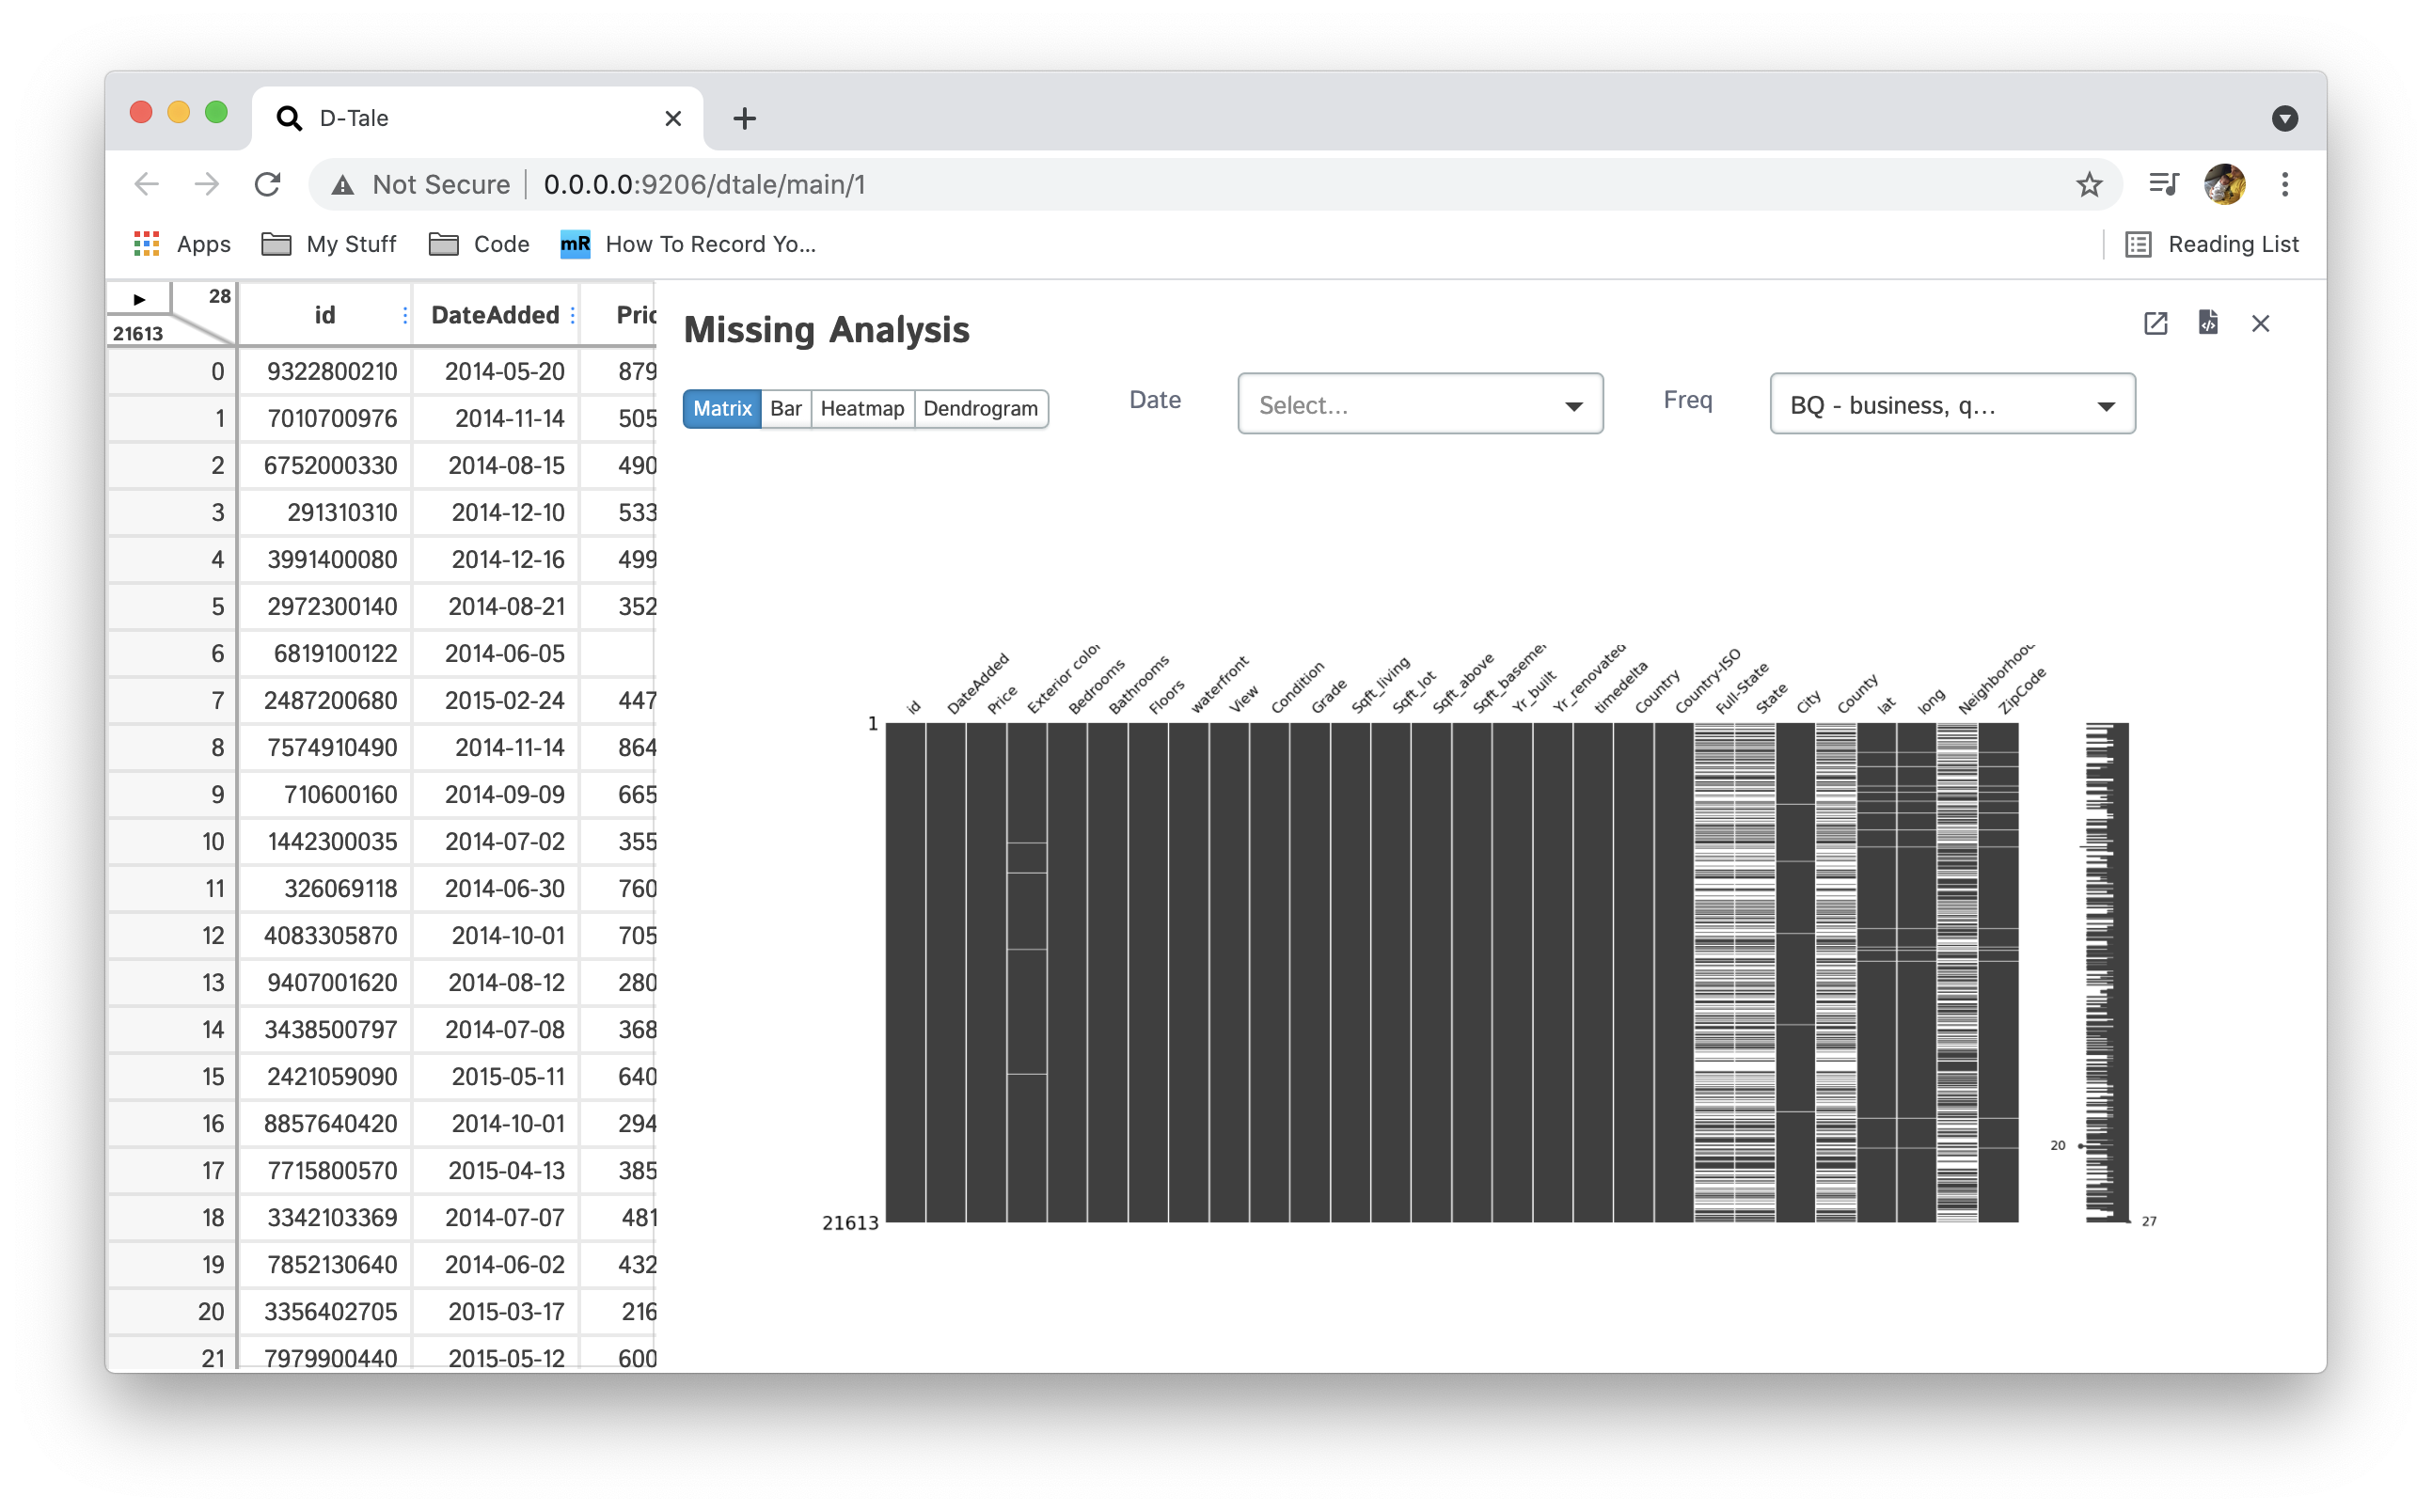 |
| Bar | 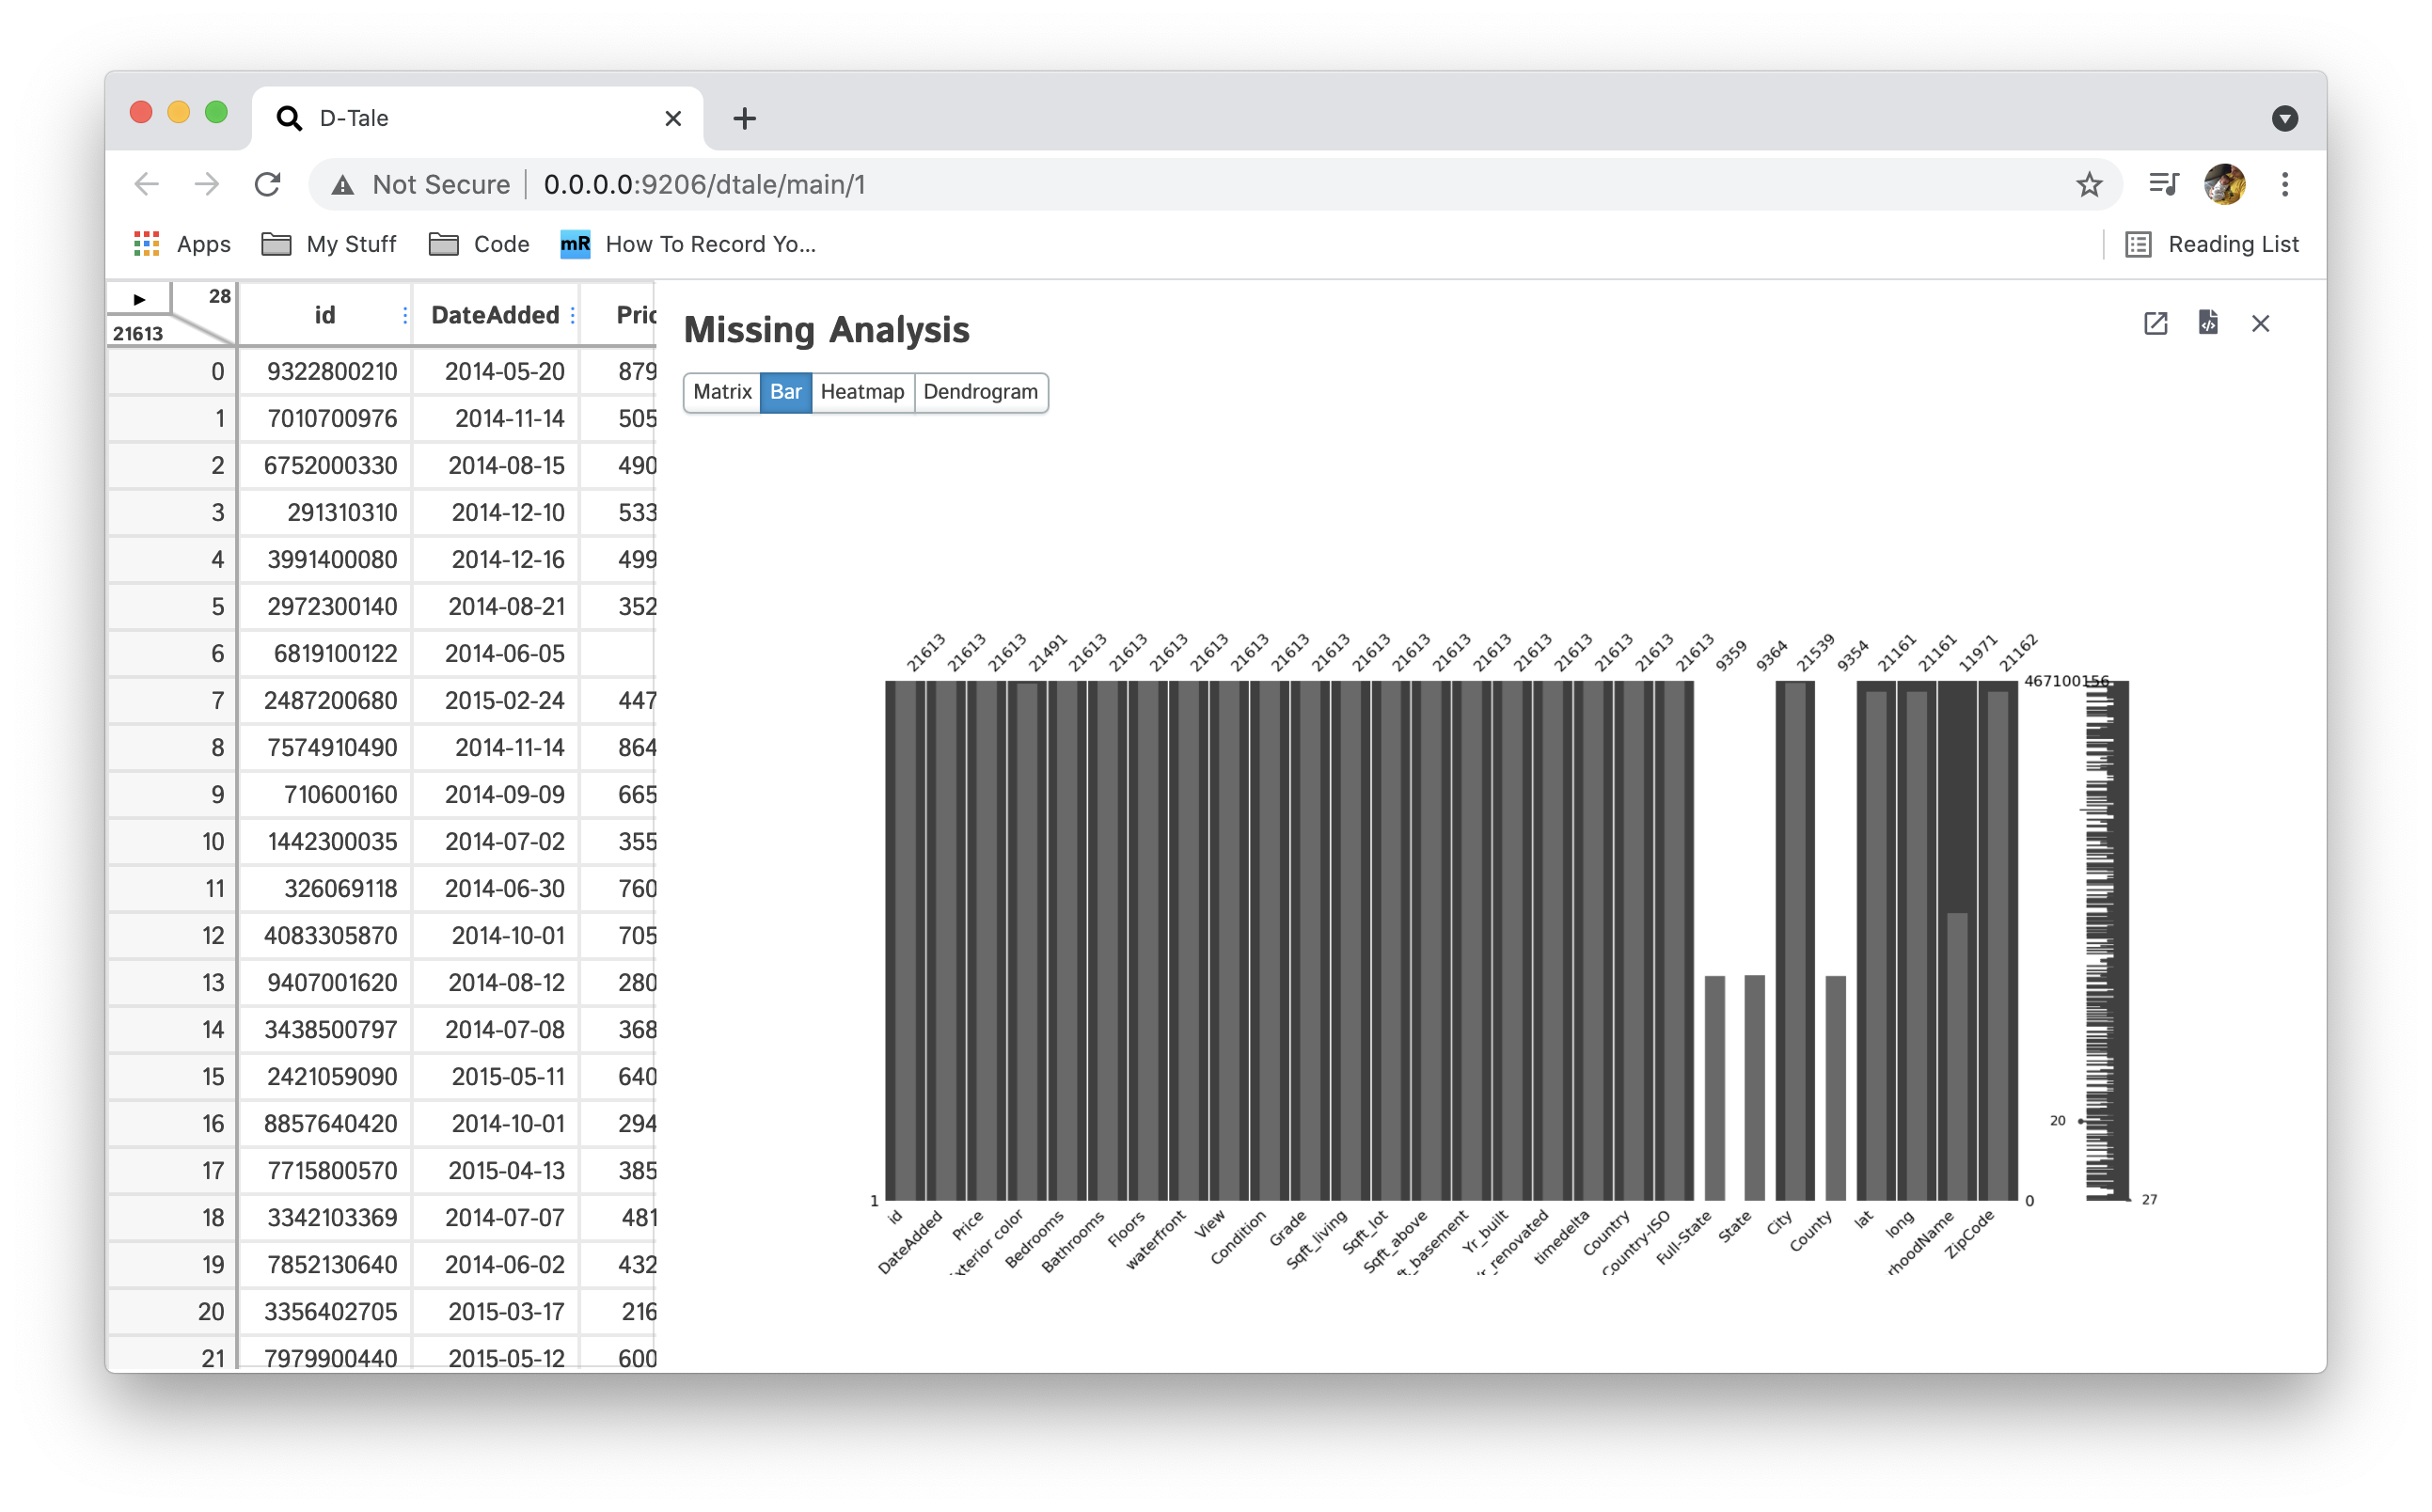 |
| Heatmap | 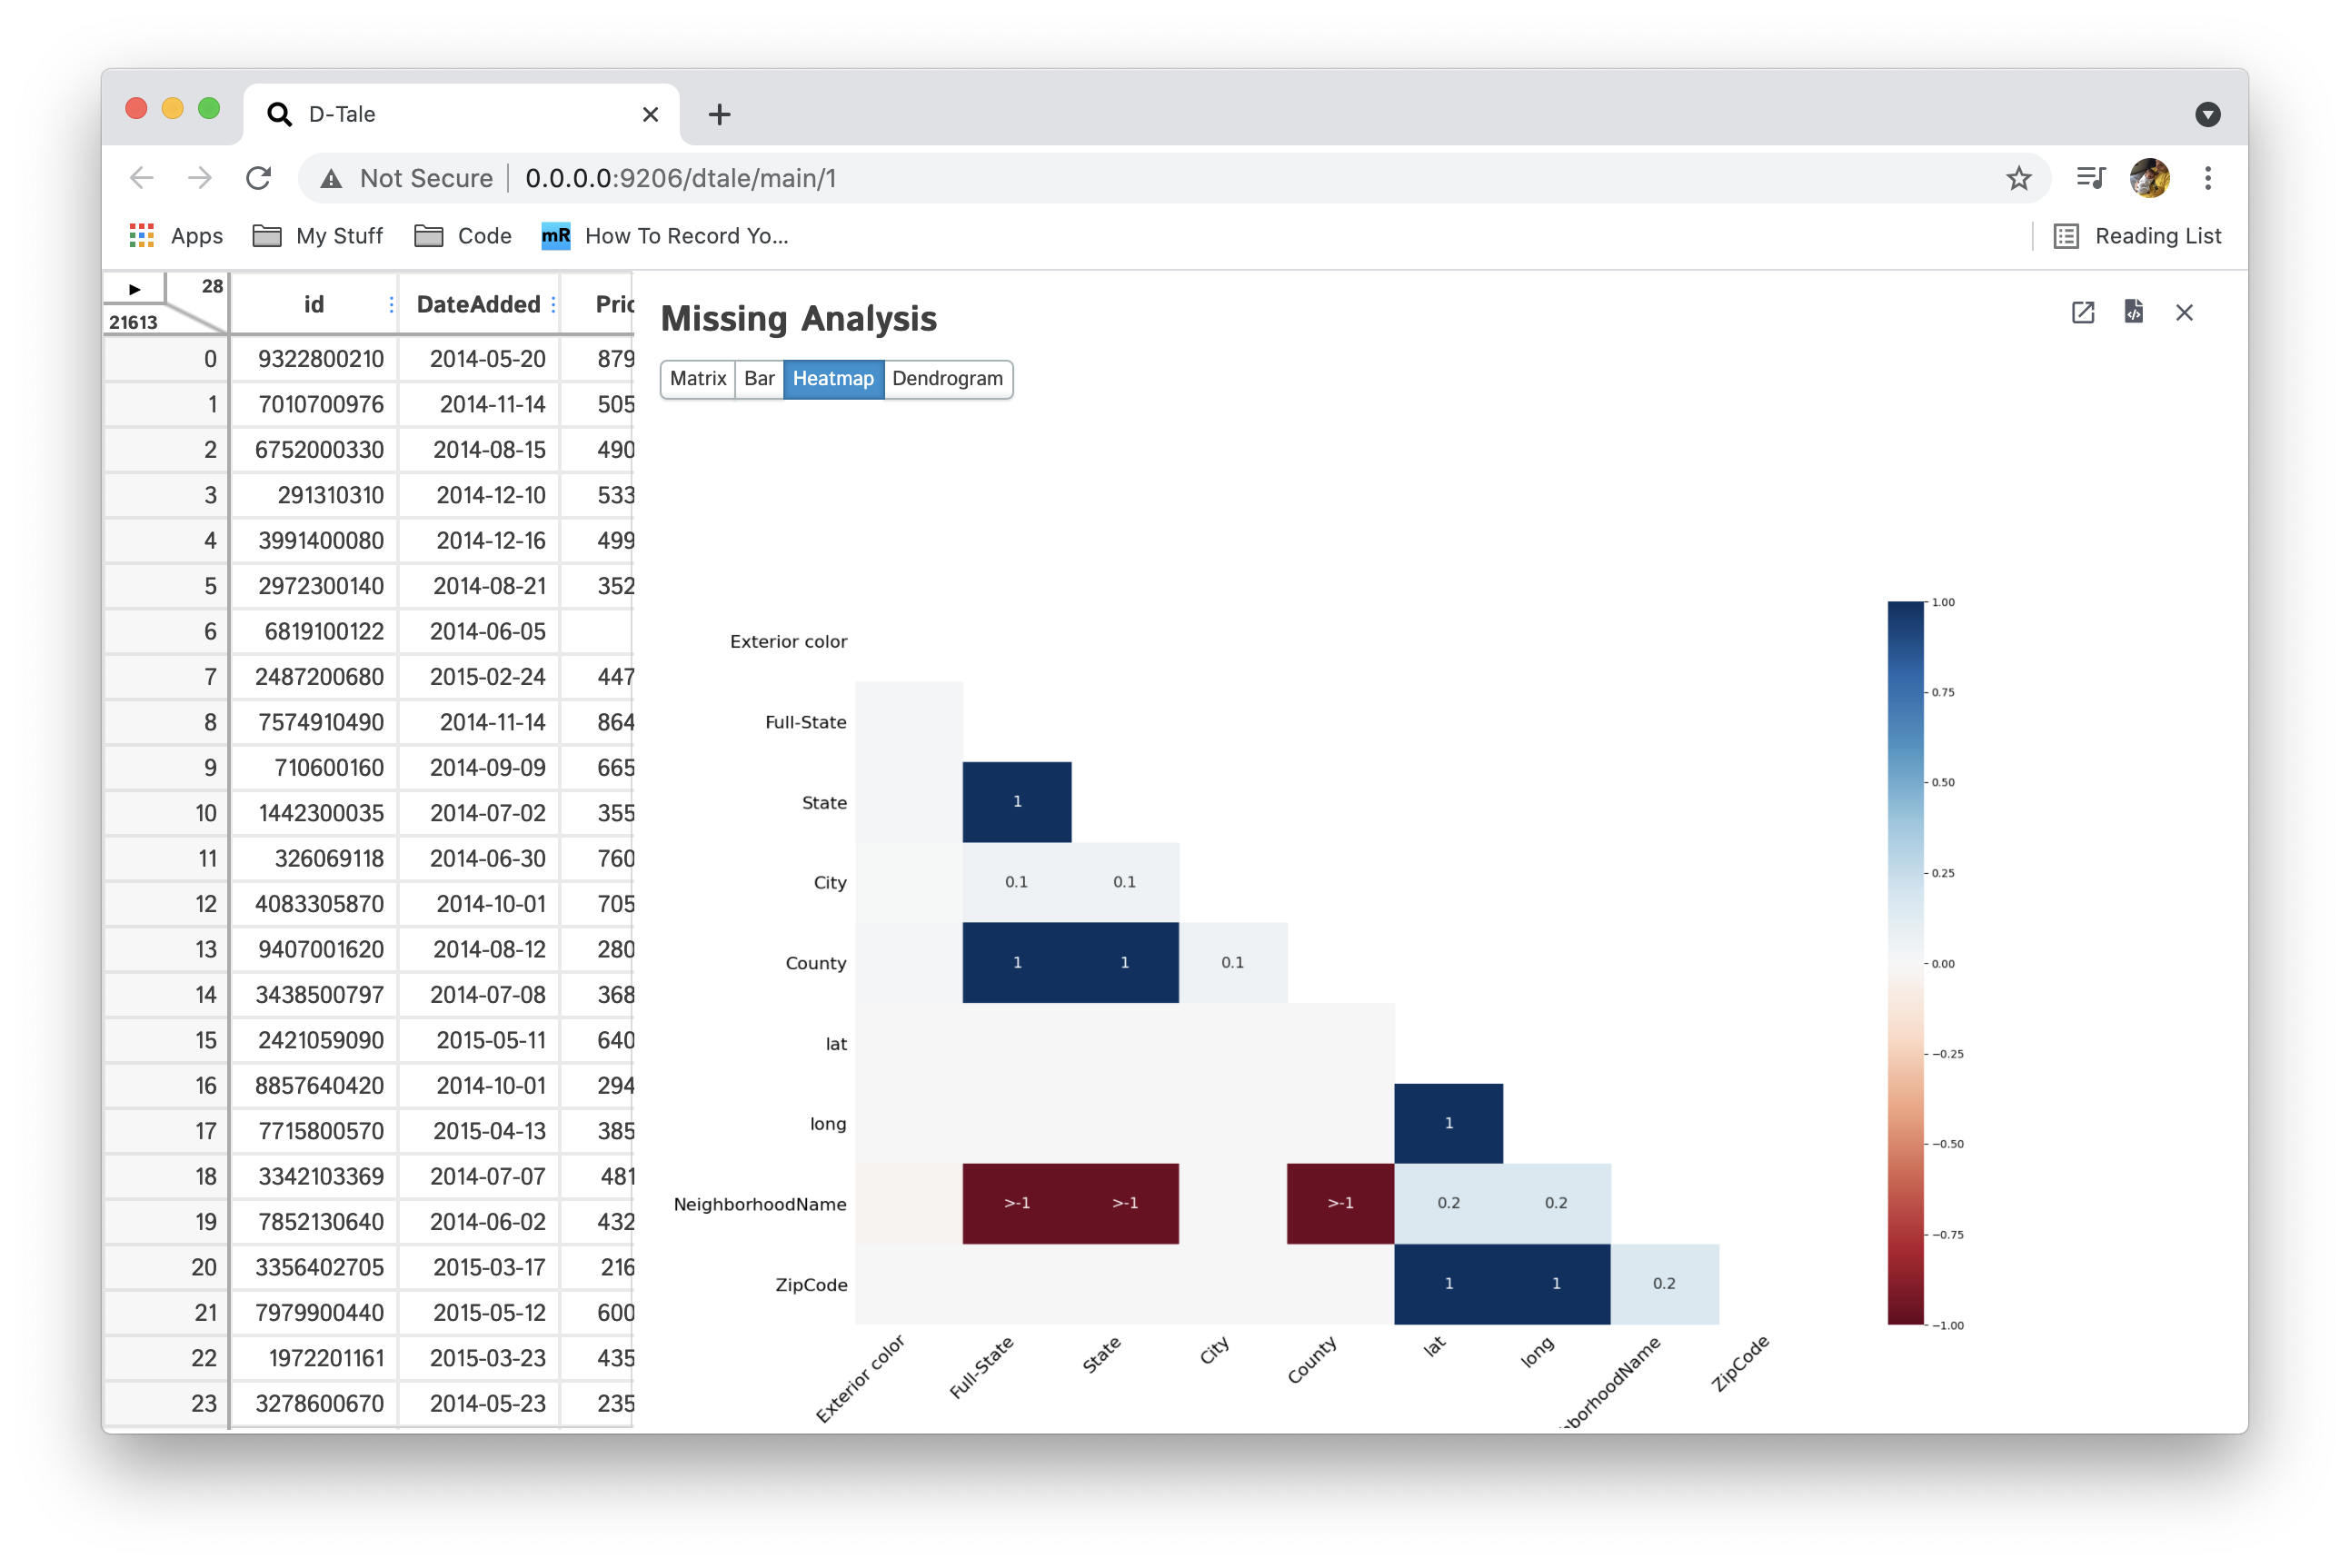 |
| Dendrogram | 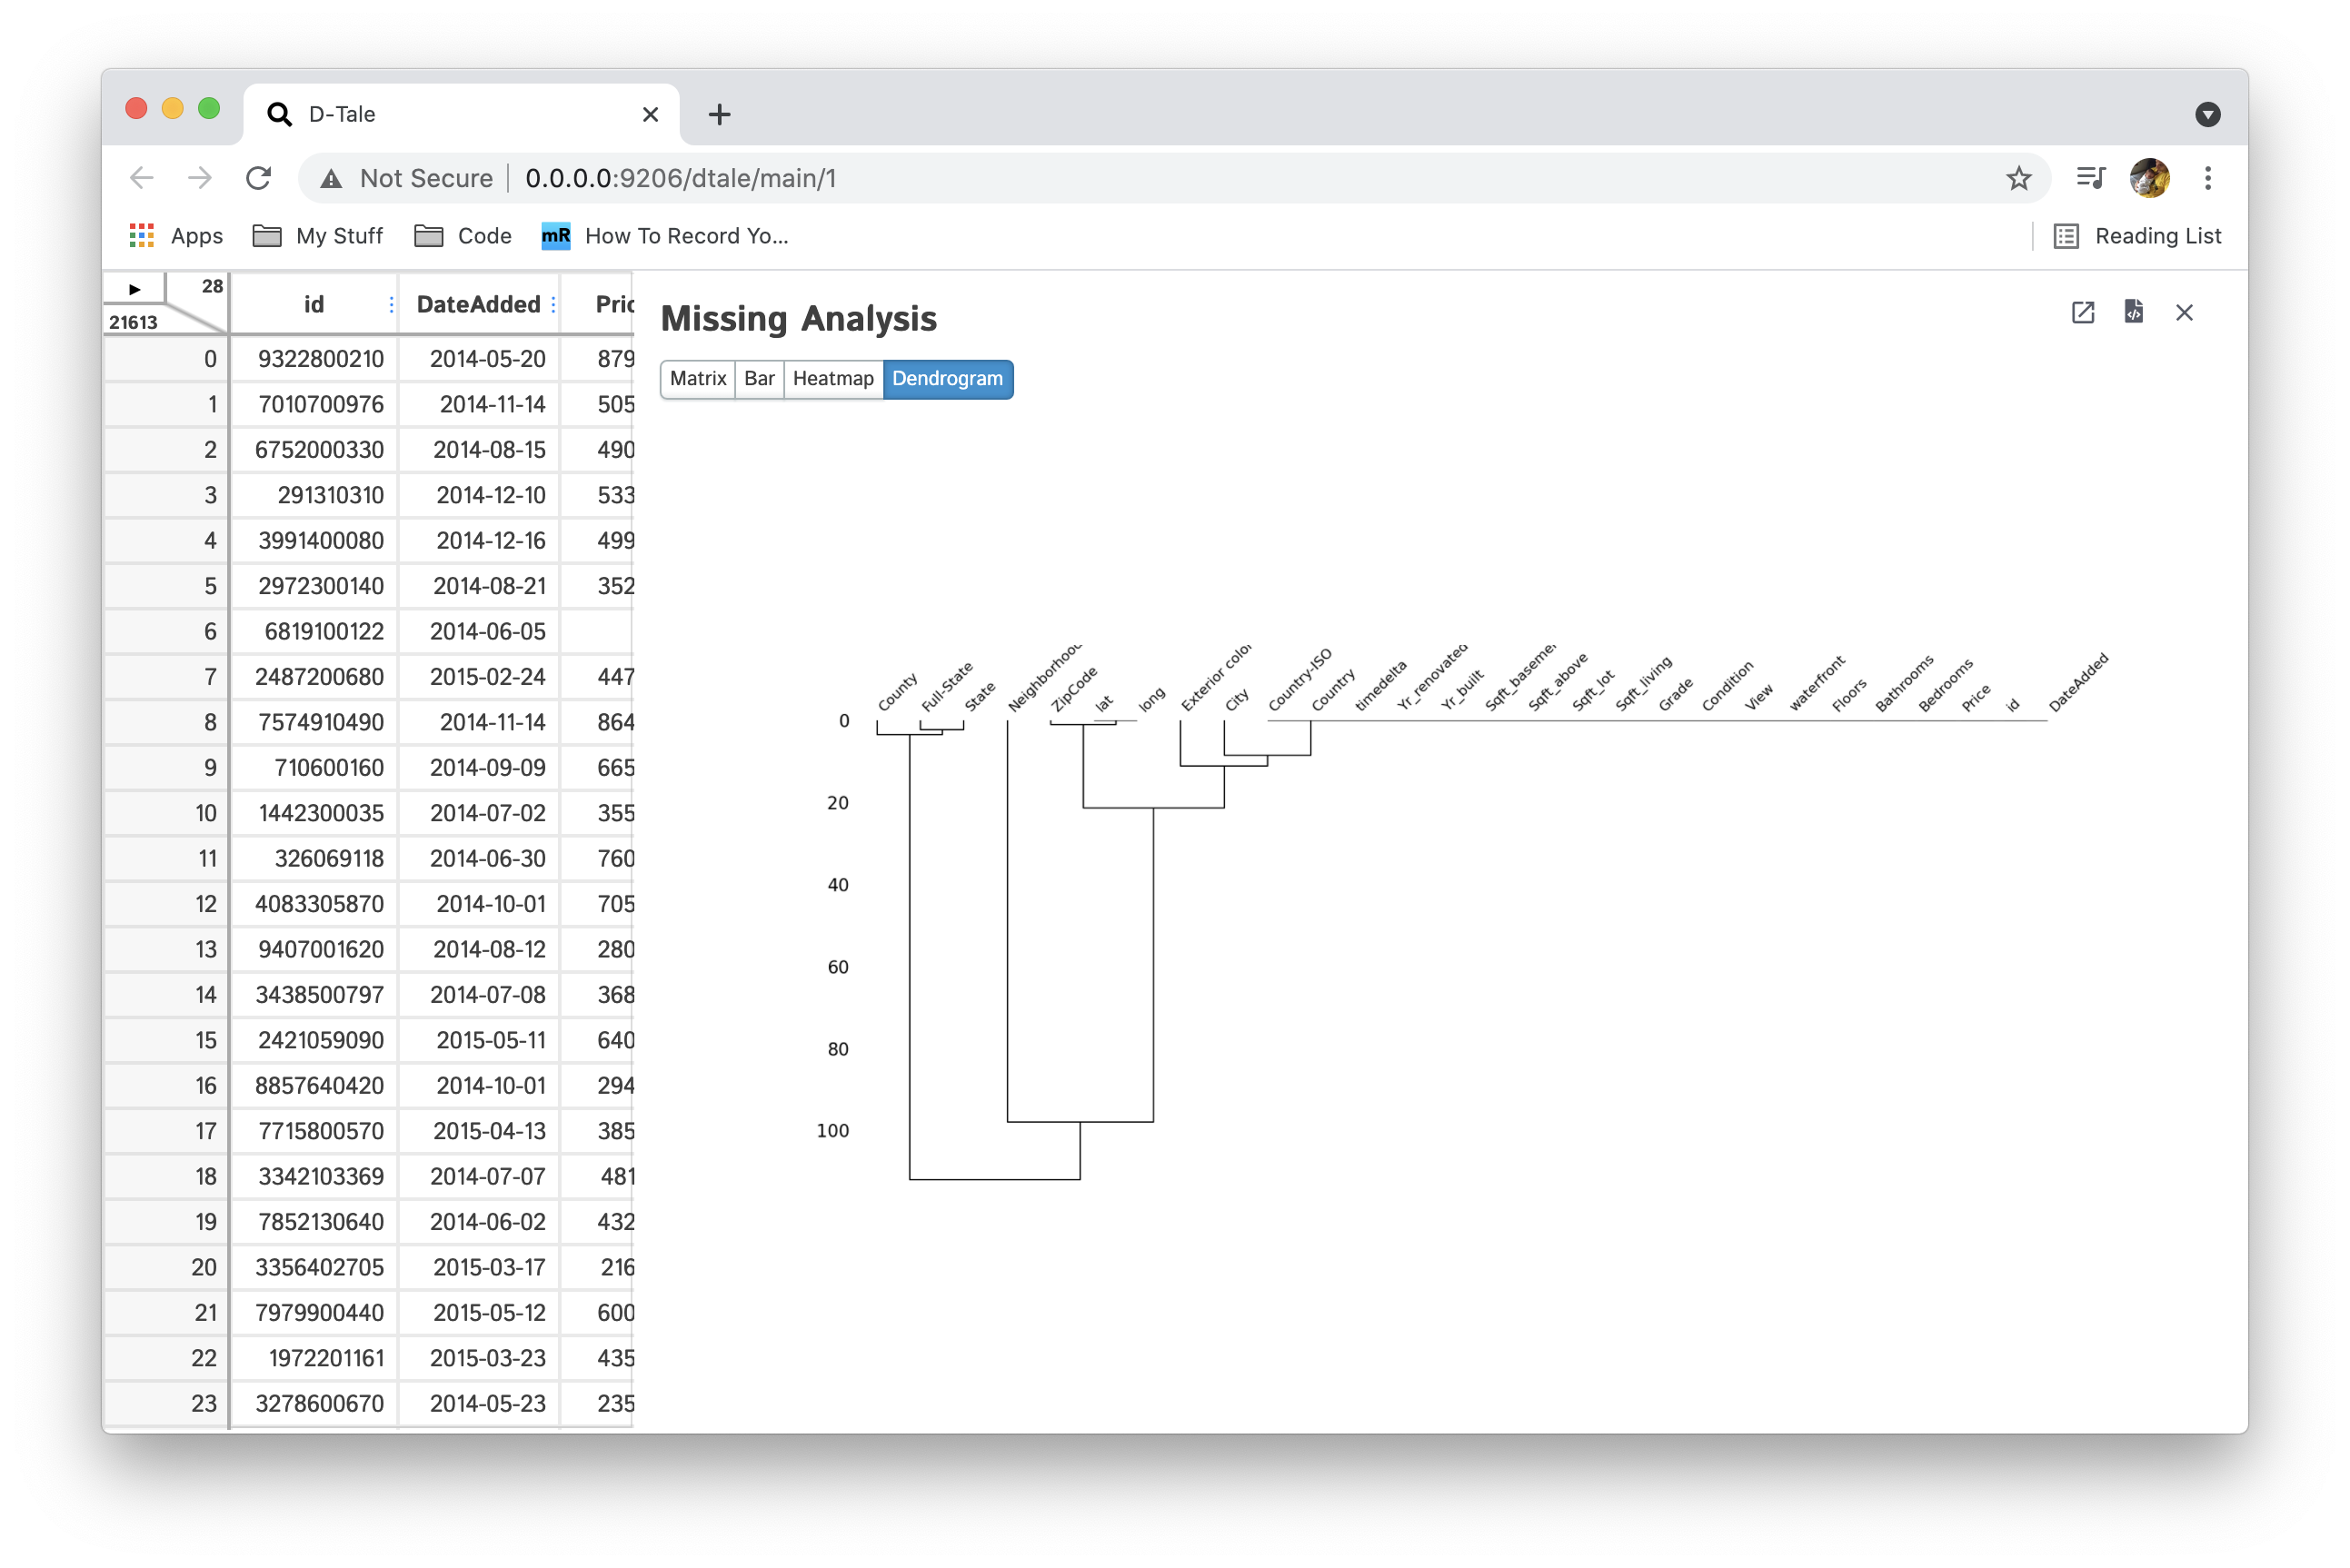 |
Charts
Build custom charts based off your data(powered by plotly/dash).
- The Charts will open in a tab because of the fact there is so much functionality offered there you'll probably want to be able to reference the main grid data in the original tab
- To build a chart you must pick a value for X & Y inputs which effectively drive what data is along the X & Y axes
- If you are working with a 3-Dimensional chart (heatmap, 3D Scatter, Surface) you'll need to enter a value for the Z axis as well
- Once you have entered all the required axes a chart will be built
- If your data along the x-axis (or combination of x & y in the case of 3D charts) has duplicates you have three options:
- Specify a group, which will create series for each group
- Specify an aggregation, you can choose from one of the following: Count, First, Last, Mean, Median, Minimum, Maximum, Standard Deviation, Variance, Mean Absolute Deviation, Product of All Items, Sum, Rolling
- Specifying a "Rolling" aggregation will also require a Window & a Computation (Correlation, Count, Covariance, Kurtosis, Maximum, Mean, Median, Minimum, Skew, Standard Deviation, Sum or Variance)
- For heatmaps you will also have access to the "Correlation" aggregation since viewing correlation matrices in heatmaps is very useful. This aggregation is not supported elsewhere
- Specify both a group & an aggregation
- You now have the ability to toggle between different chart types: line, bar, pie, wordcloud, heatmap, 3D scatter & surface
- If you have specified a group then you have the ability between showing all series in one chart and breaking each series out into its own chart "Chart per Group"
Here are some examples:
| Chart Type | Chart | Chart per Group |
|---|---|---|
| line | 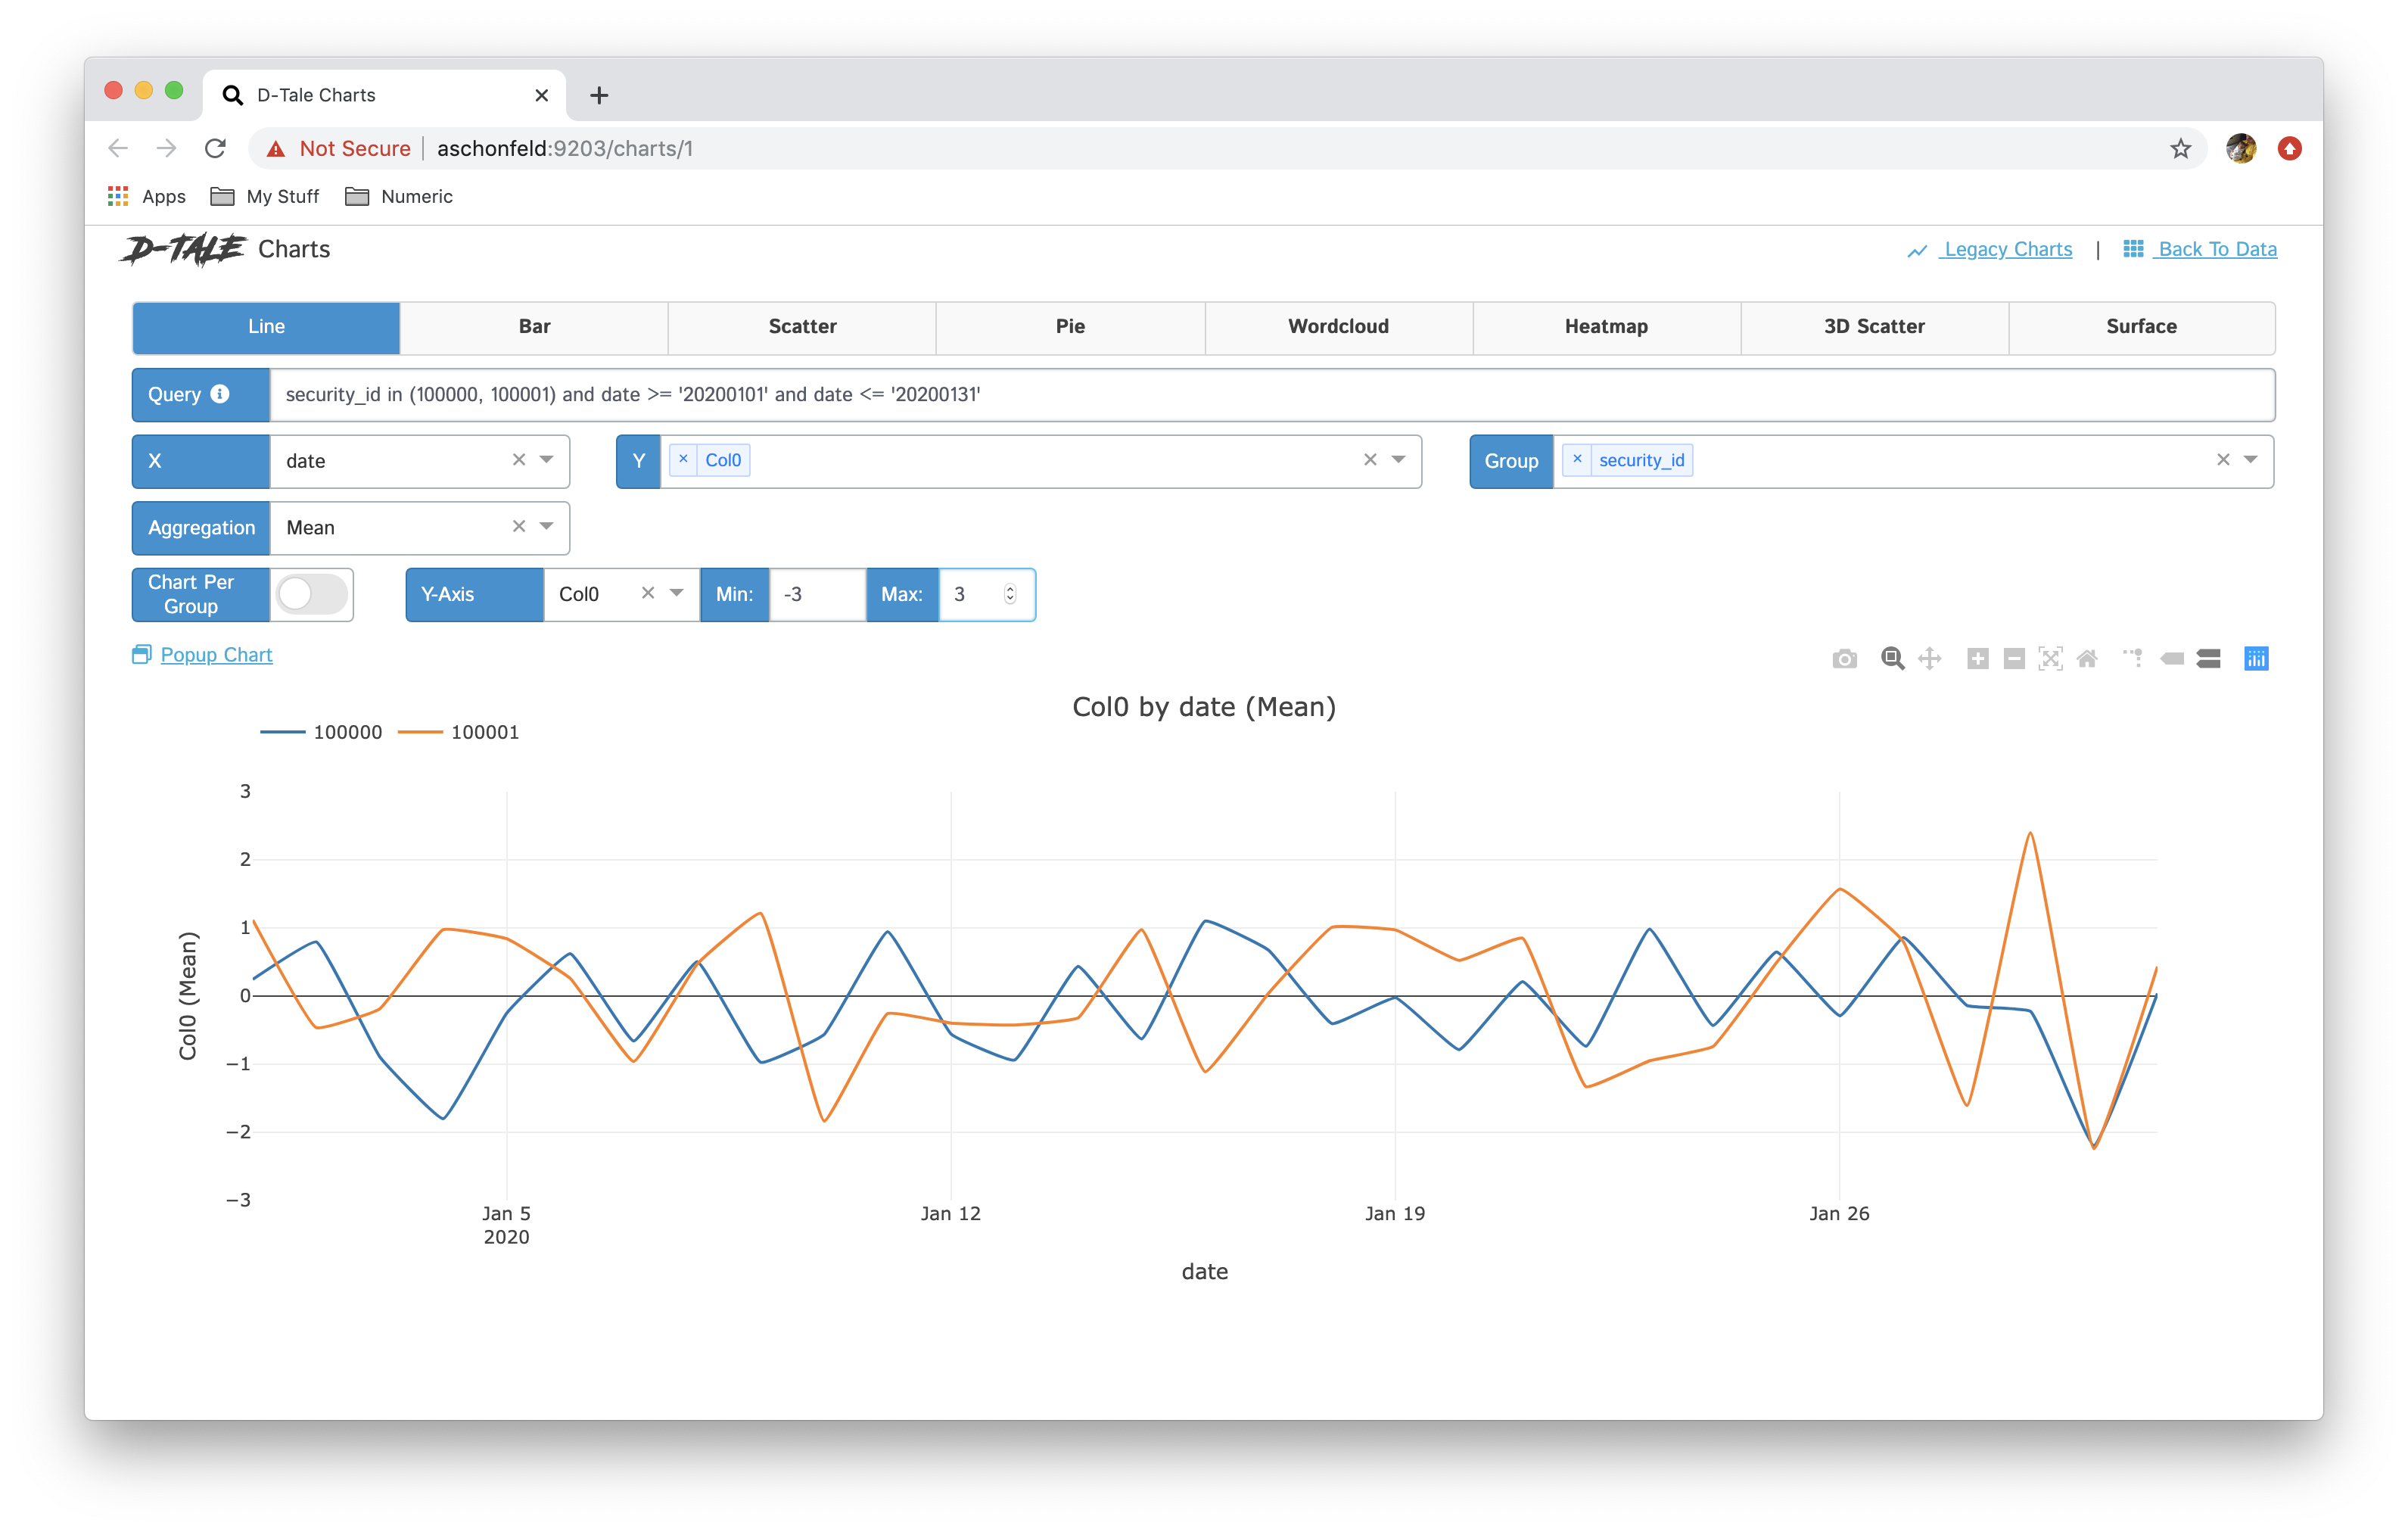 | 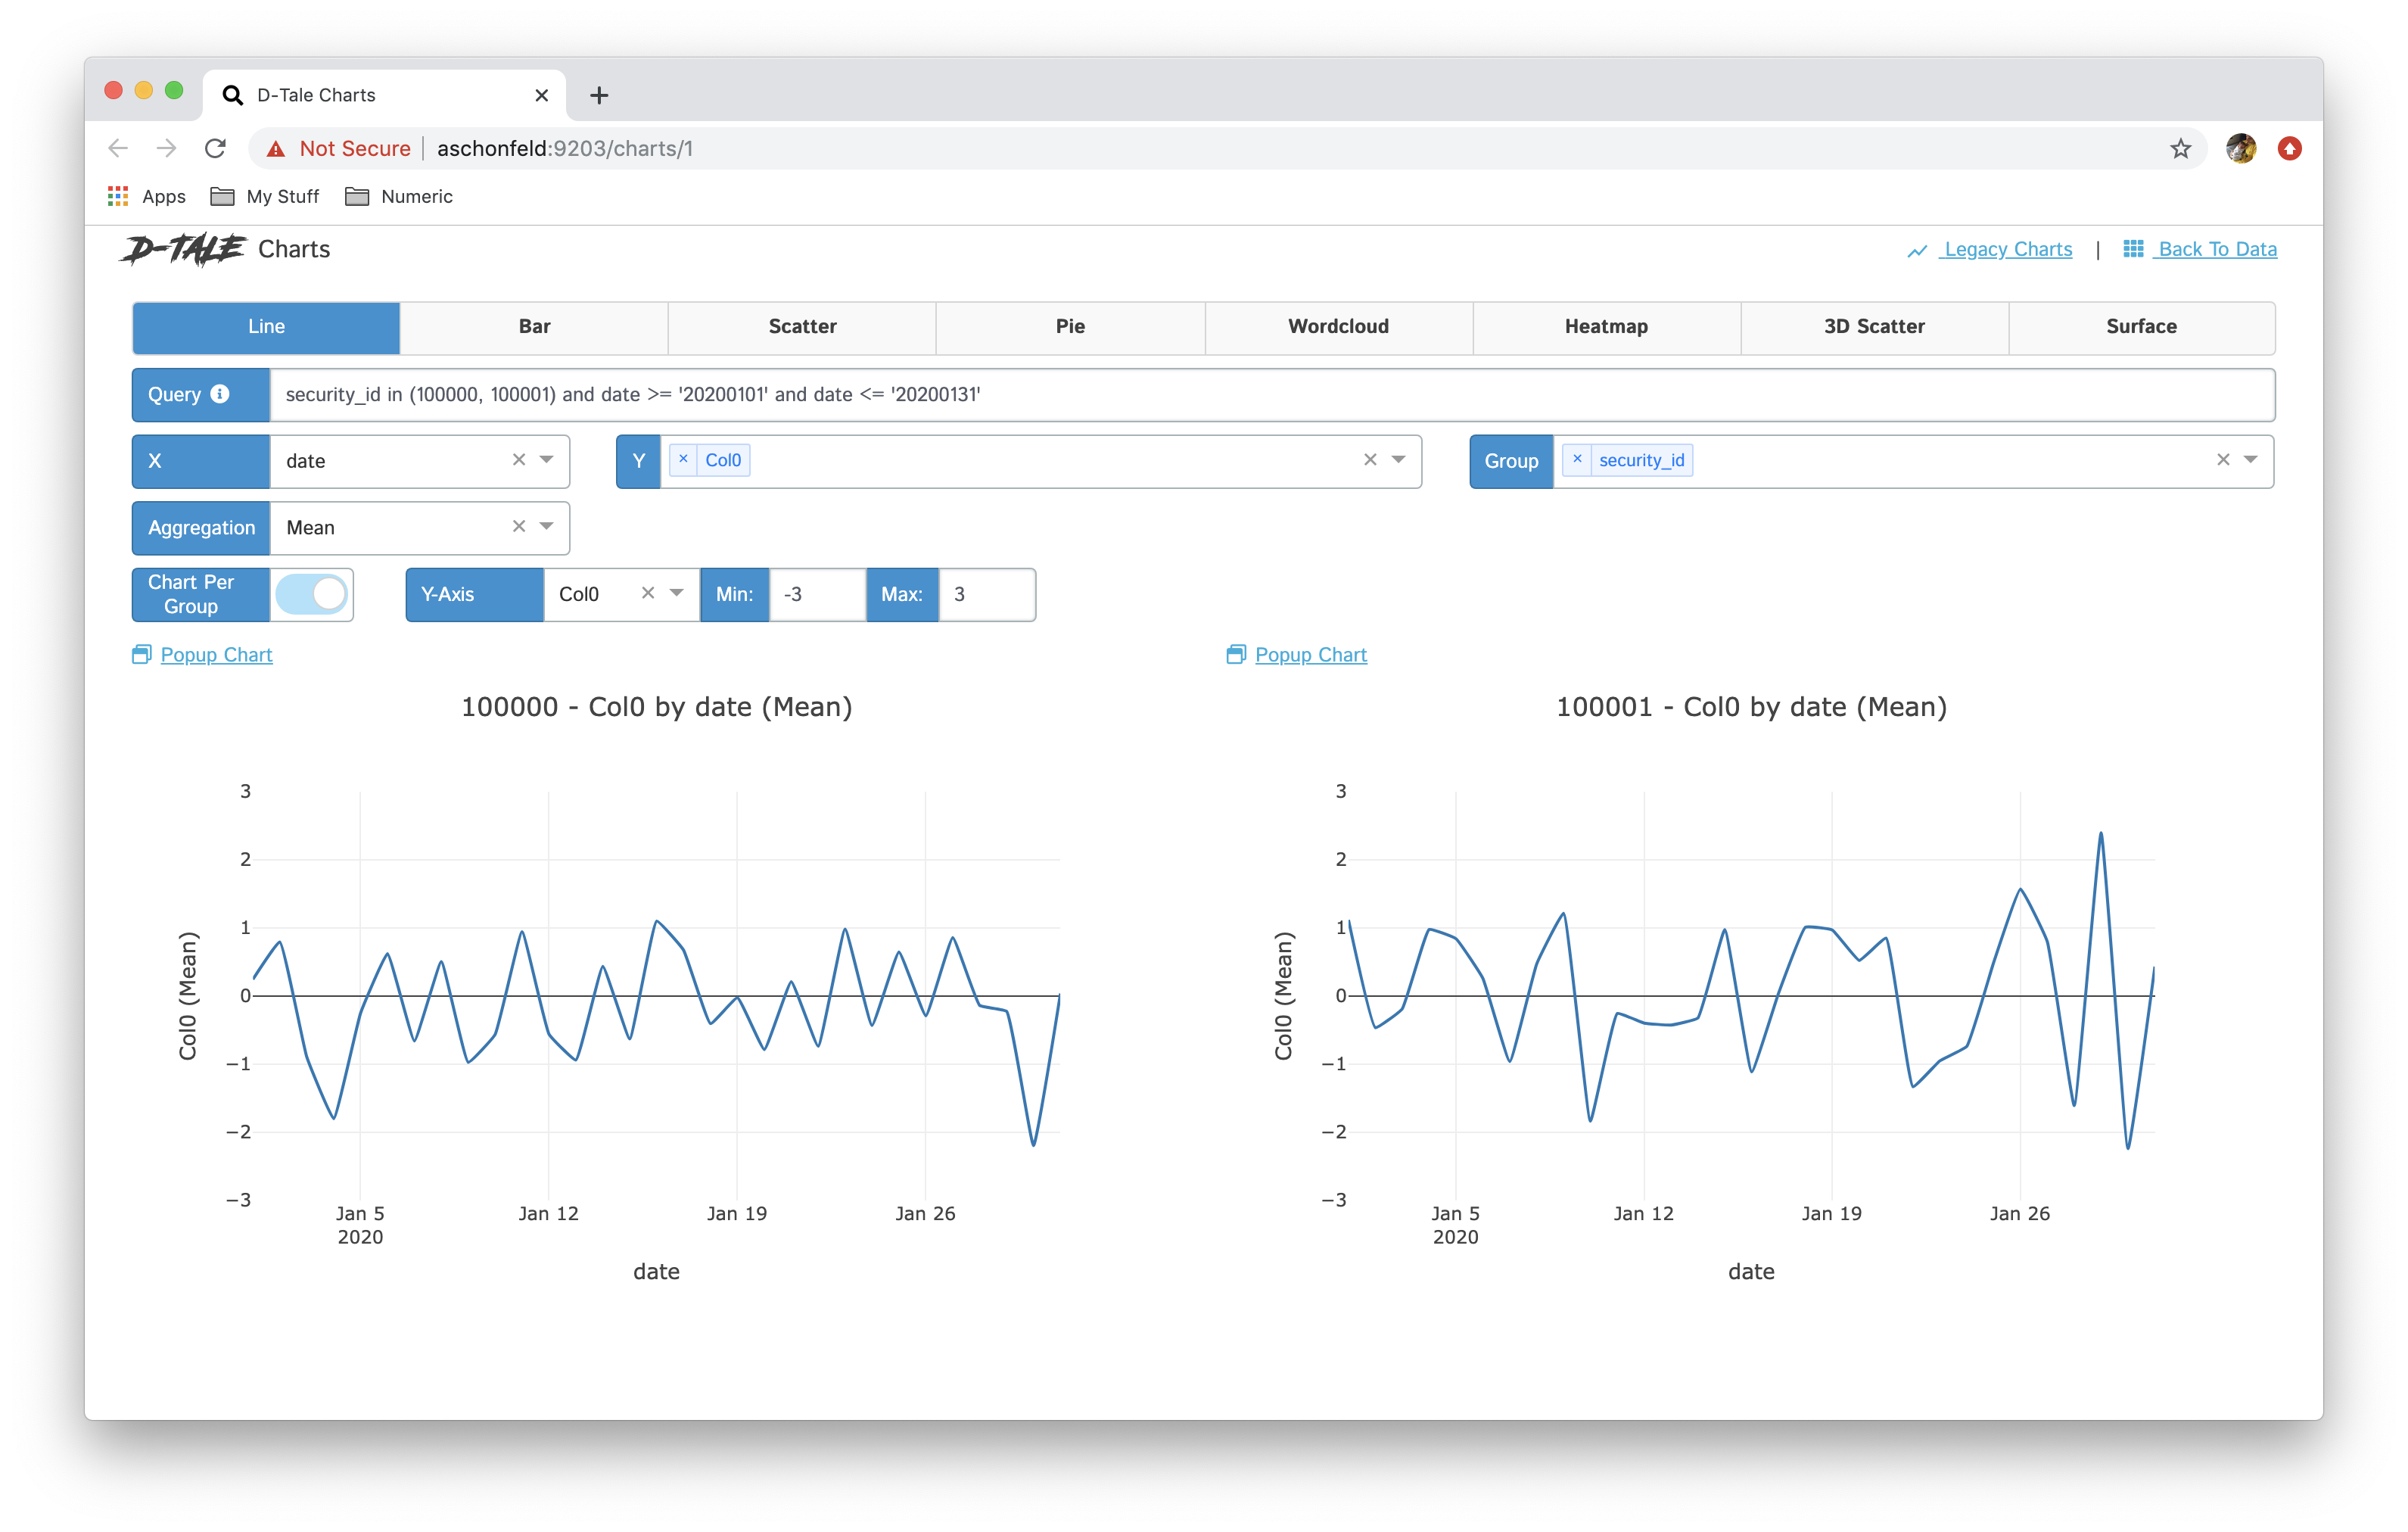 |
| bar | 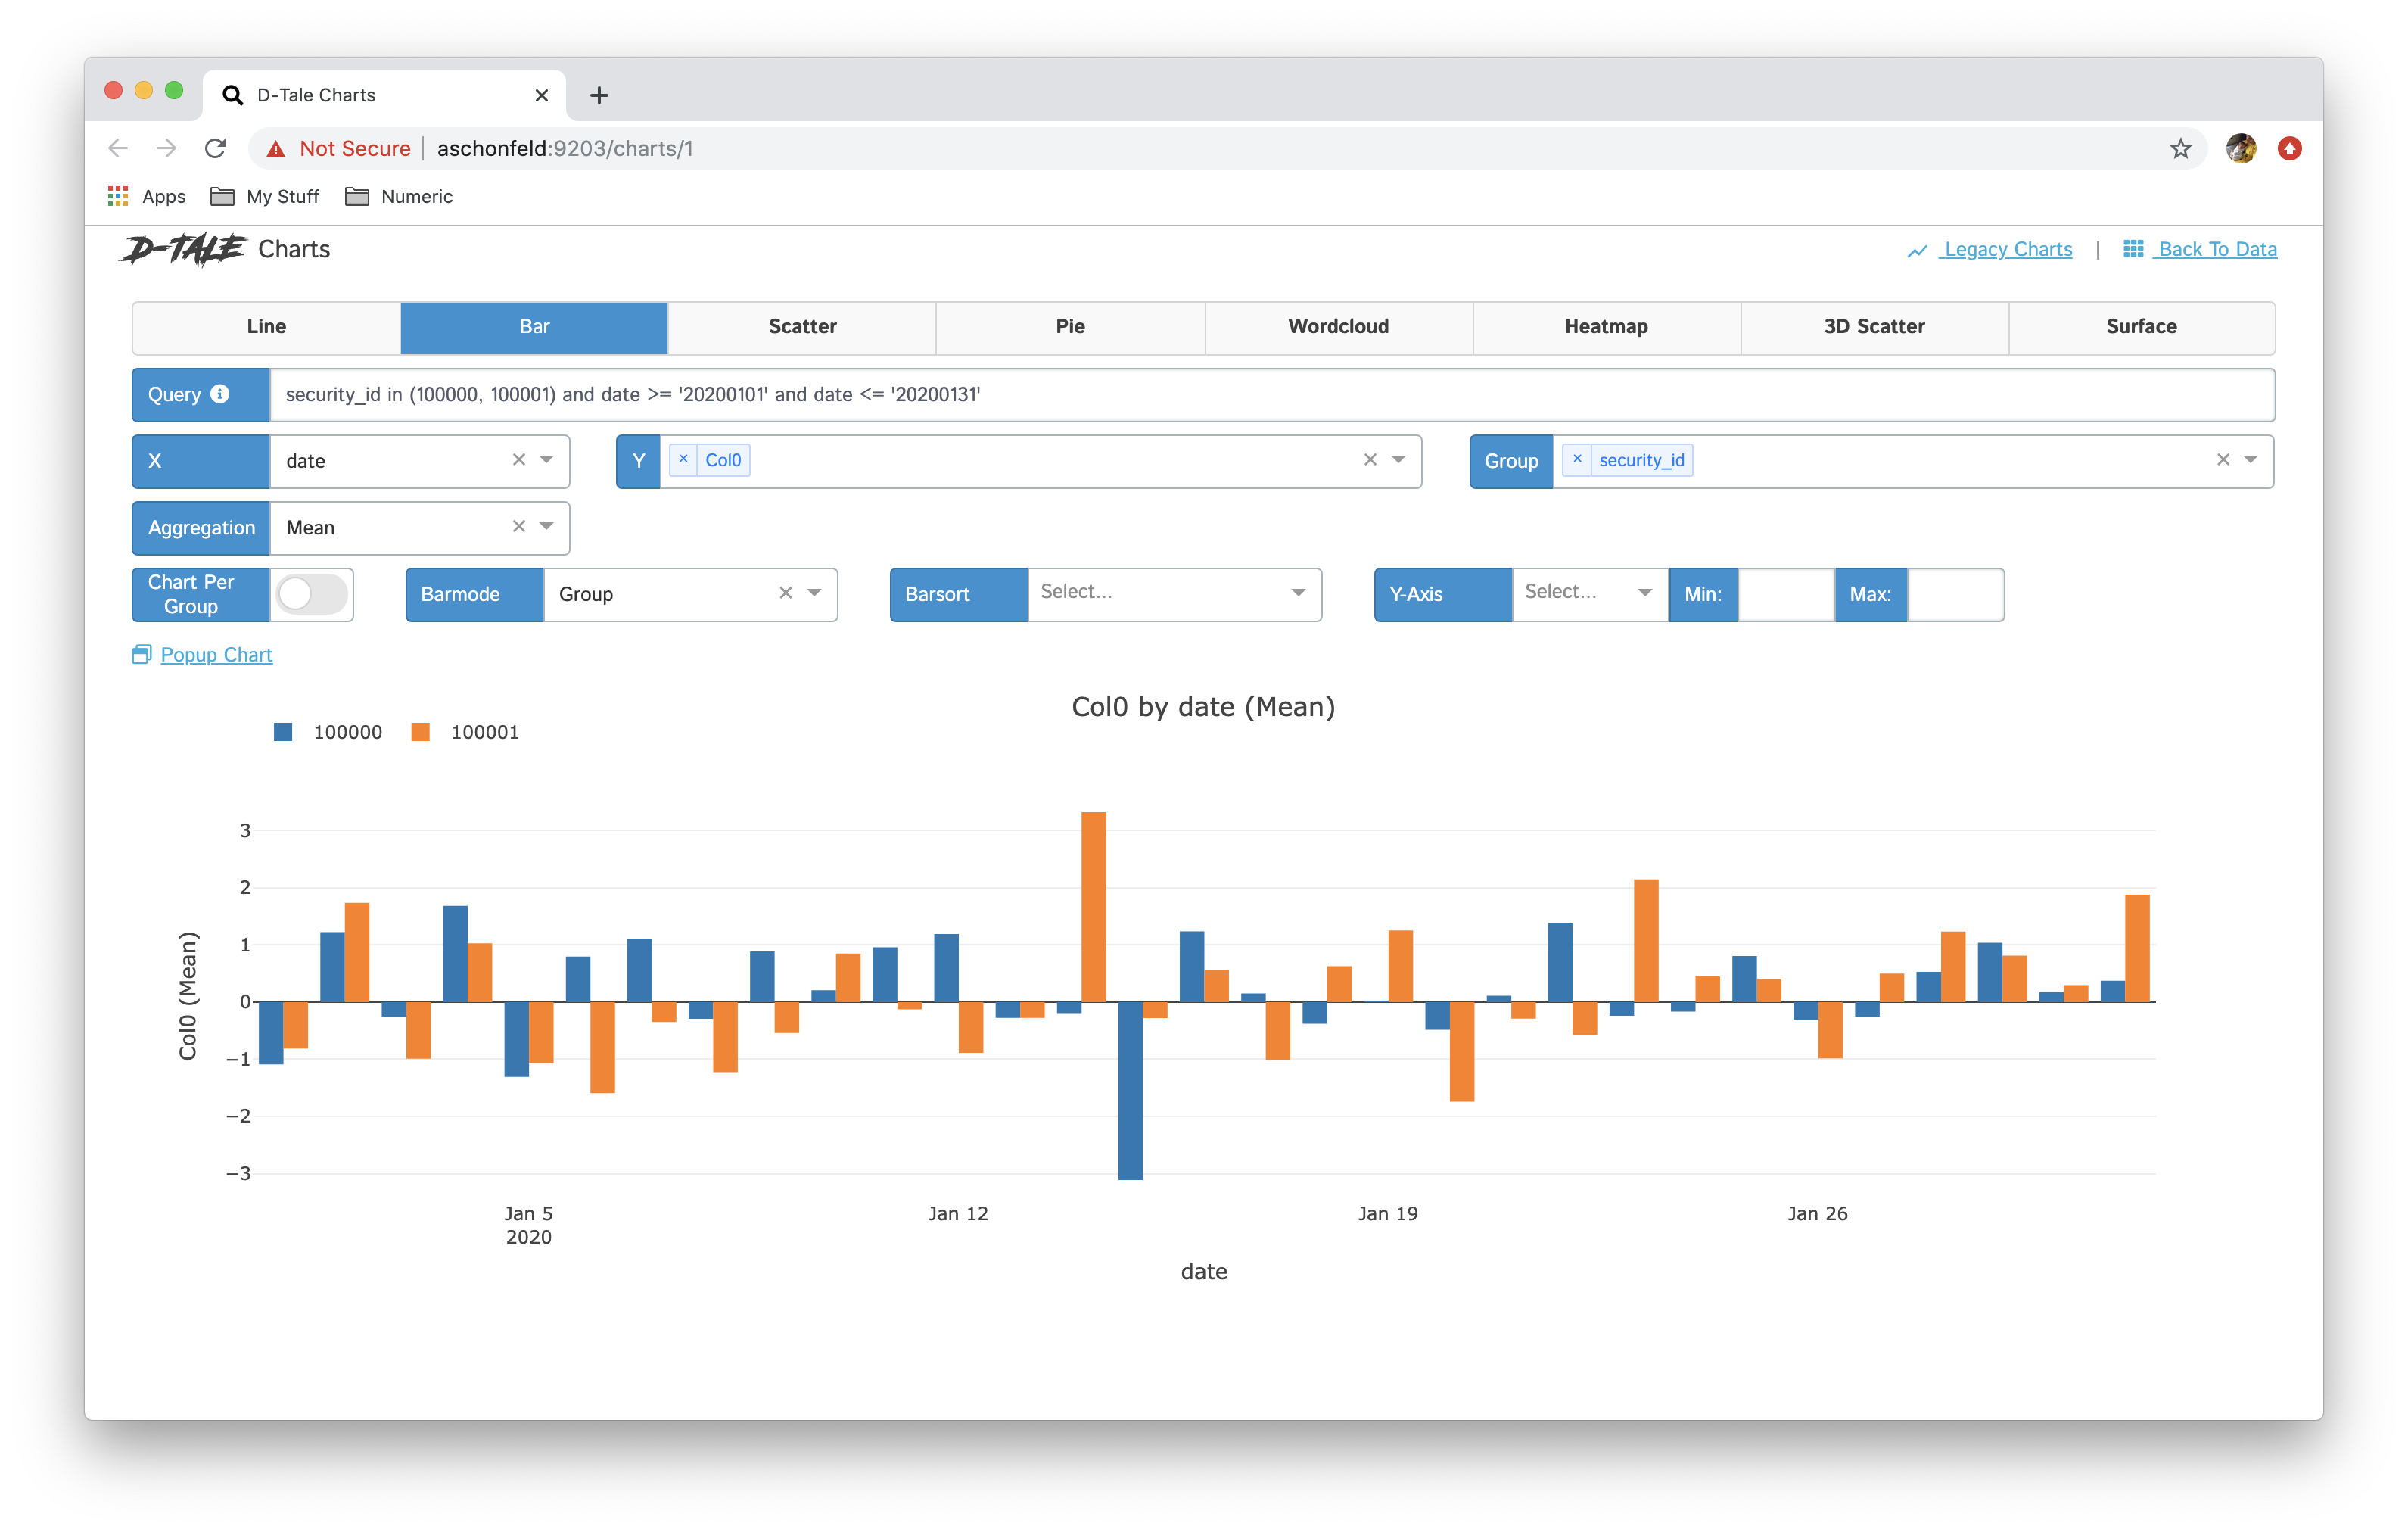 |  |
| stacked | 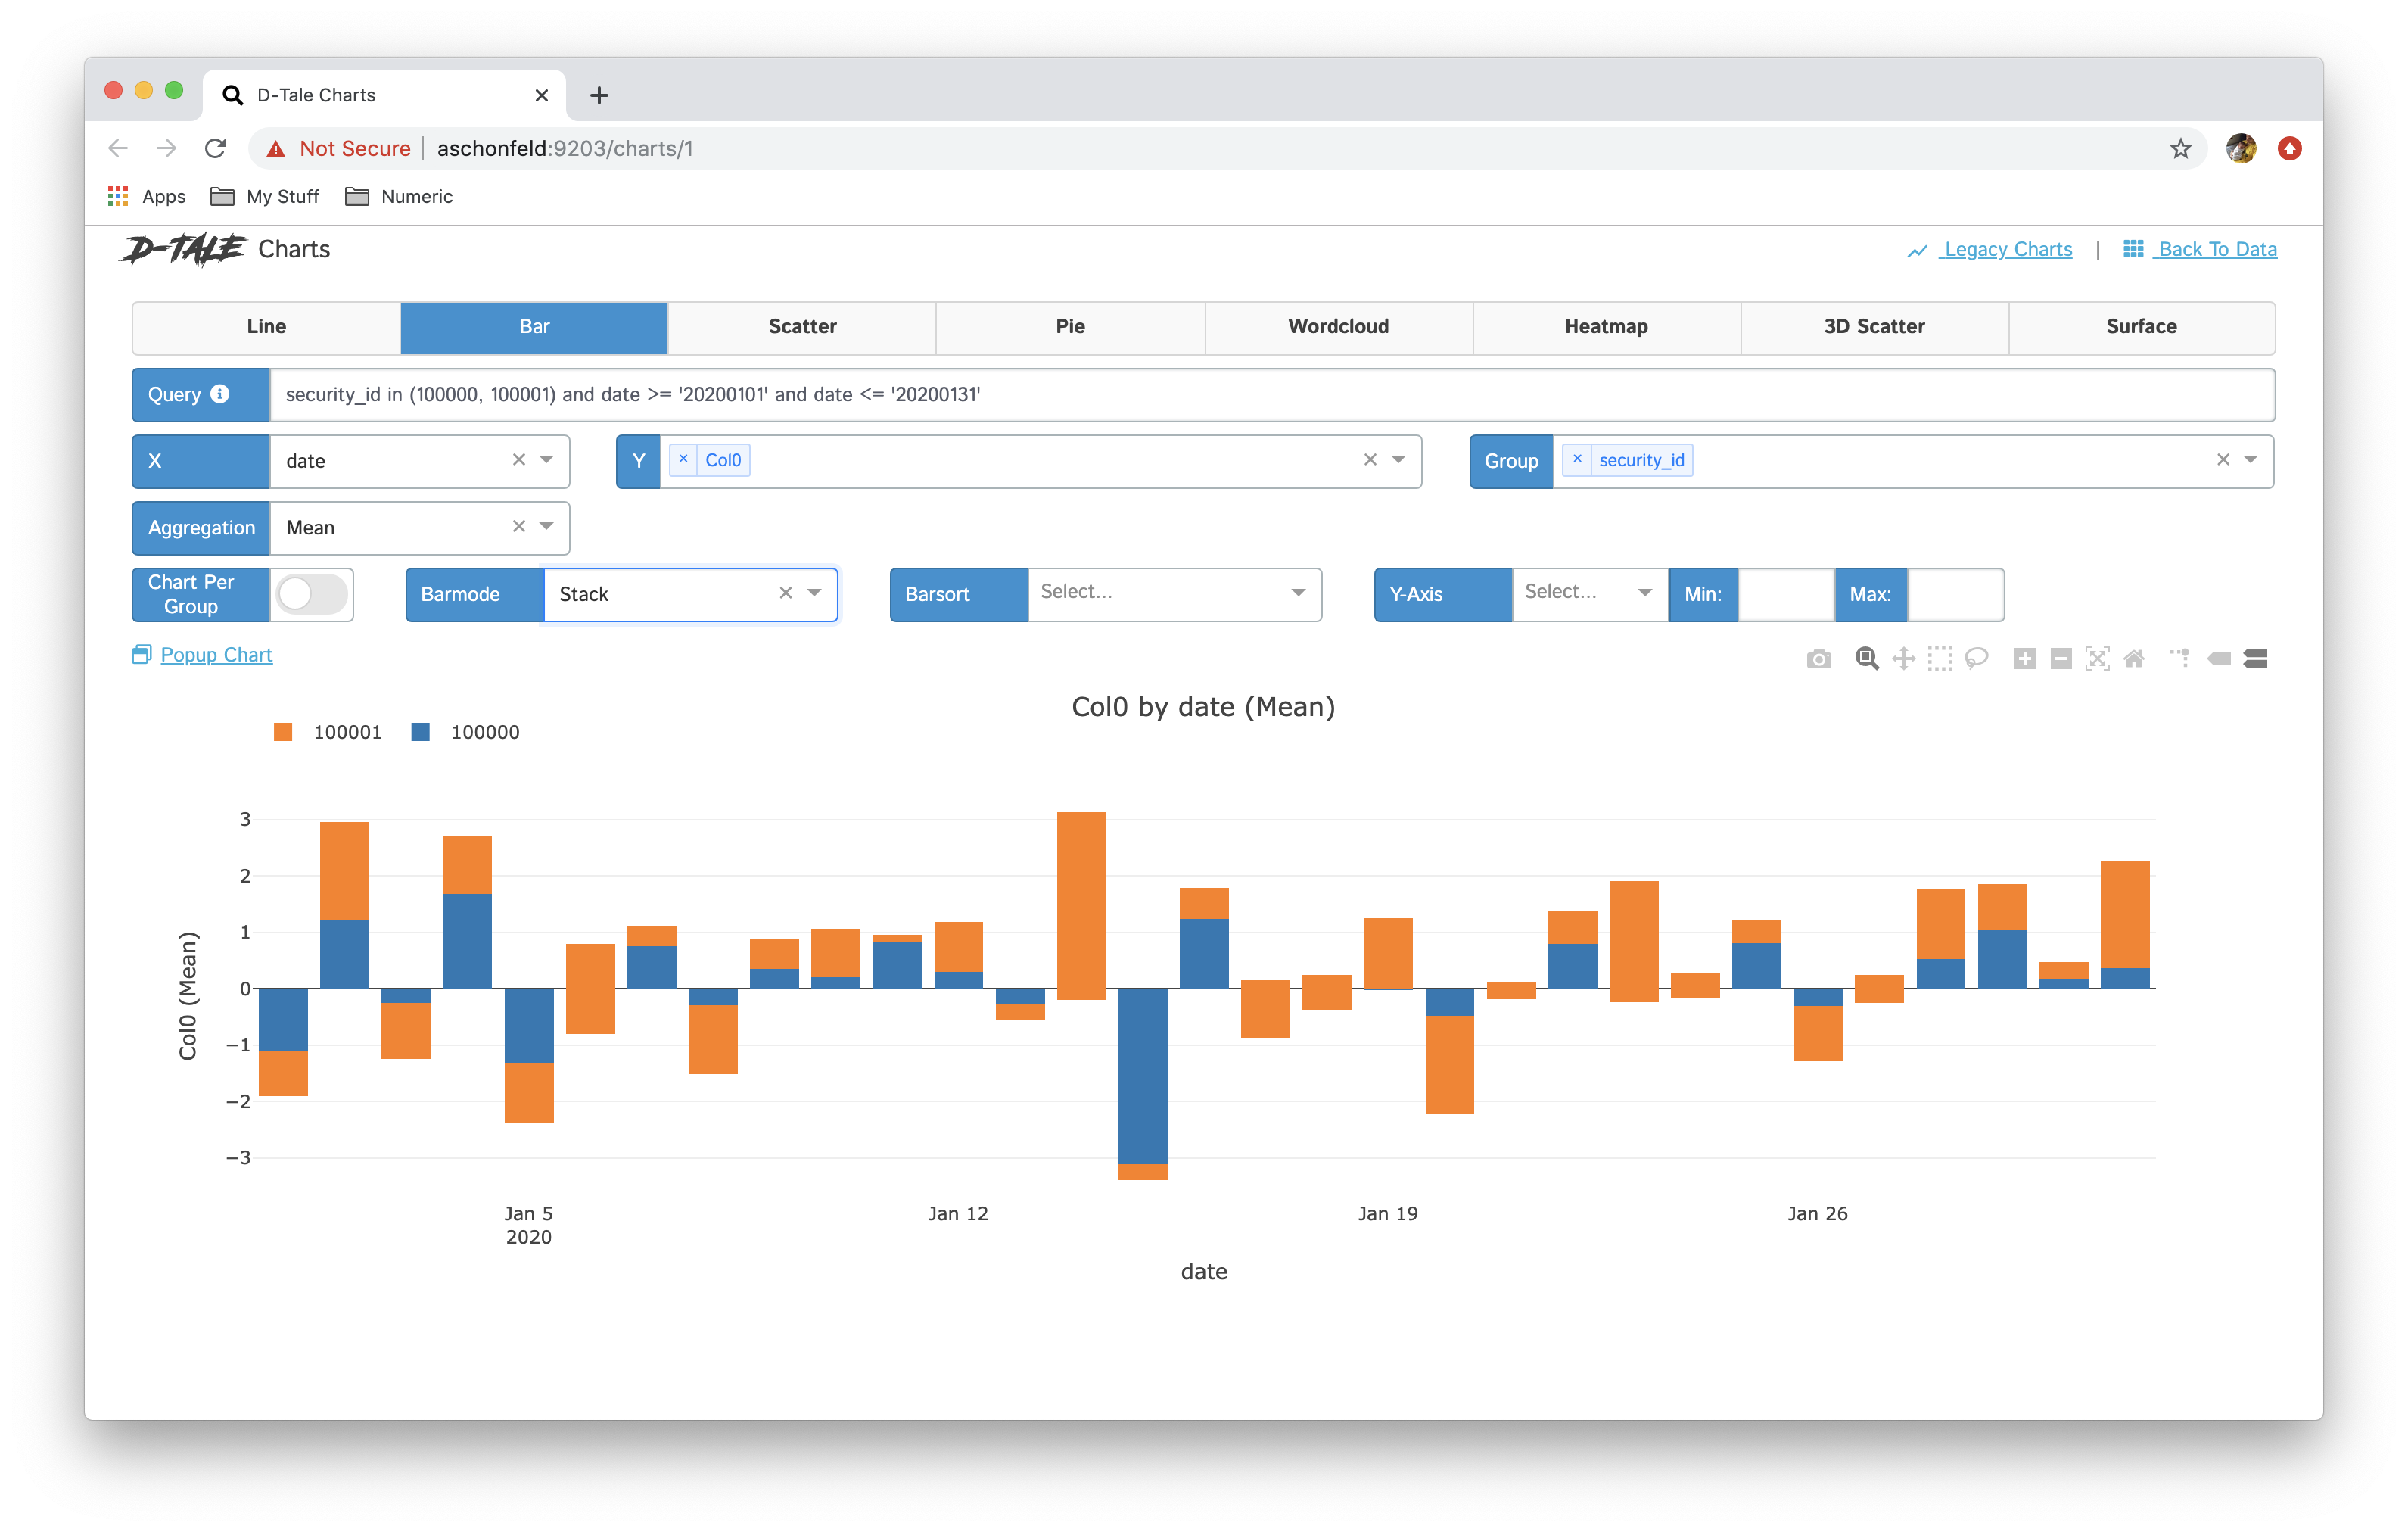 | 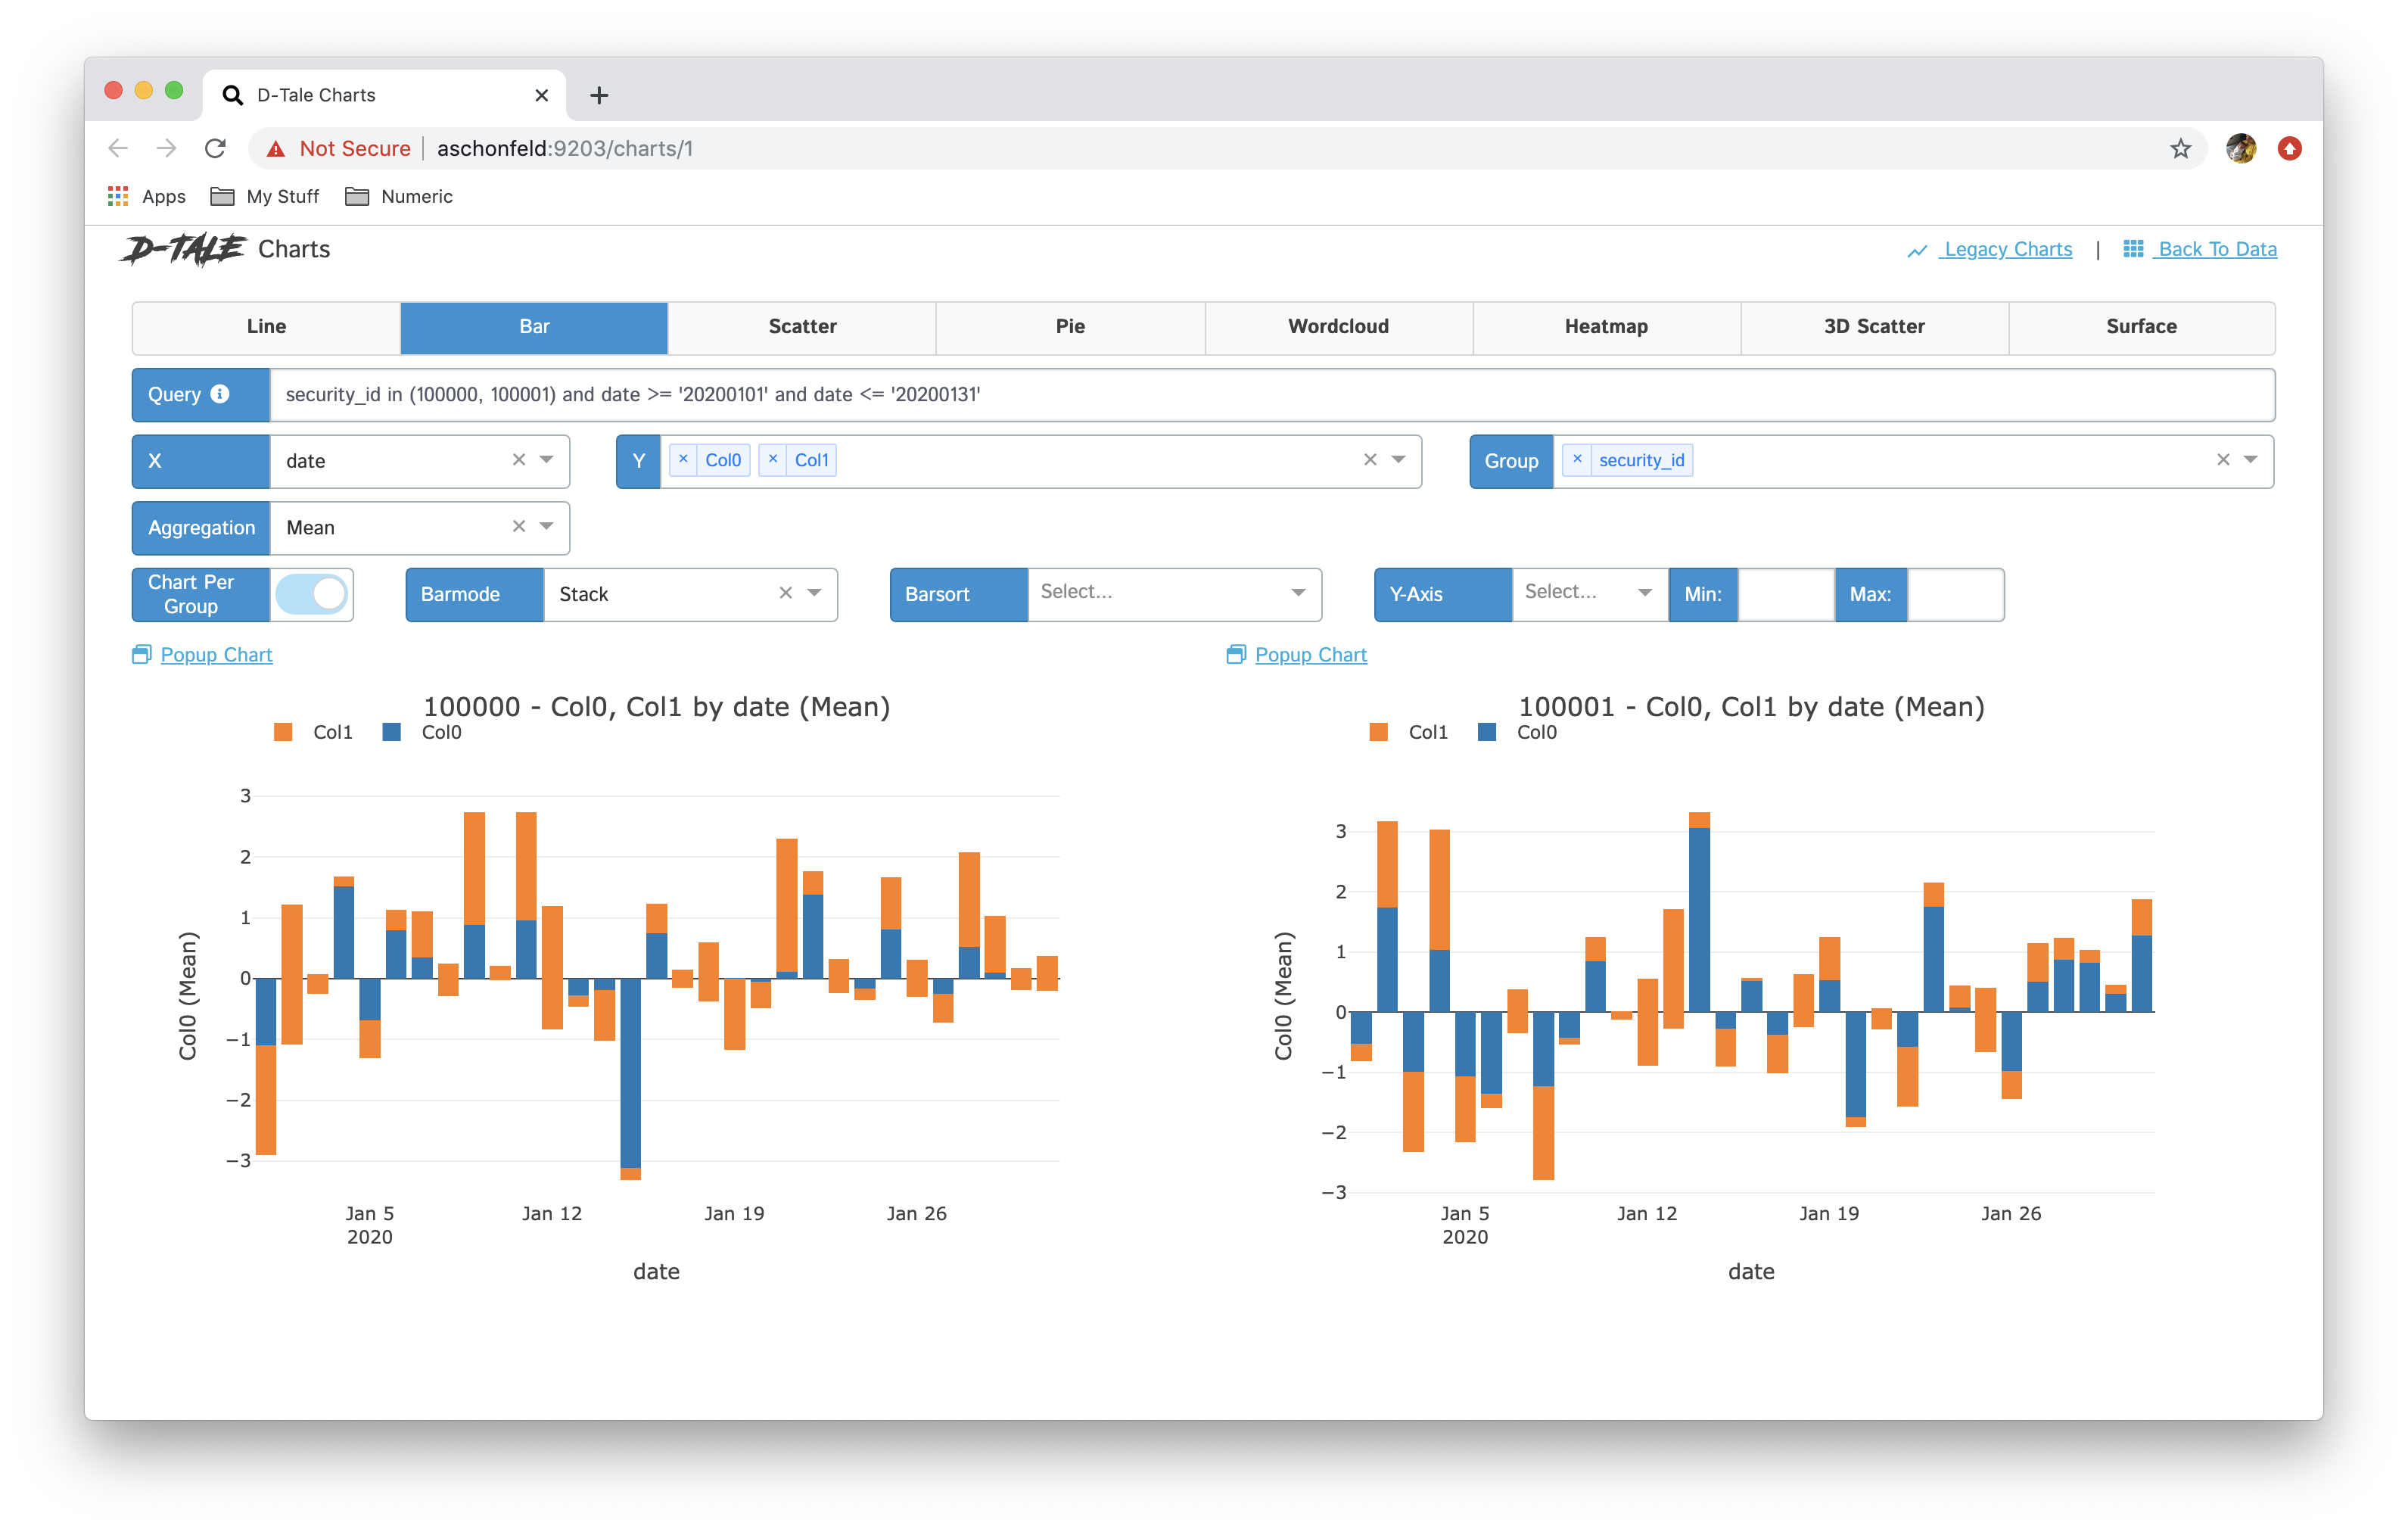 |
| pie | 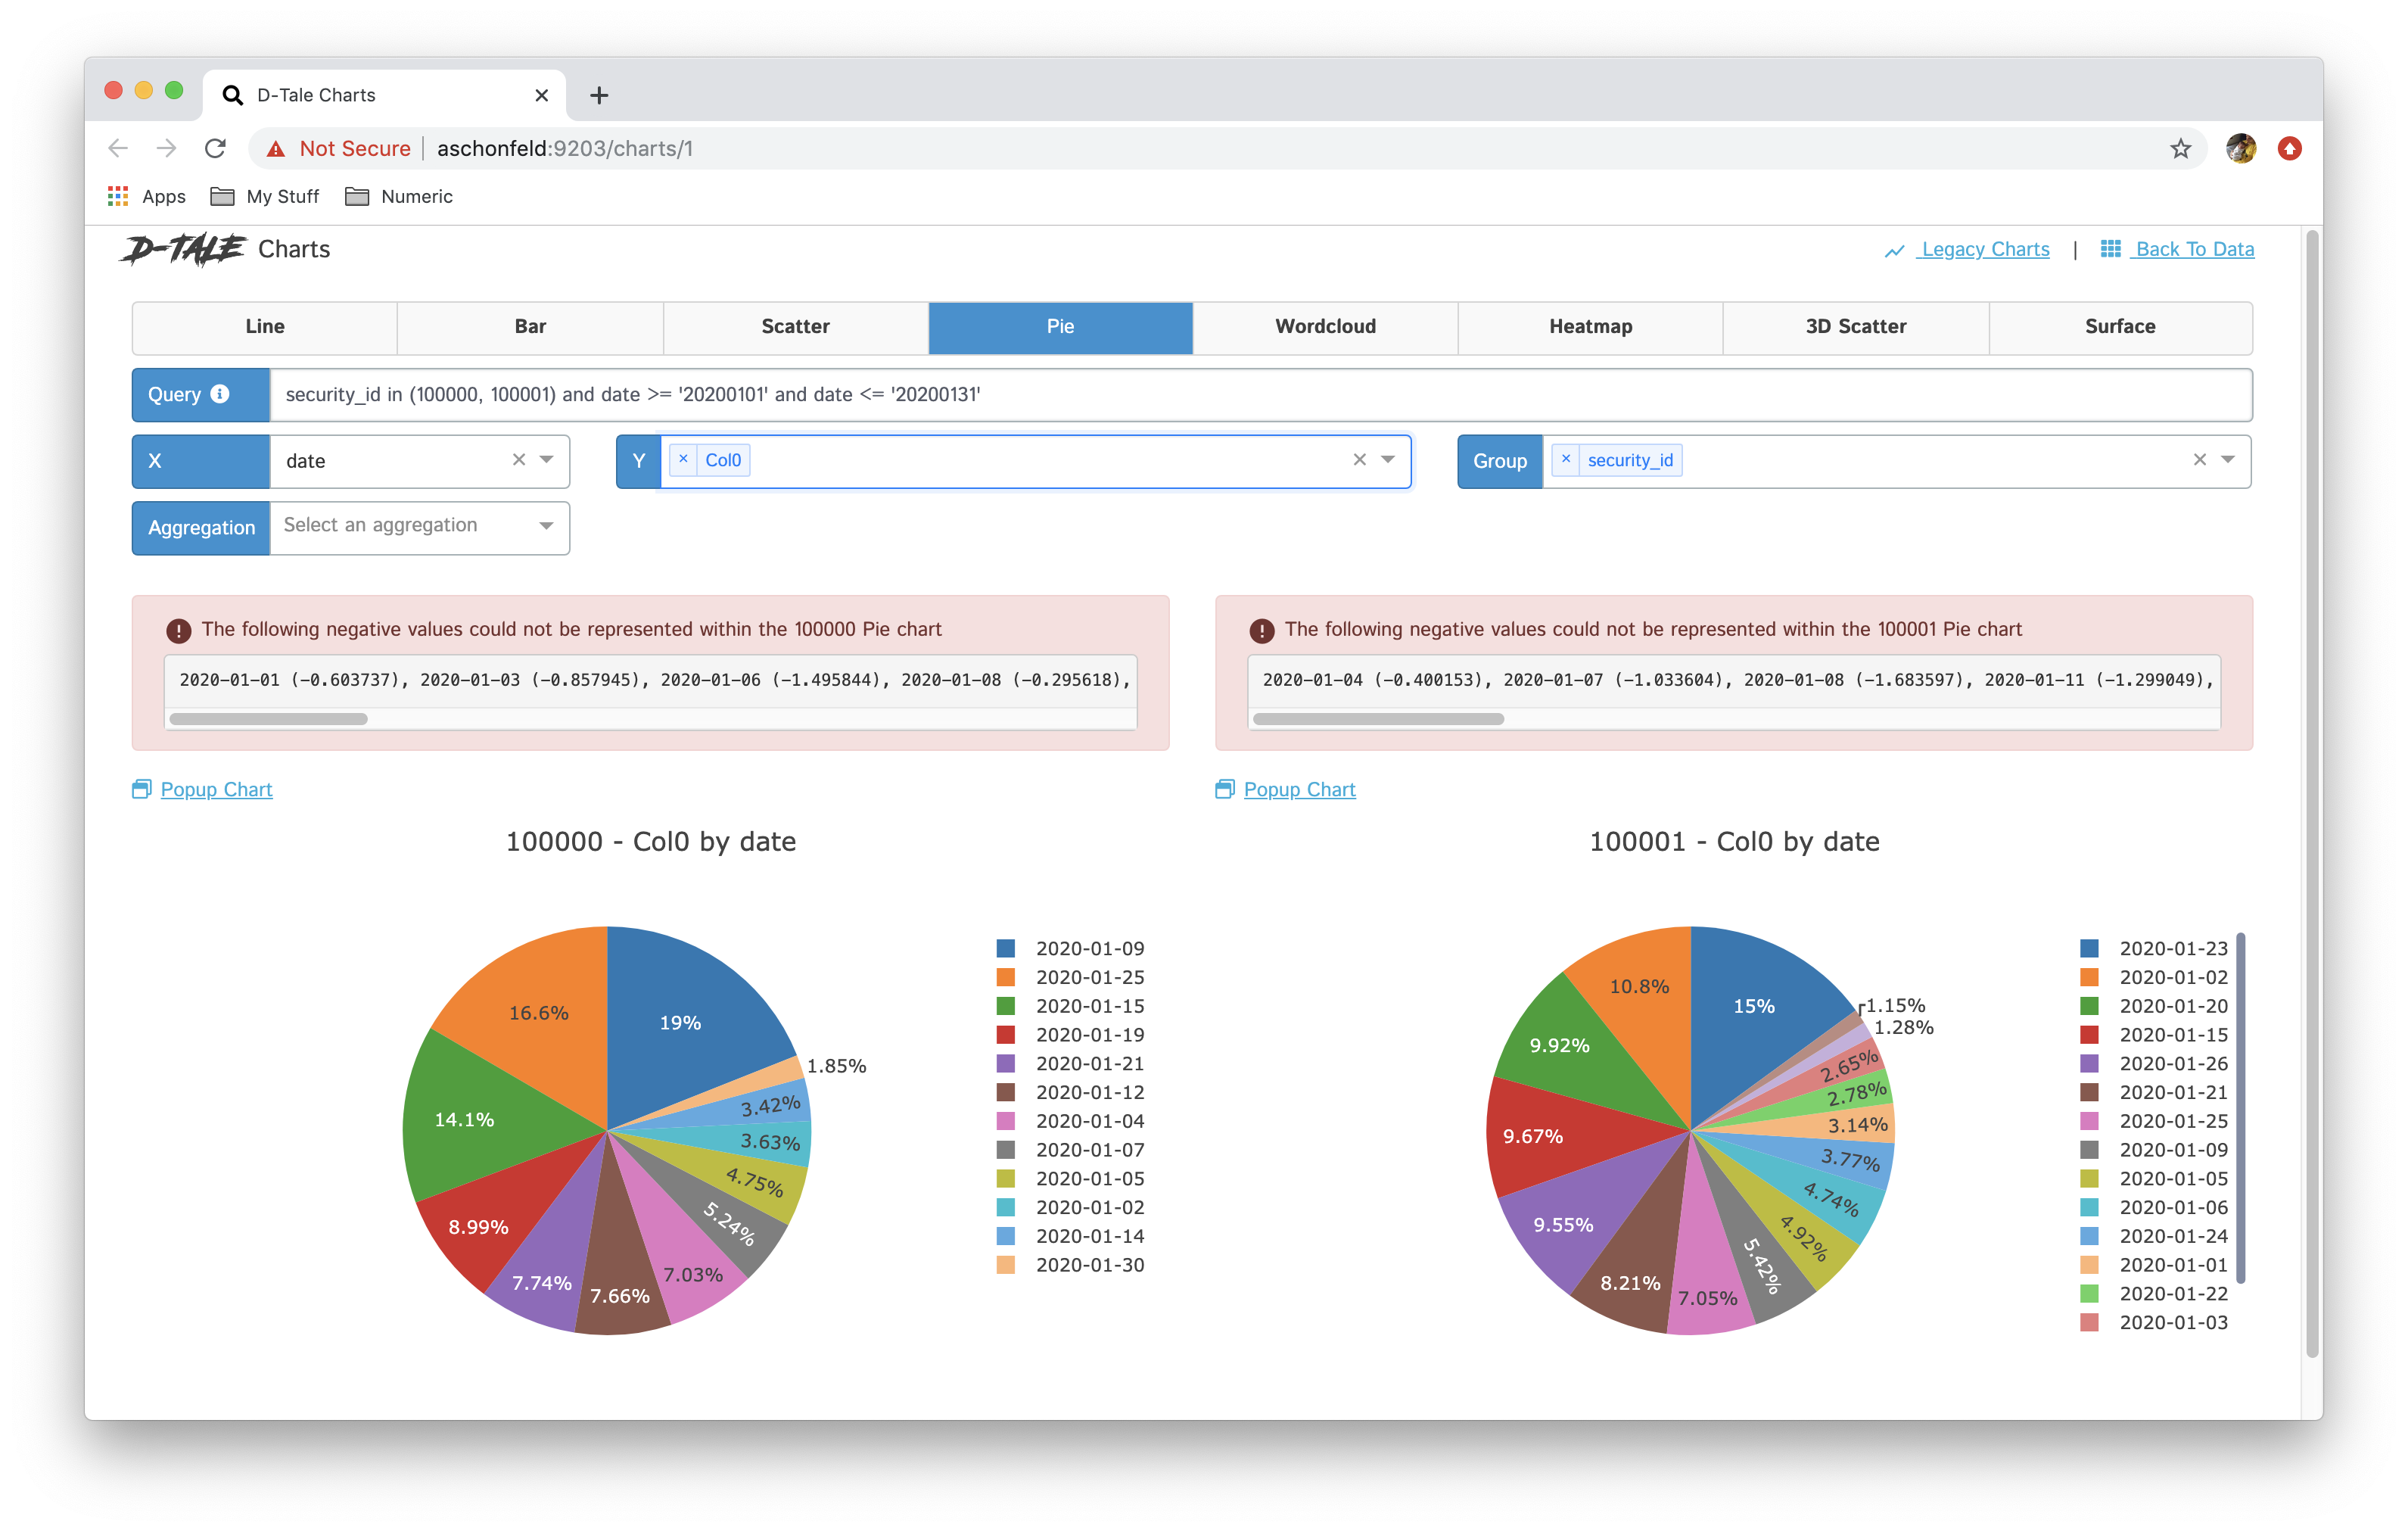 | |
| wordcloud | 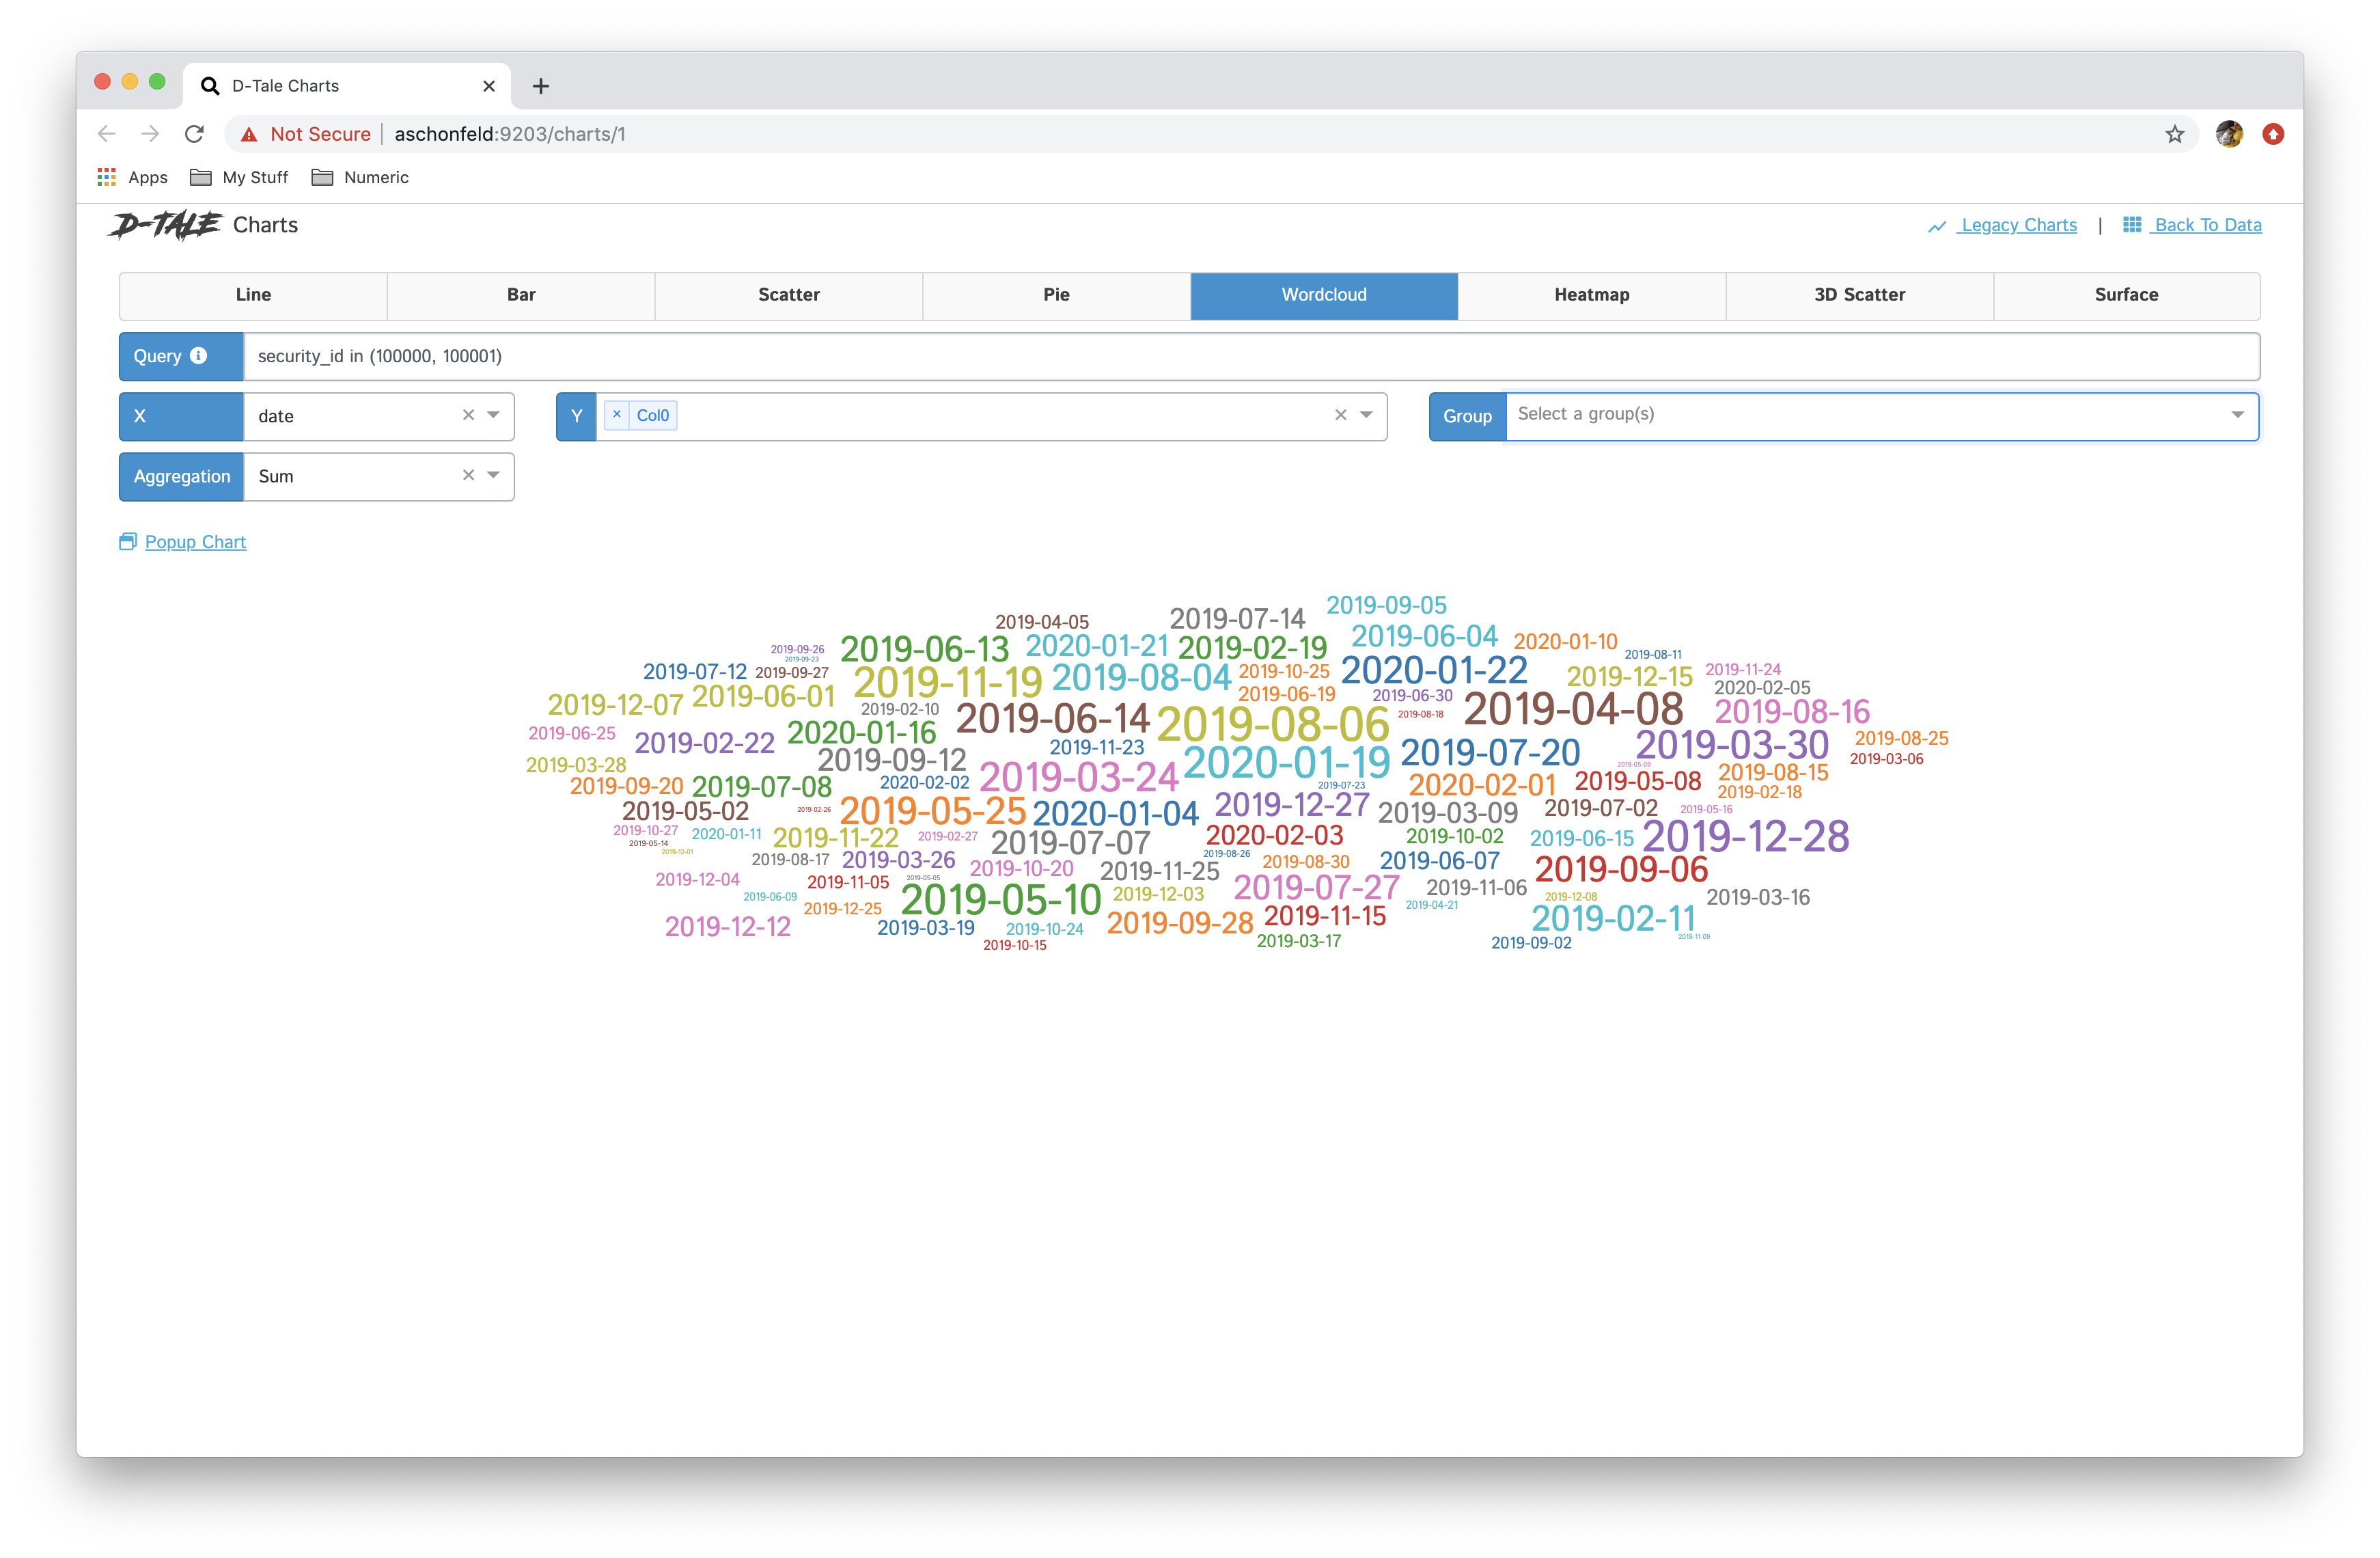 | 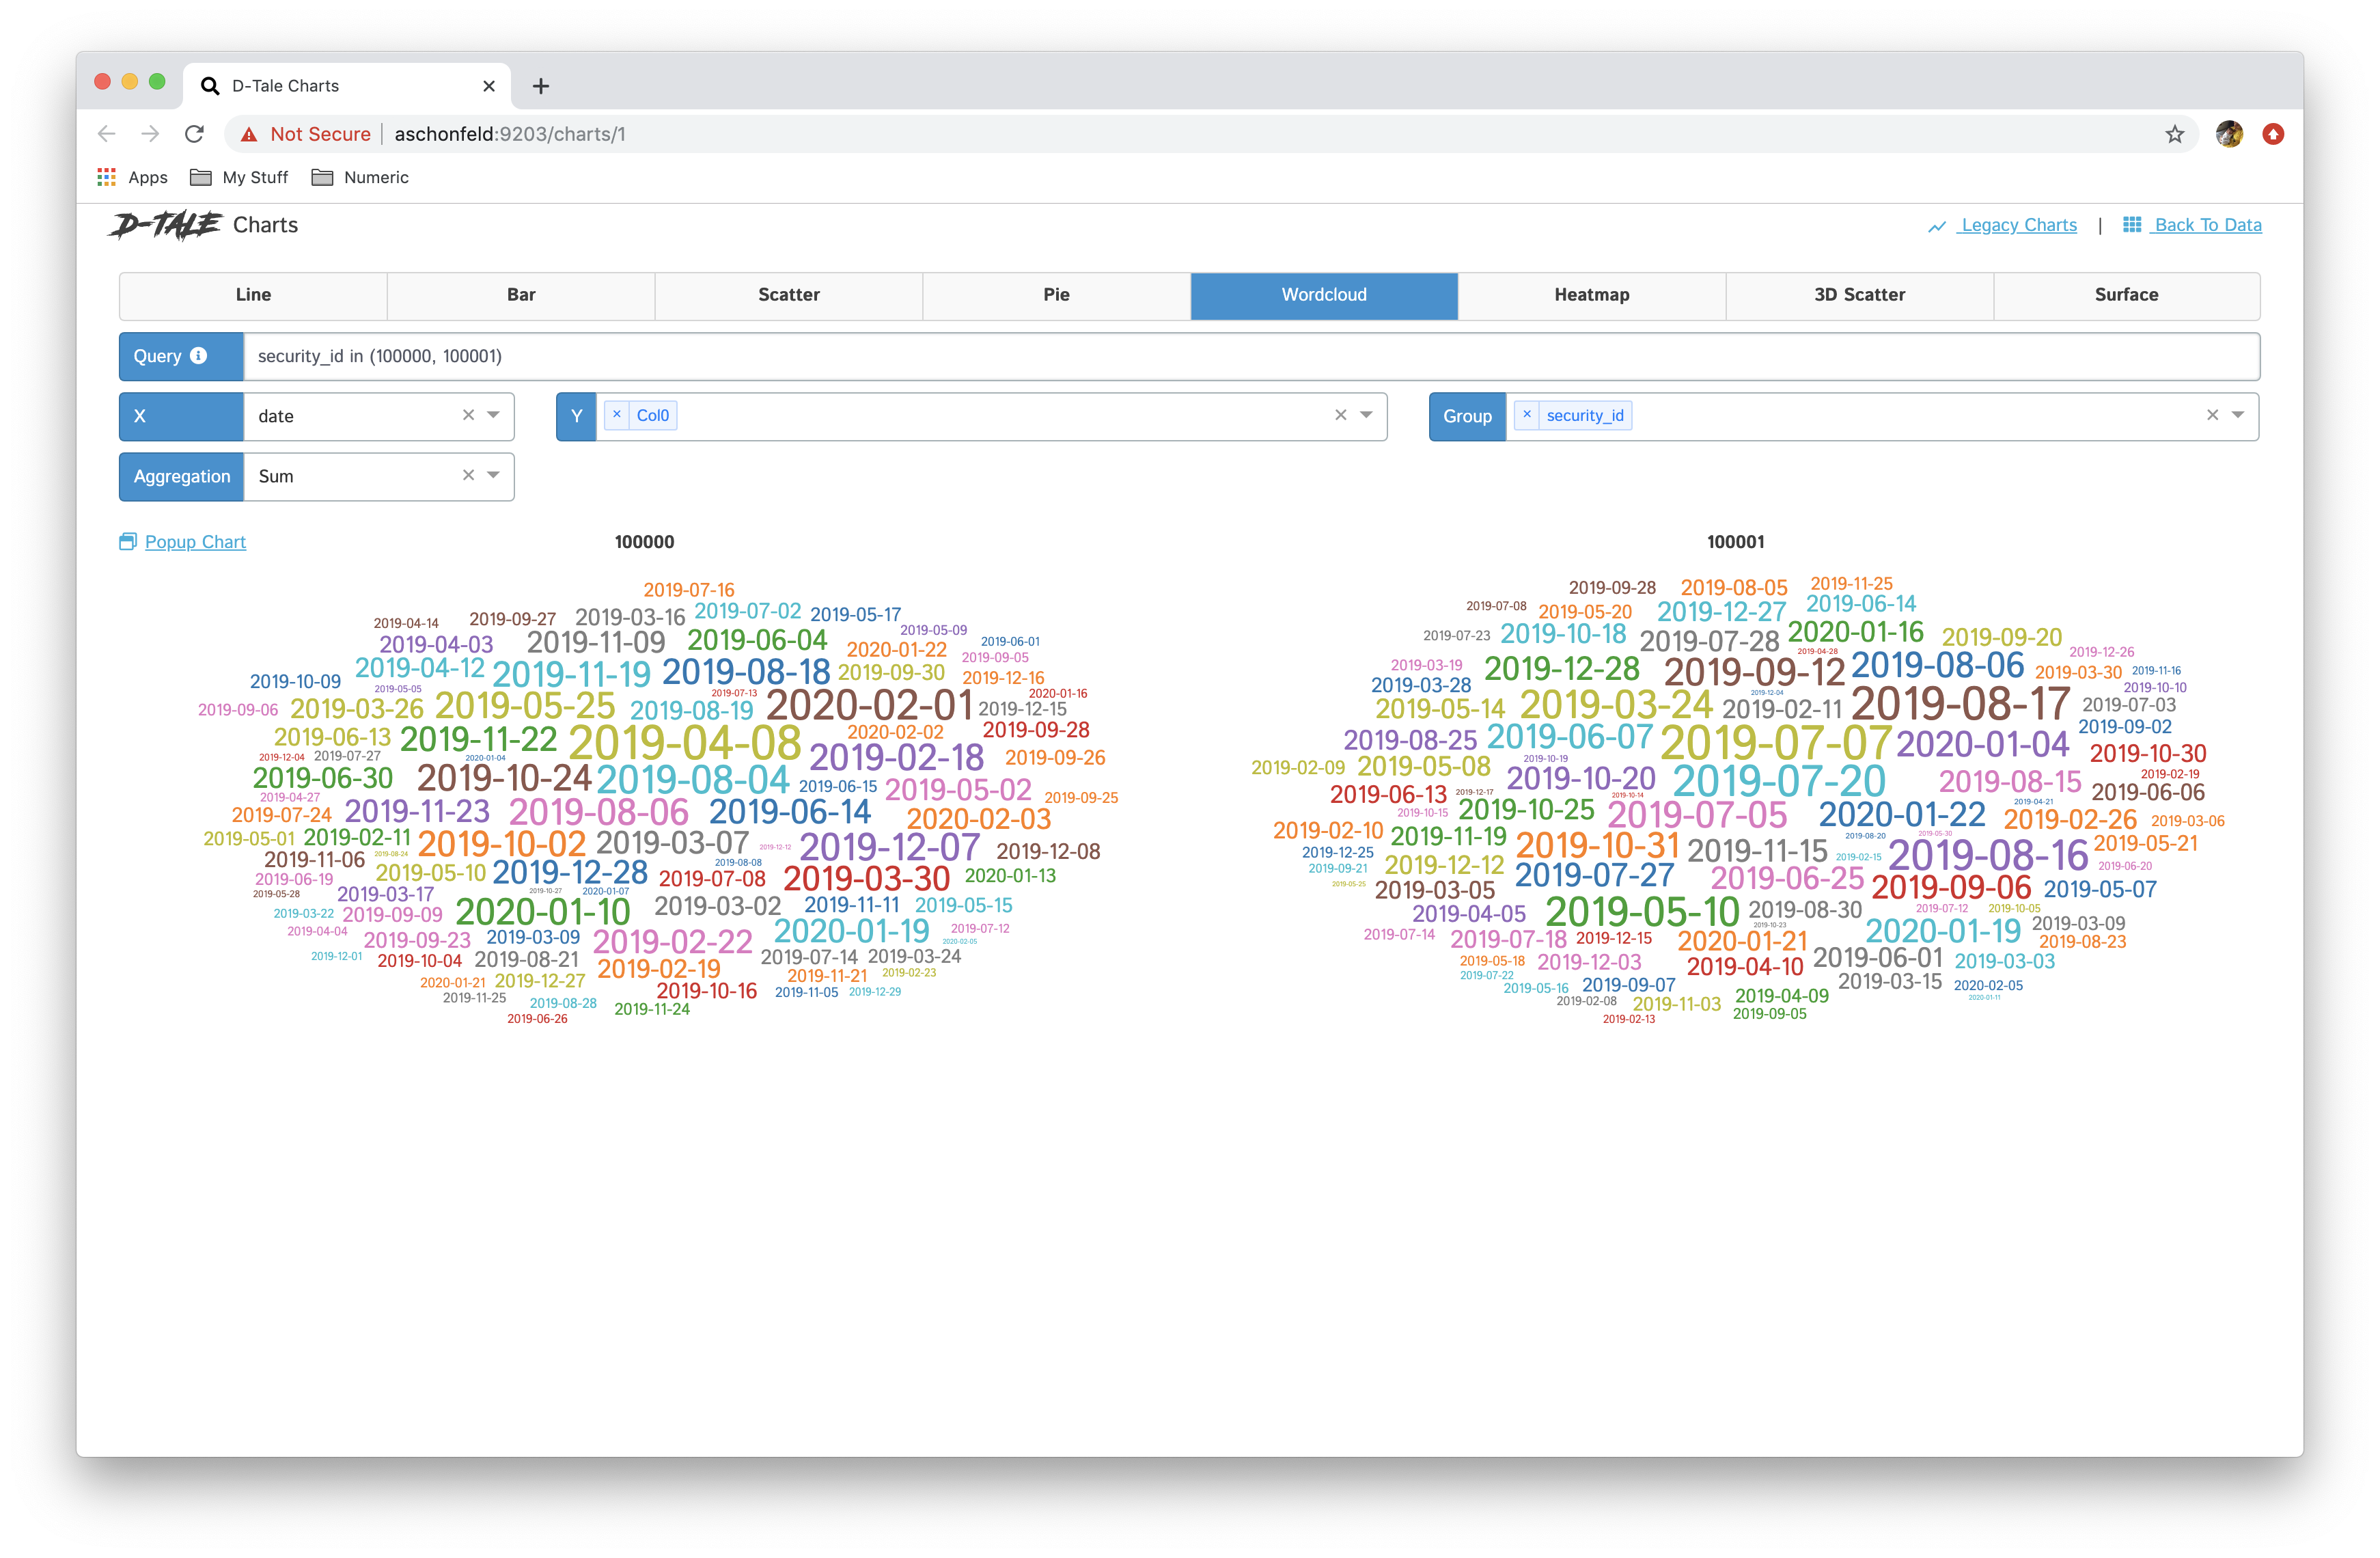 |
| heatmap | 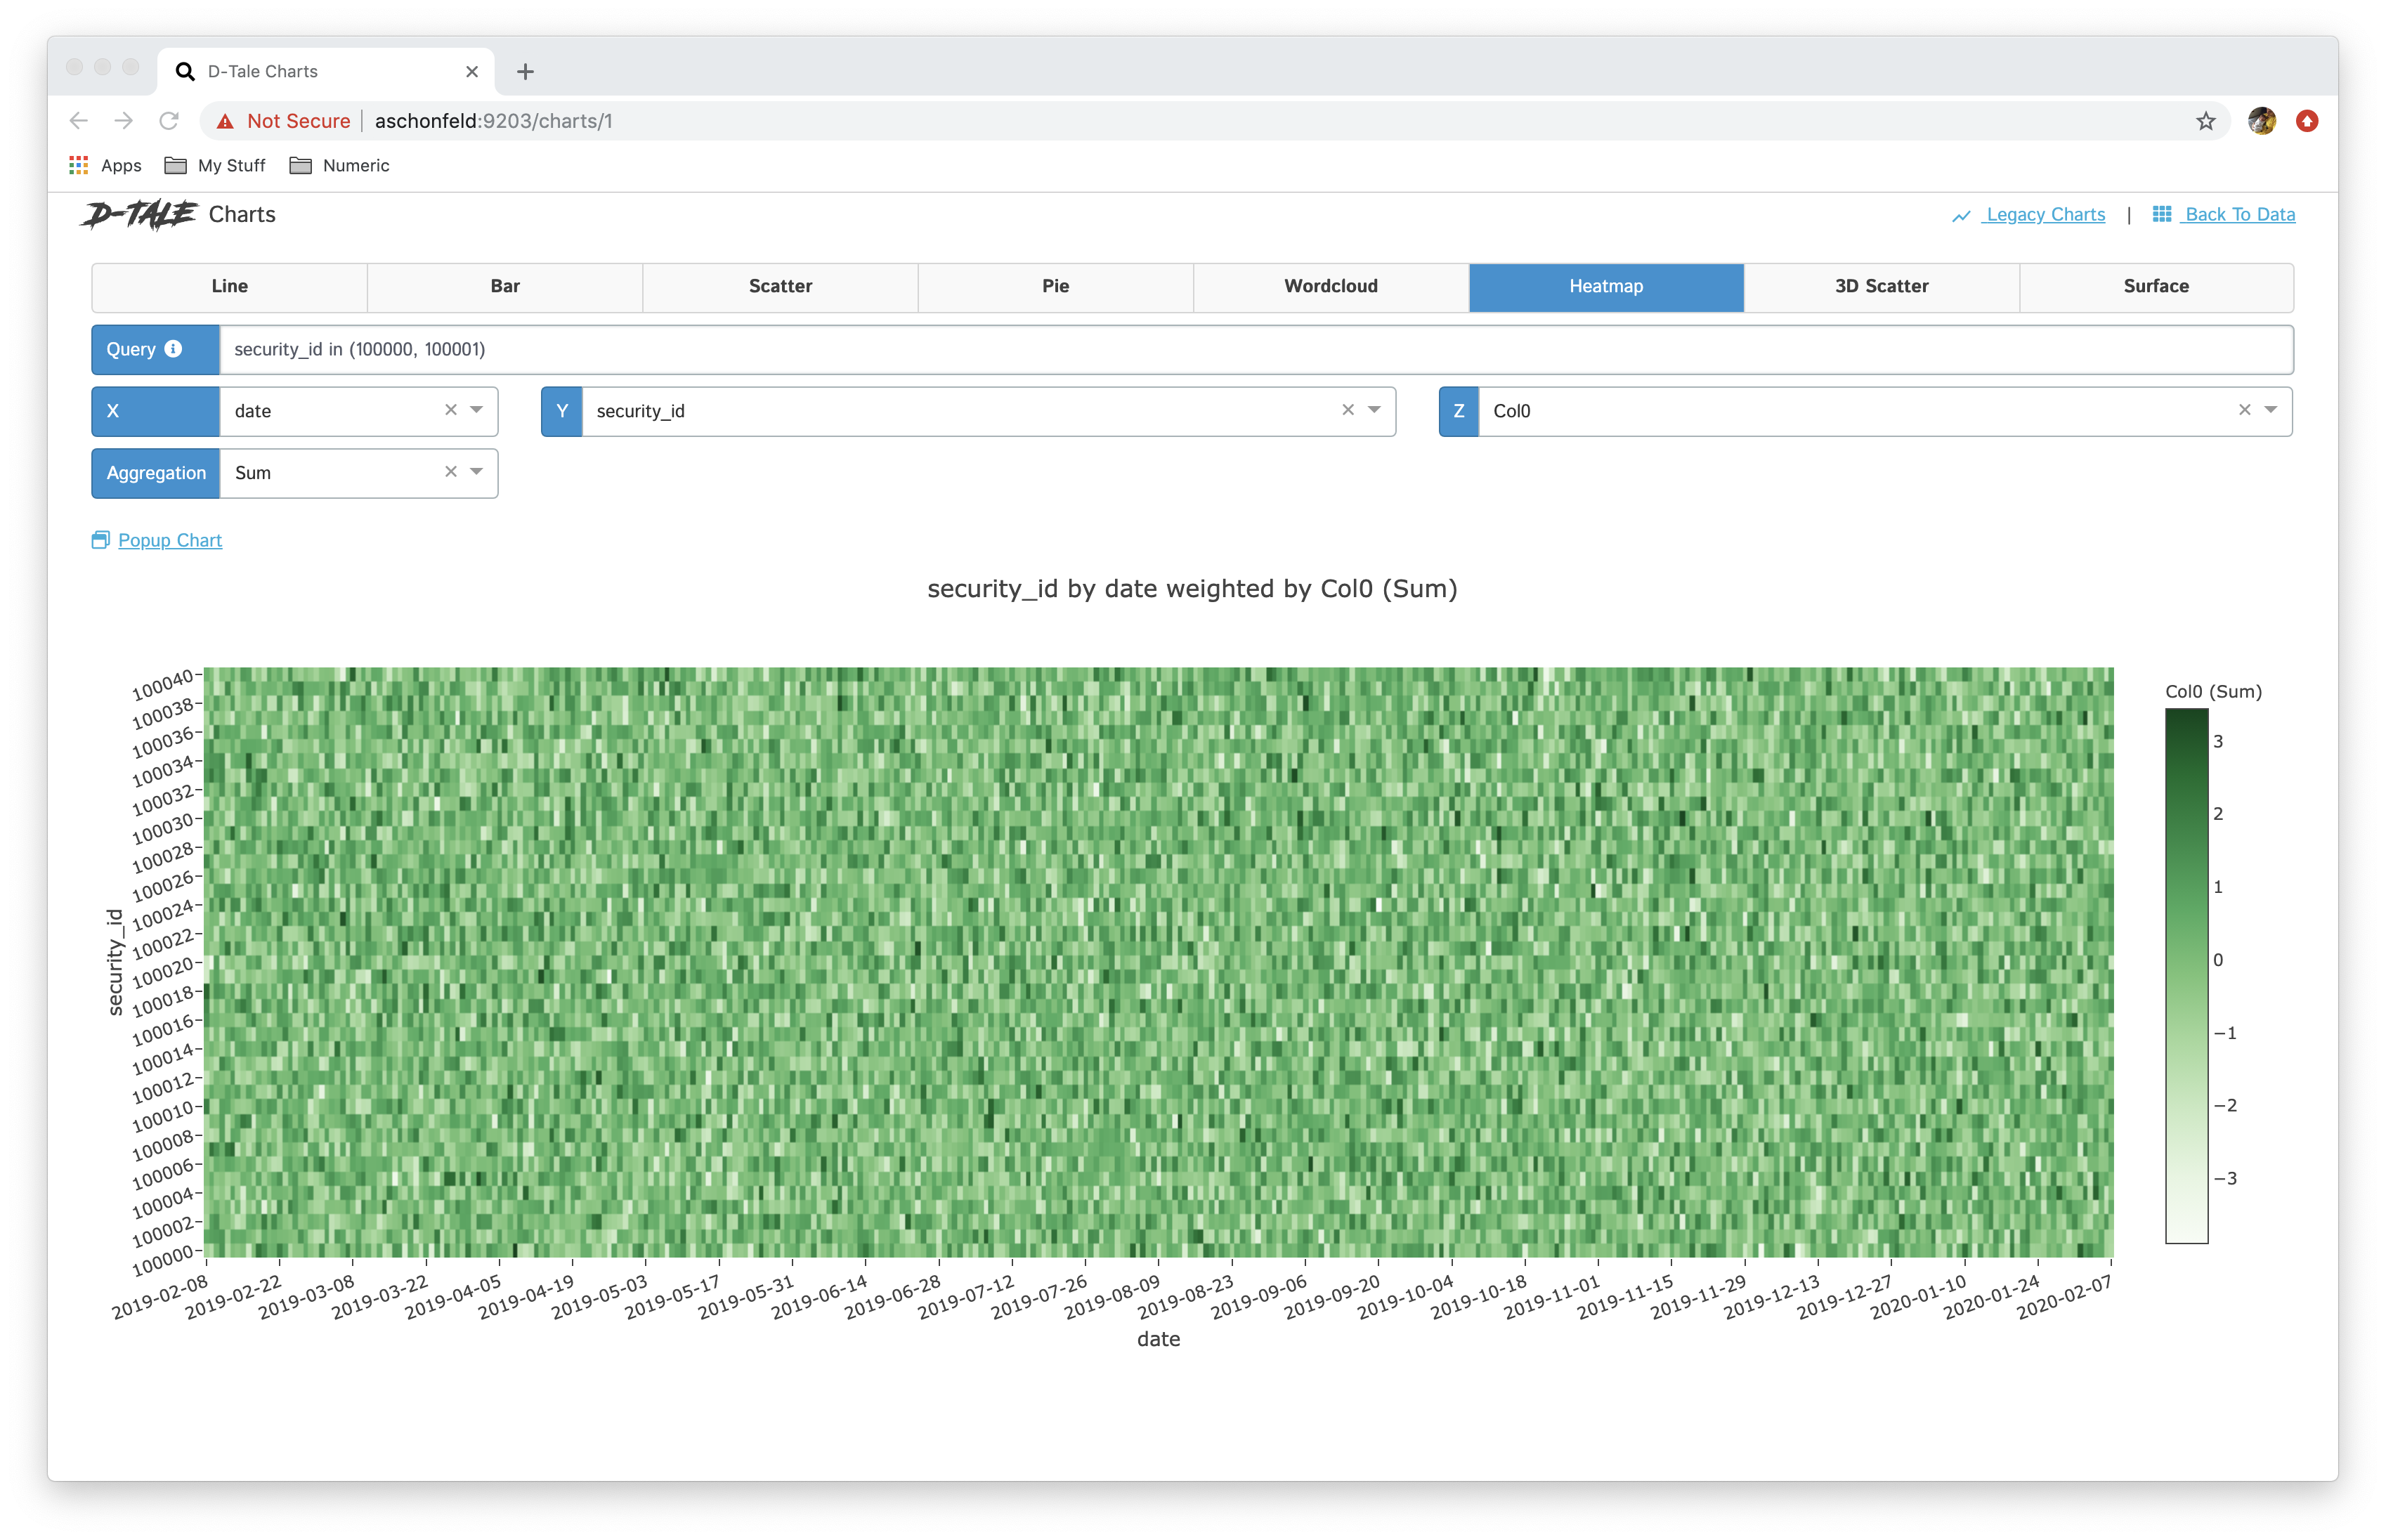 | |
| 3D scatter |  | |
| surface | 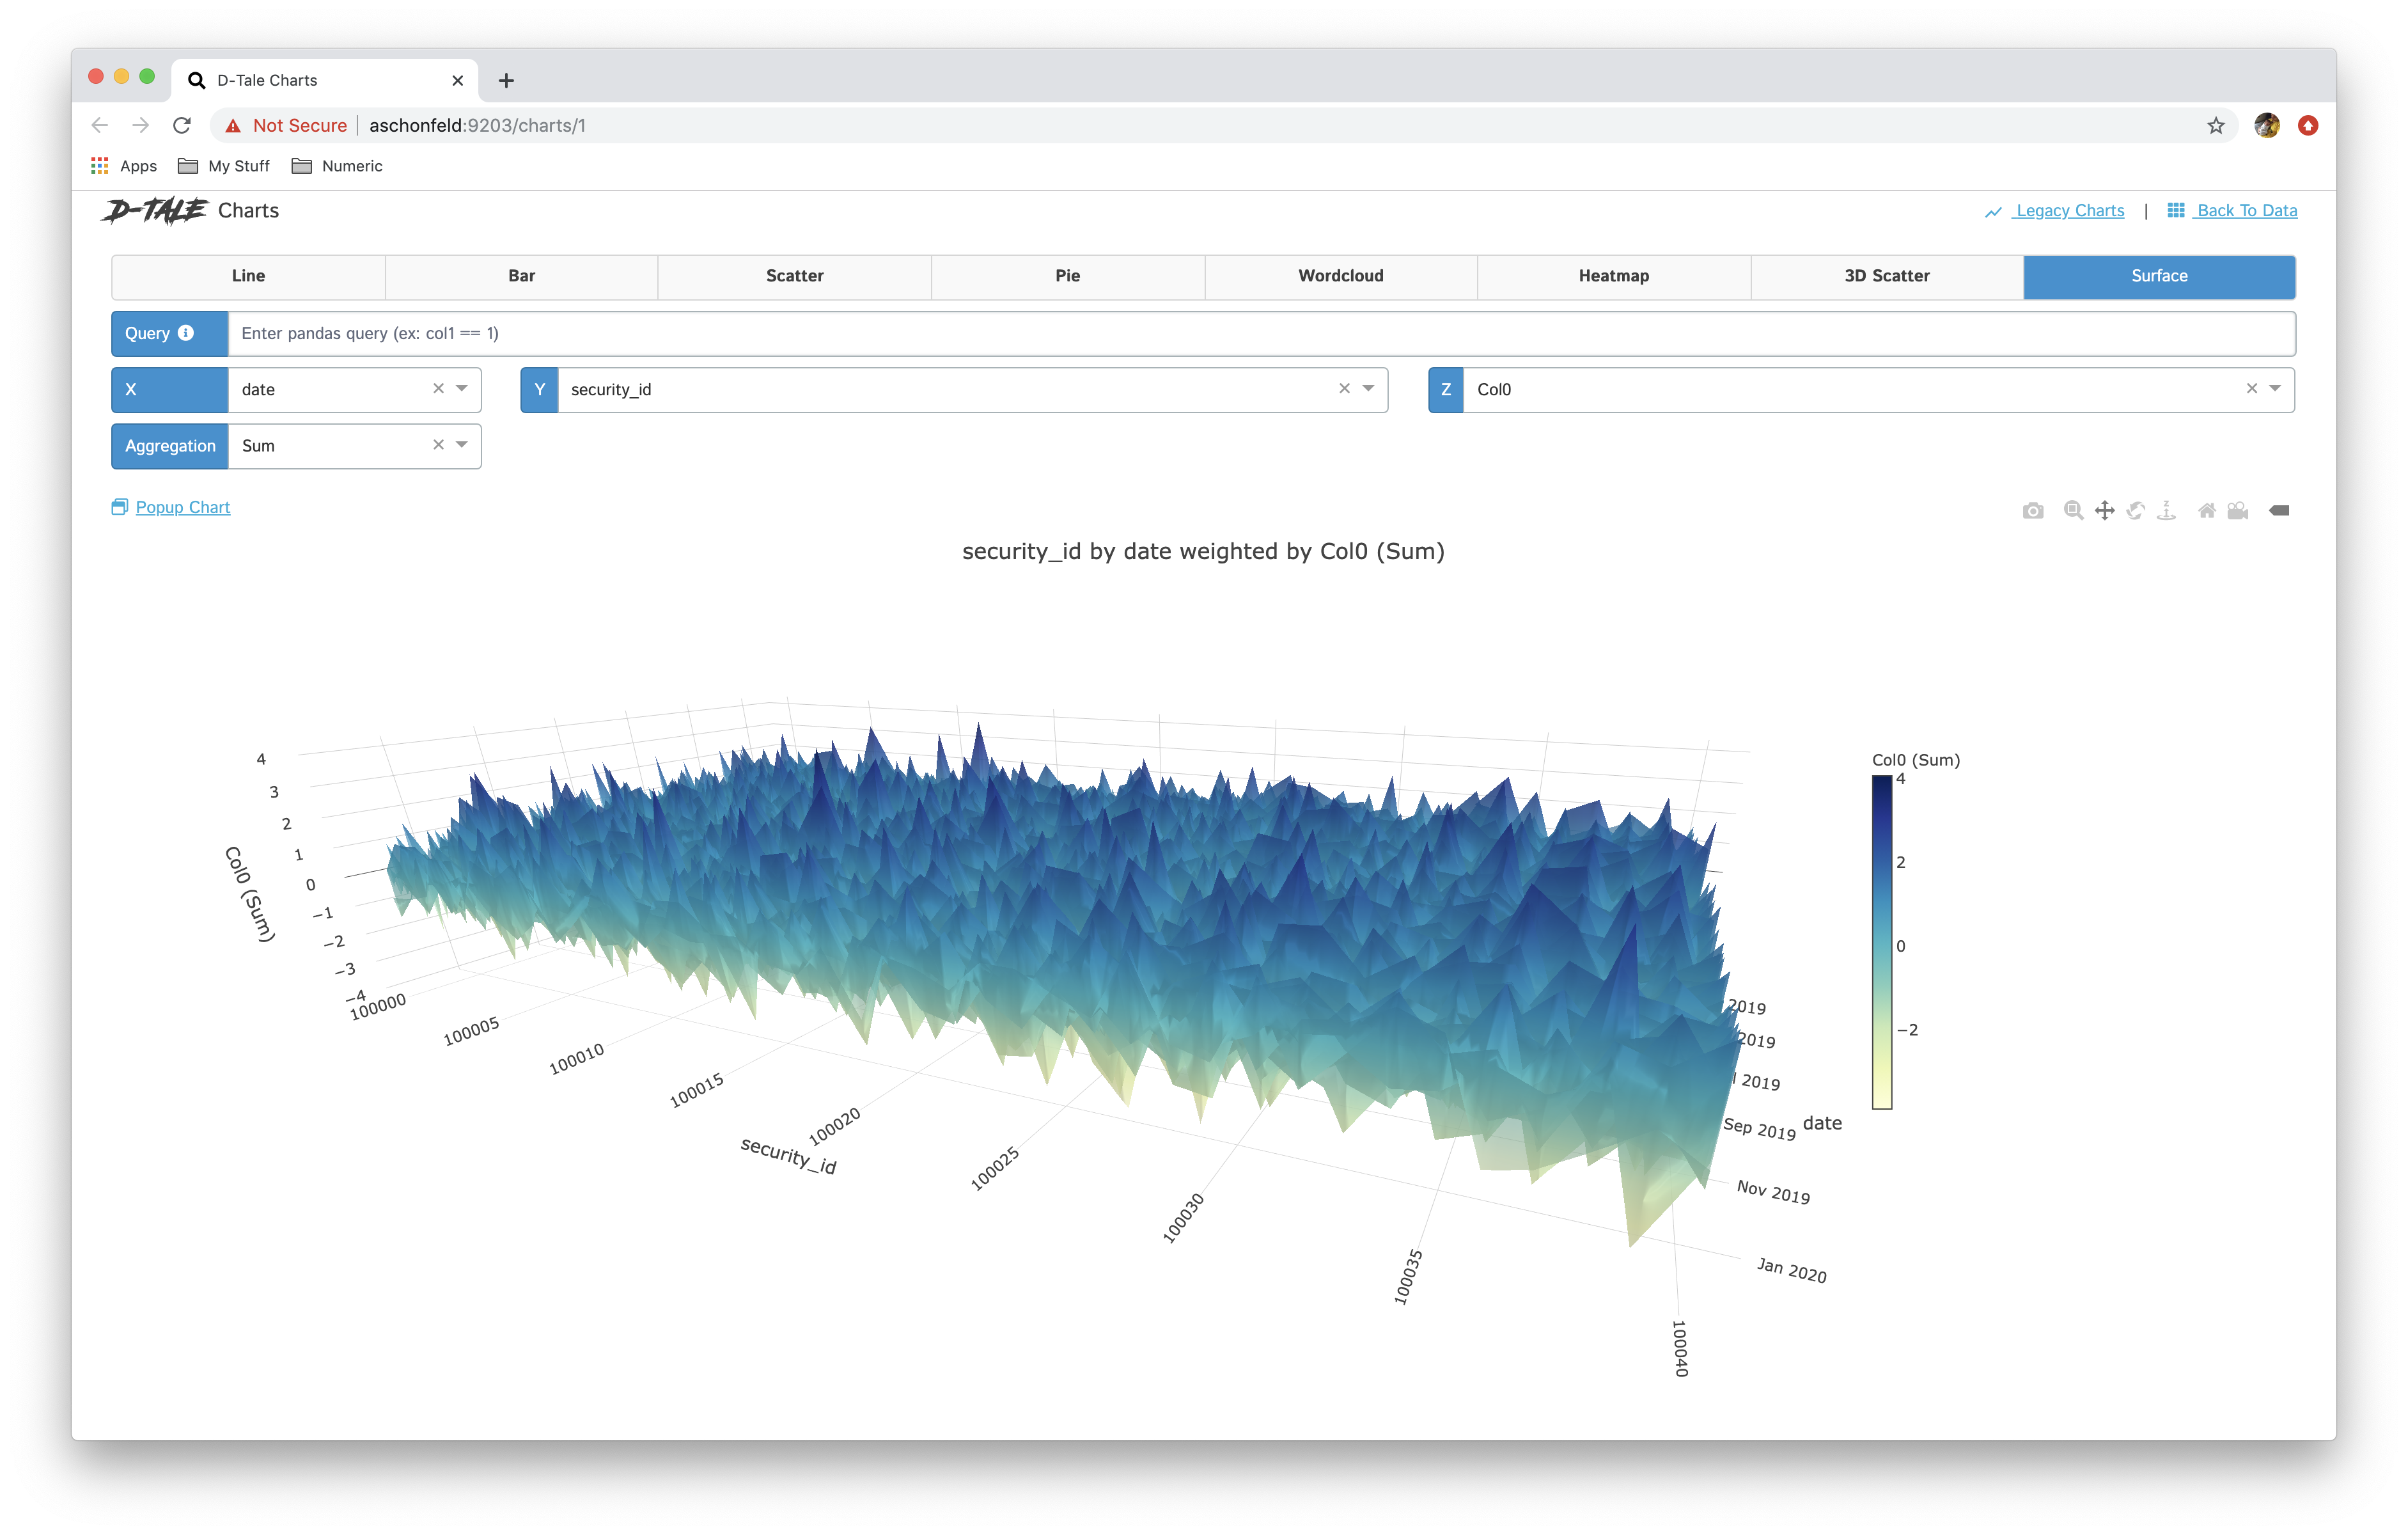 | |
| Maps (Scatter GEO) |  | |
| Maps (Choropleth) | 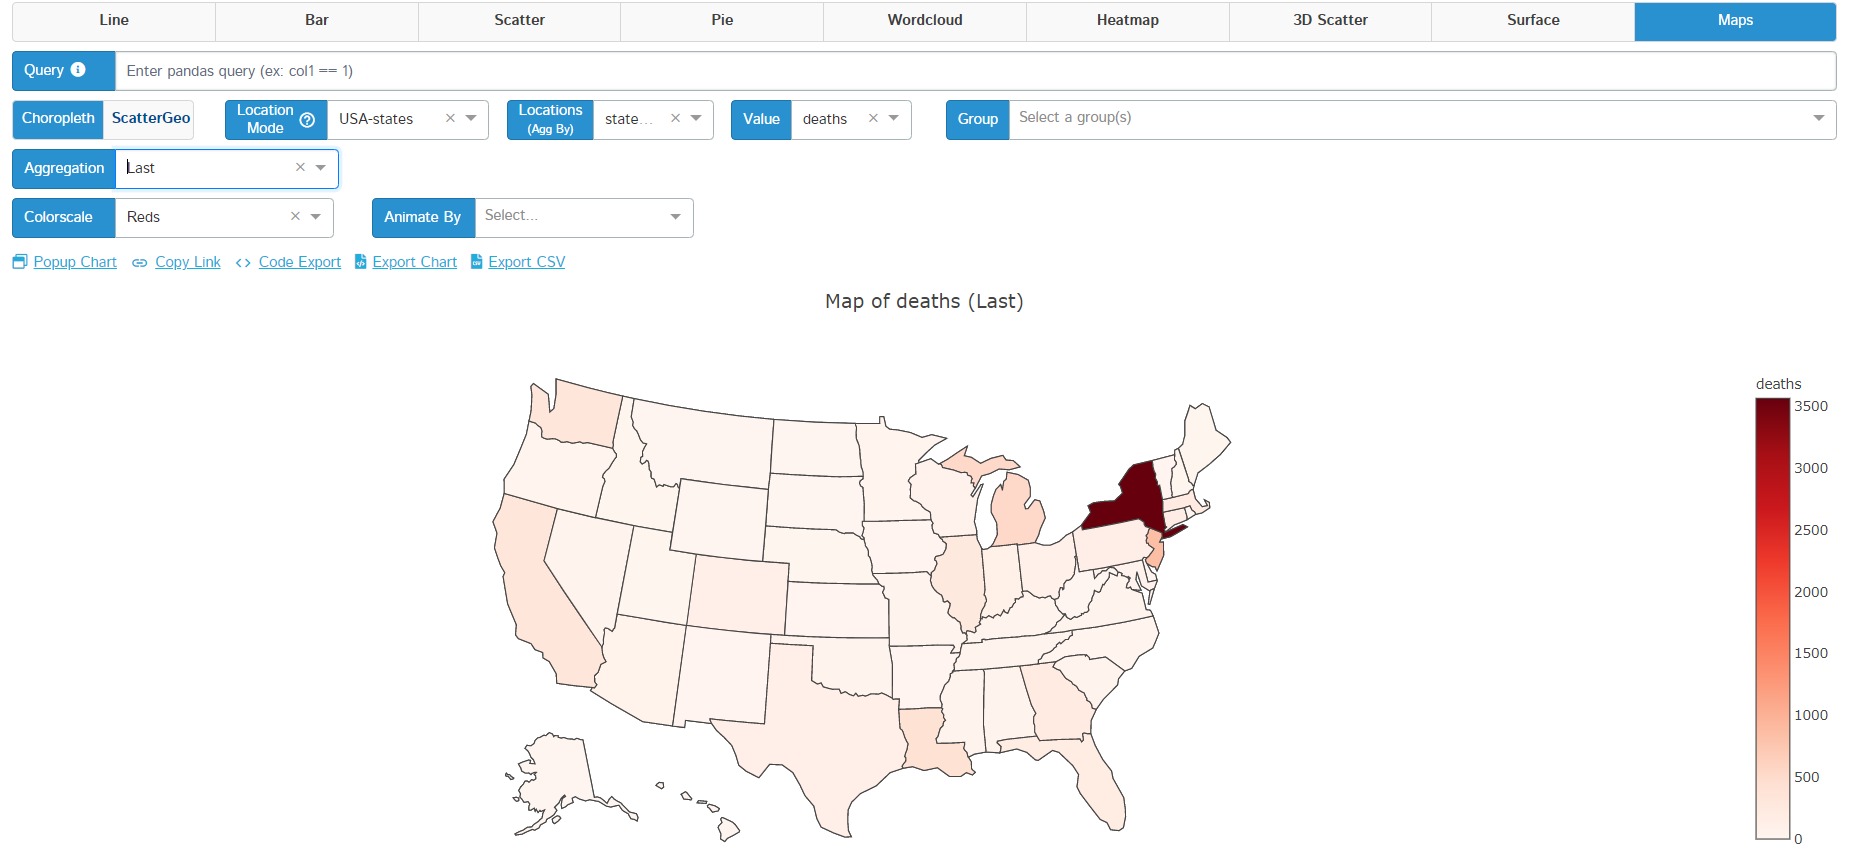 |
Y-Axis Toggling
Users now have the ability to toggle between 3 different behaviors for their y-axis display:
- Default: selecting this option will use the default behavior that comes with plotly for your chart's y-axis
- Single: this allows users to set the range of all series in your chart to be on the same basis as well as making that basis (min/max) editable
- Multi: this allows users to give each series its own y-axis and making that axis' range editable
Here's a quick tutorial: 
And some screenshots:
| Default | Single | Multi |
|---|---|---|
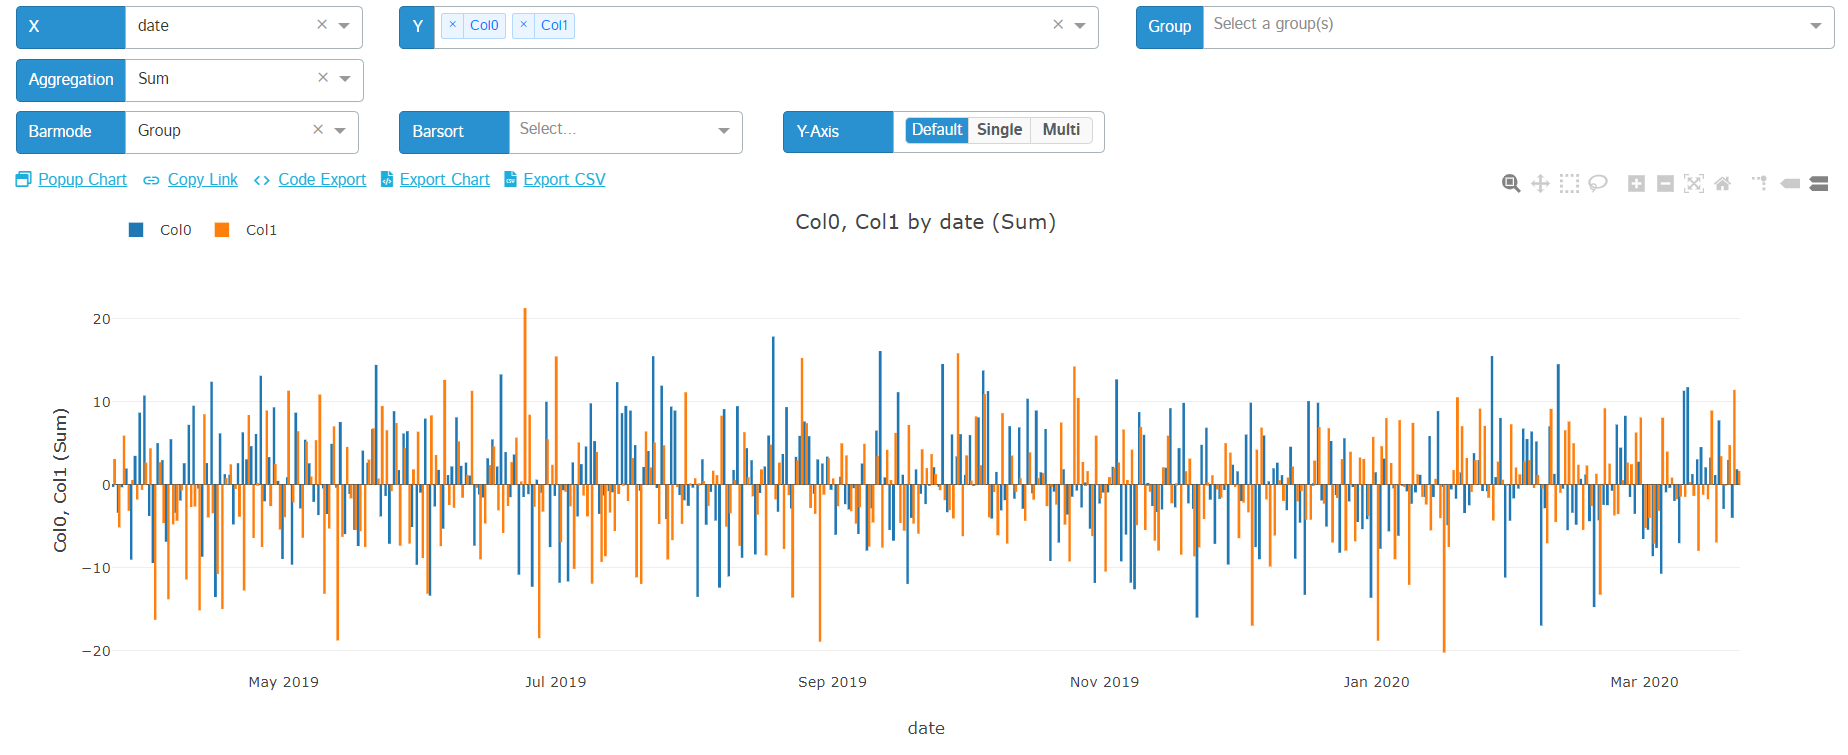 | 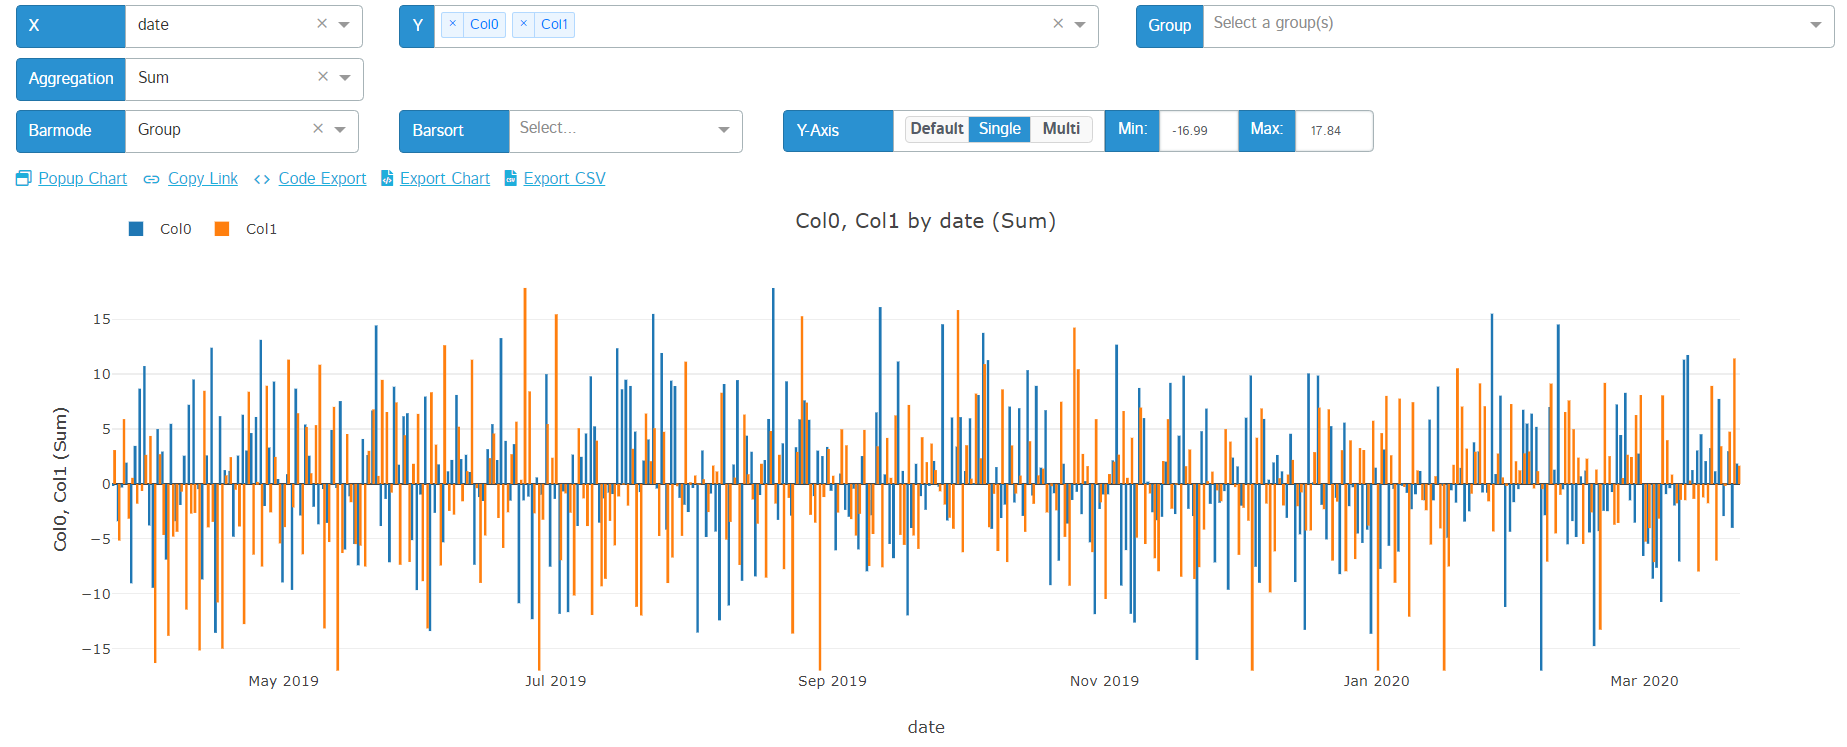 | 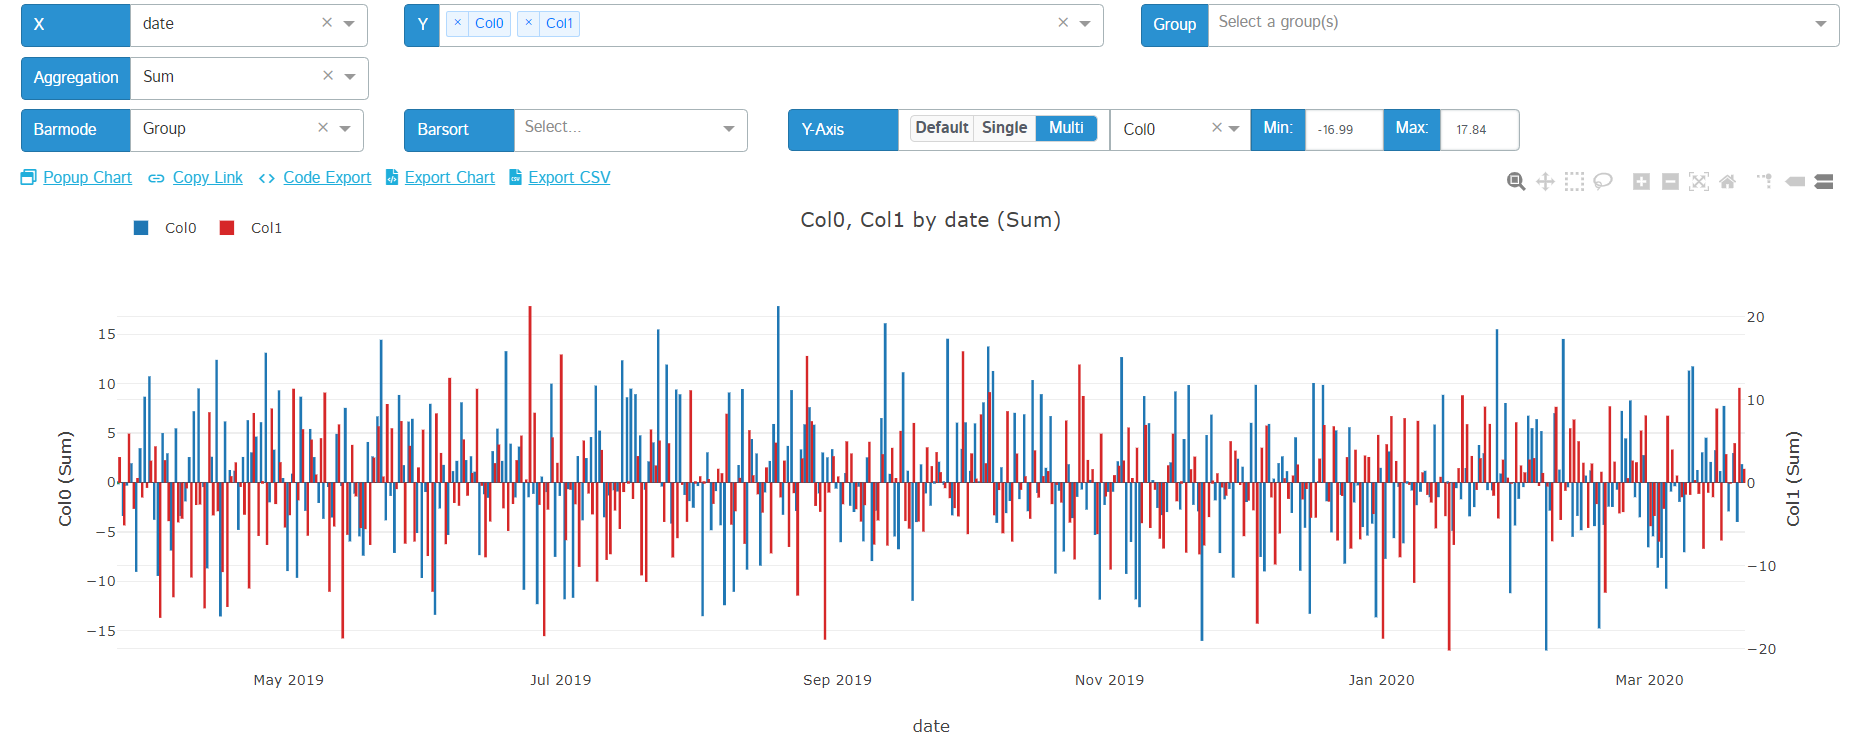 |
With a bar chart that only has a single Y-Axis you have the ability to sort the bars based on the values for the Y-Axis
| Pre-sort | Post-sort |
|---|---|
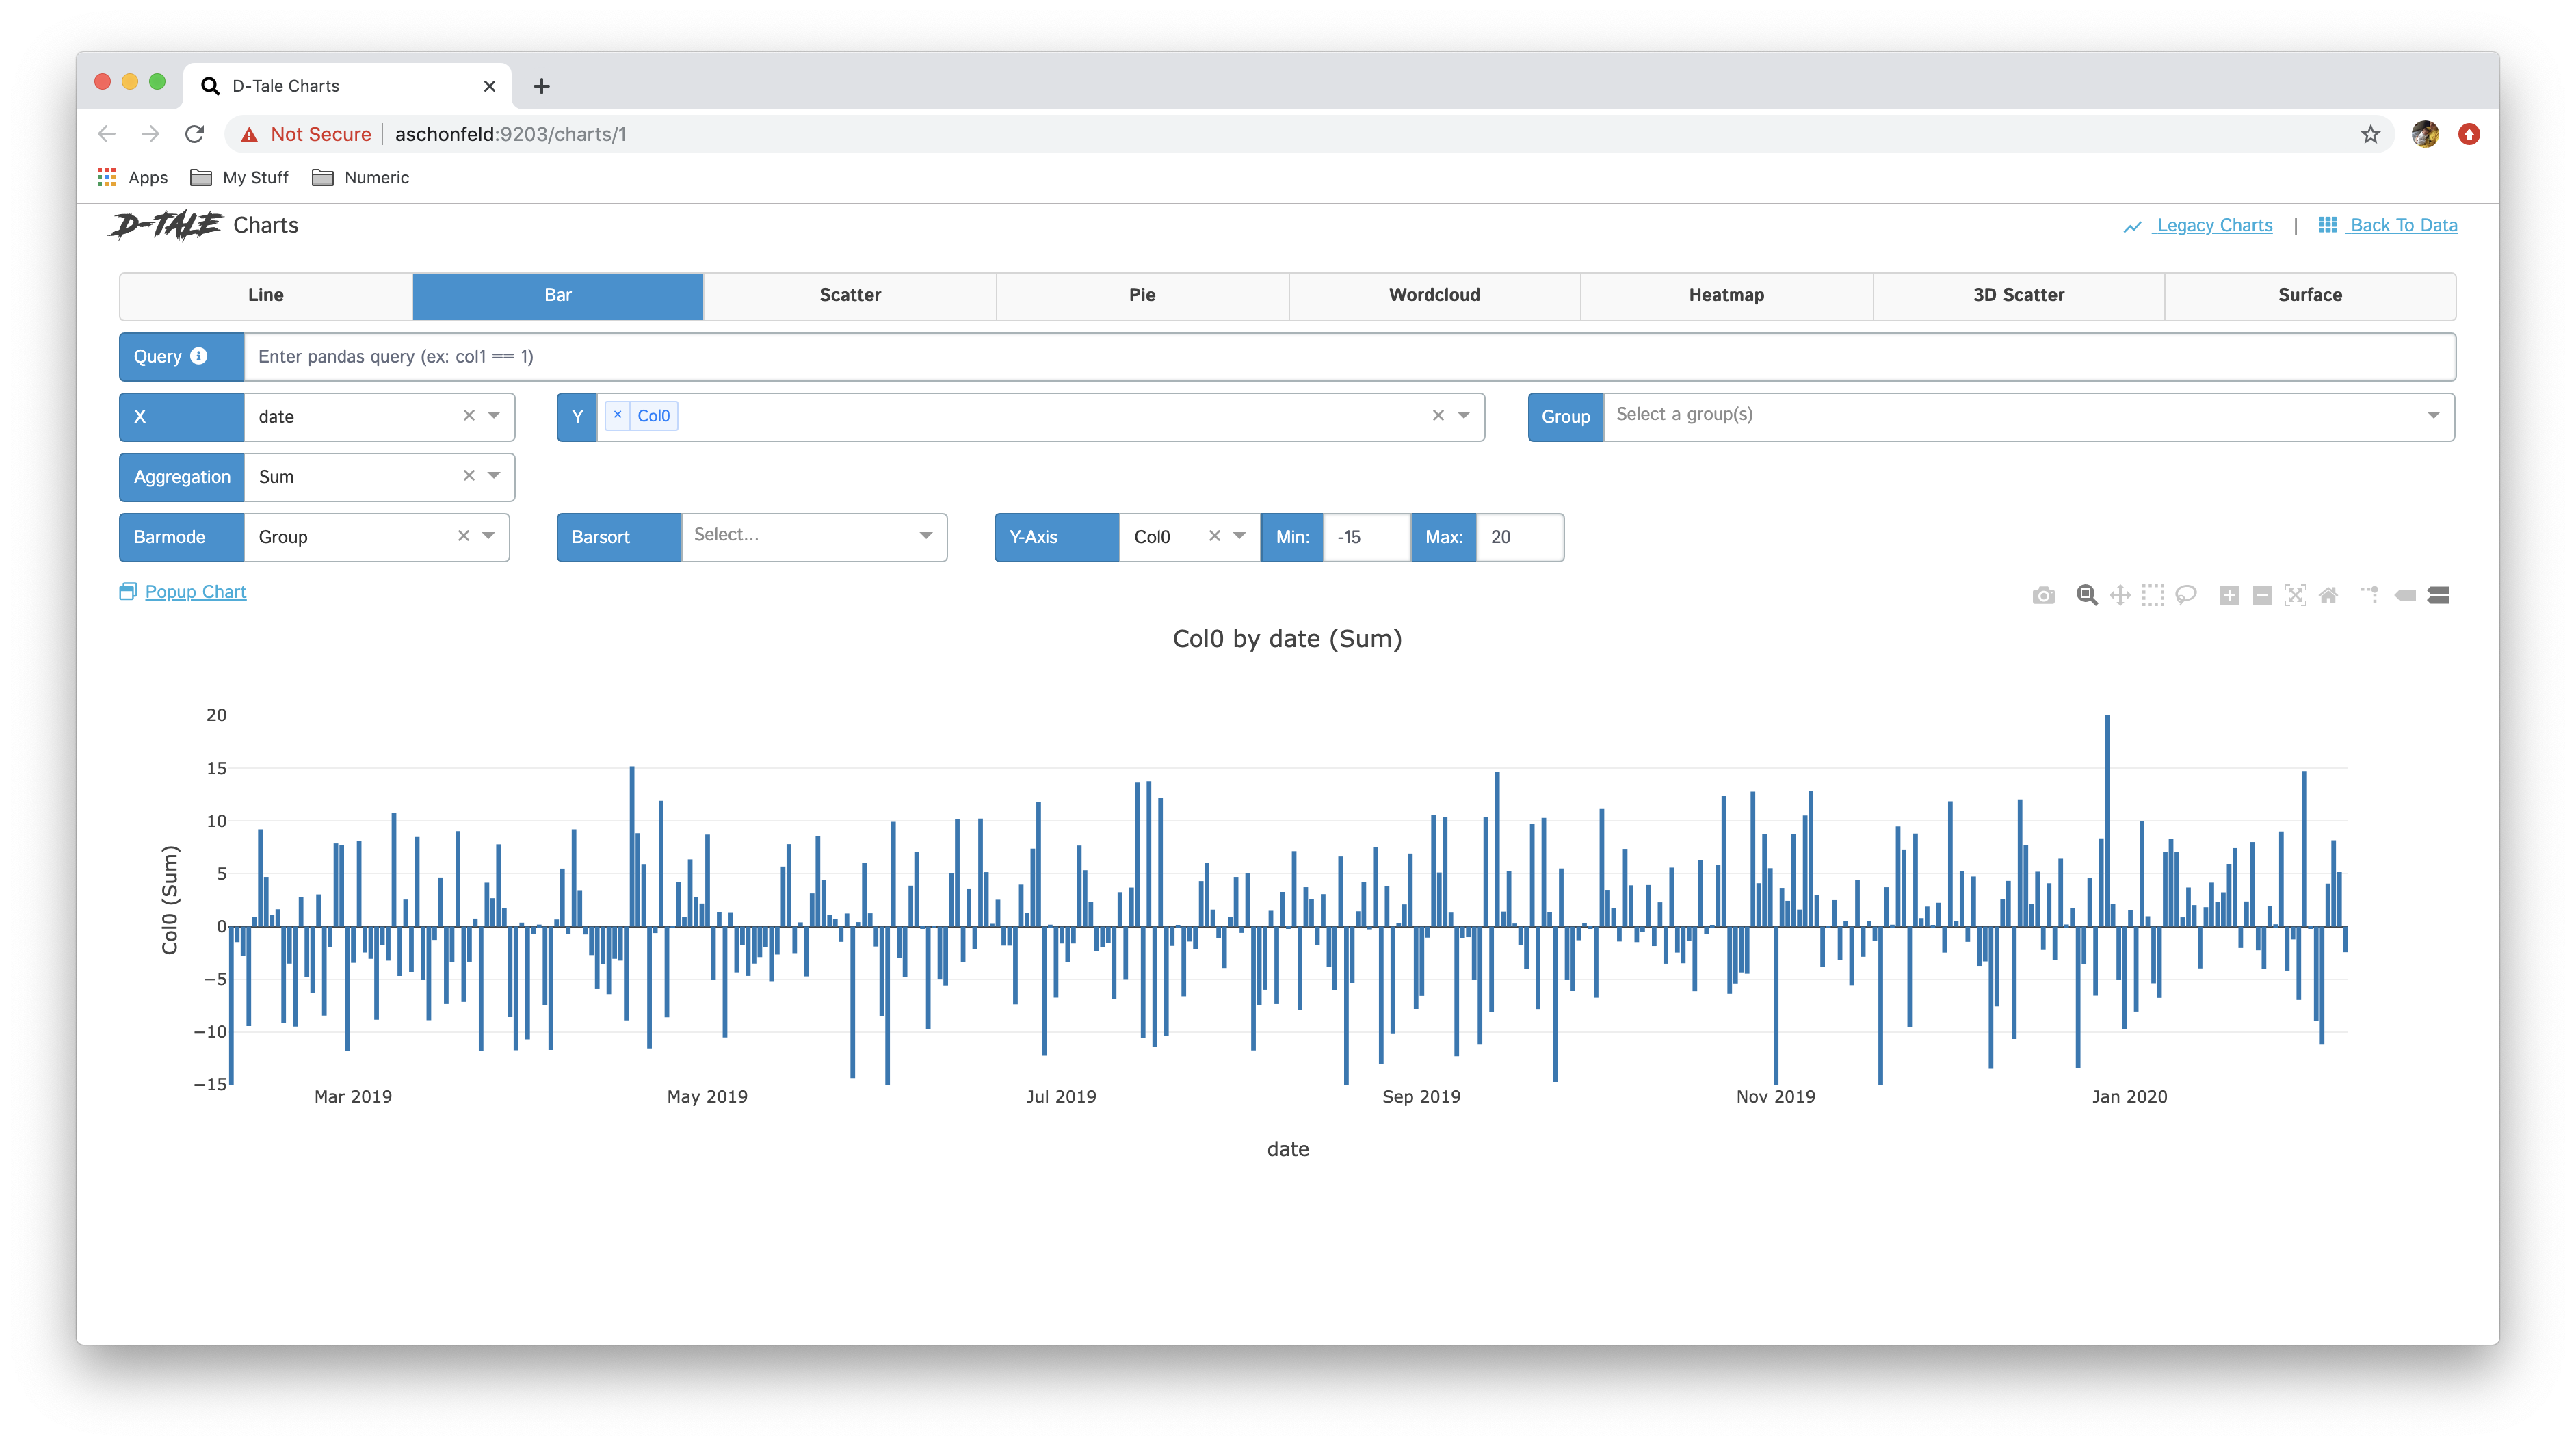 | 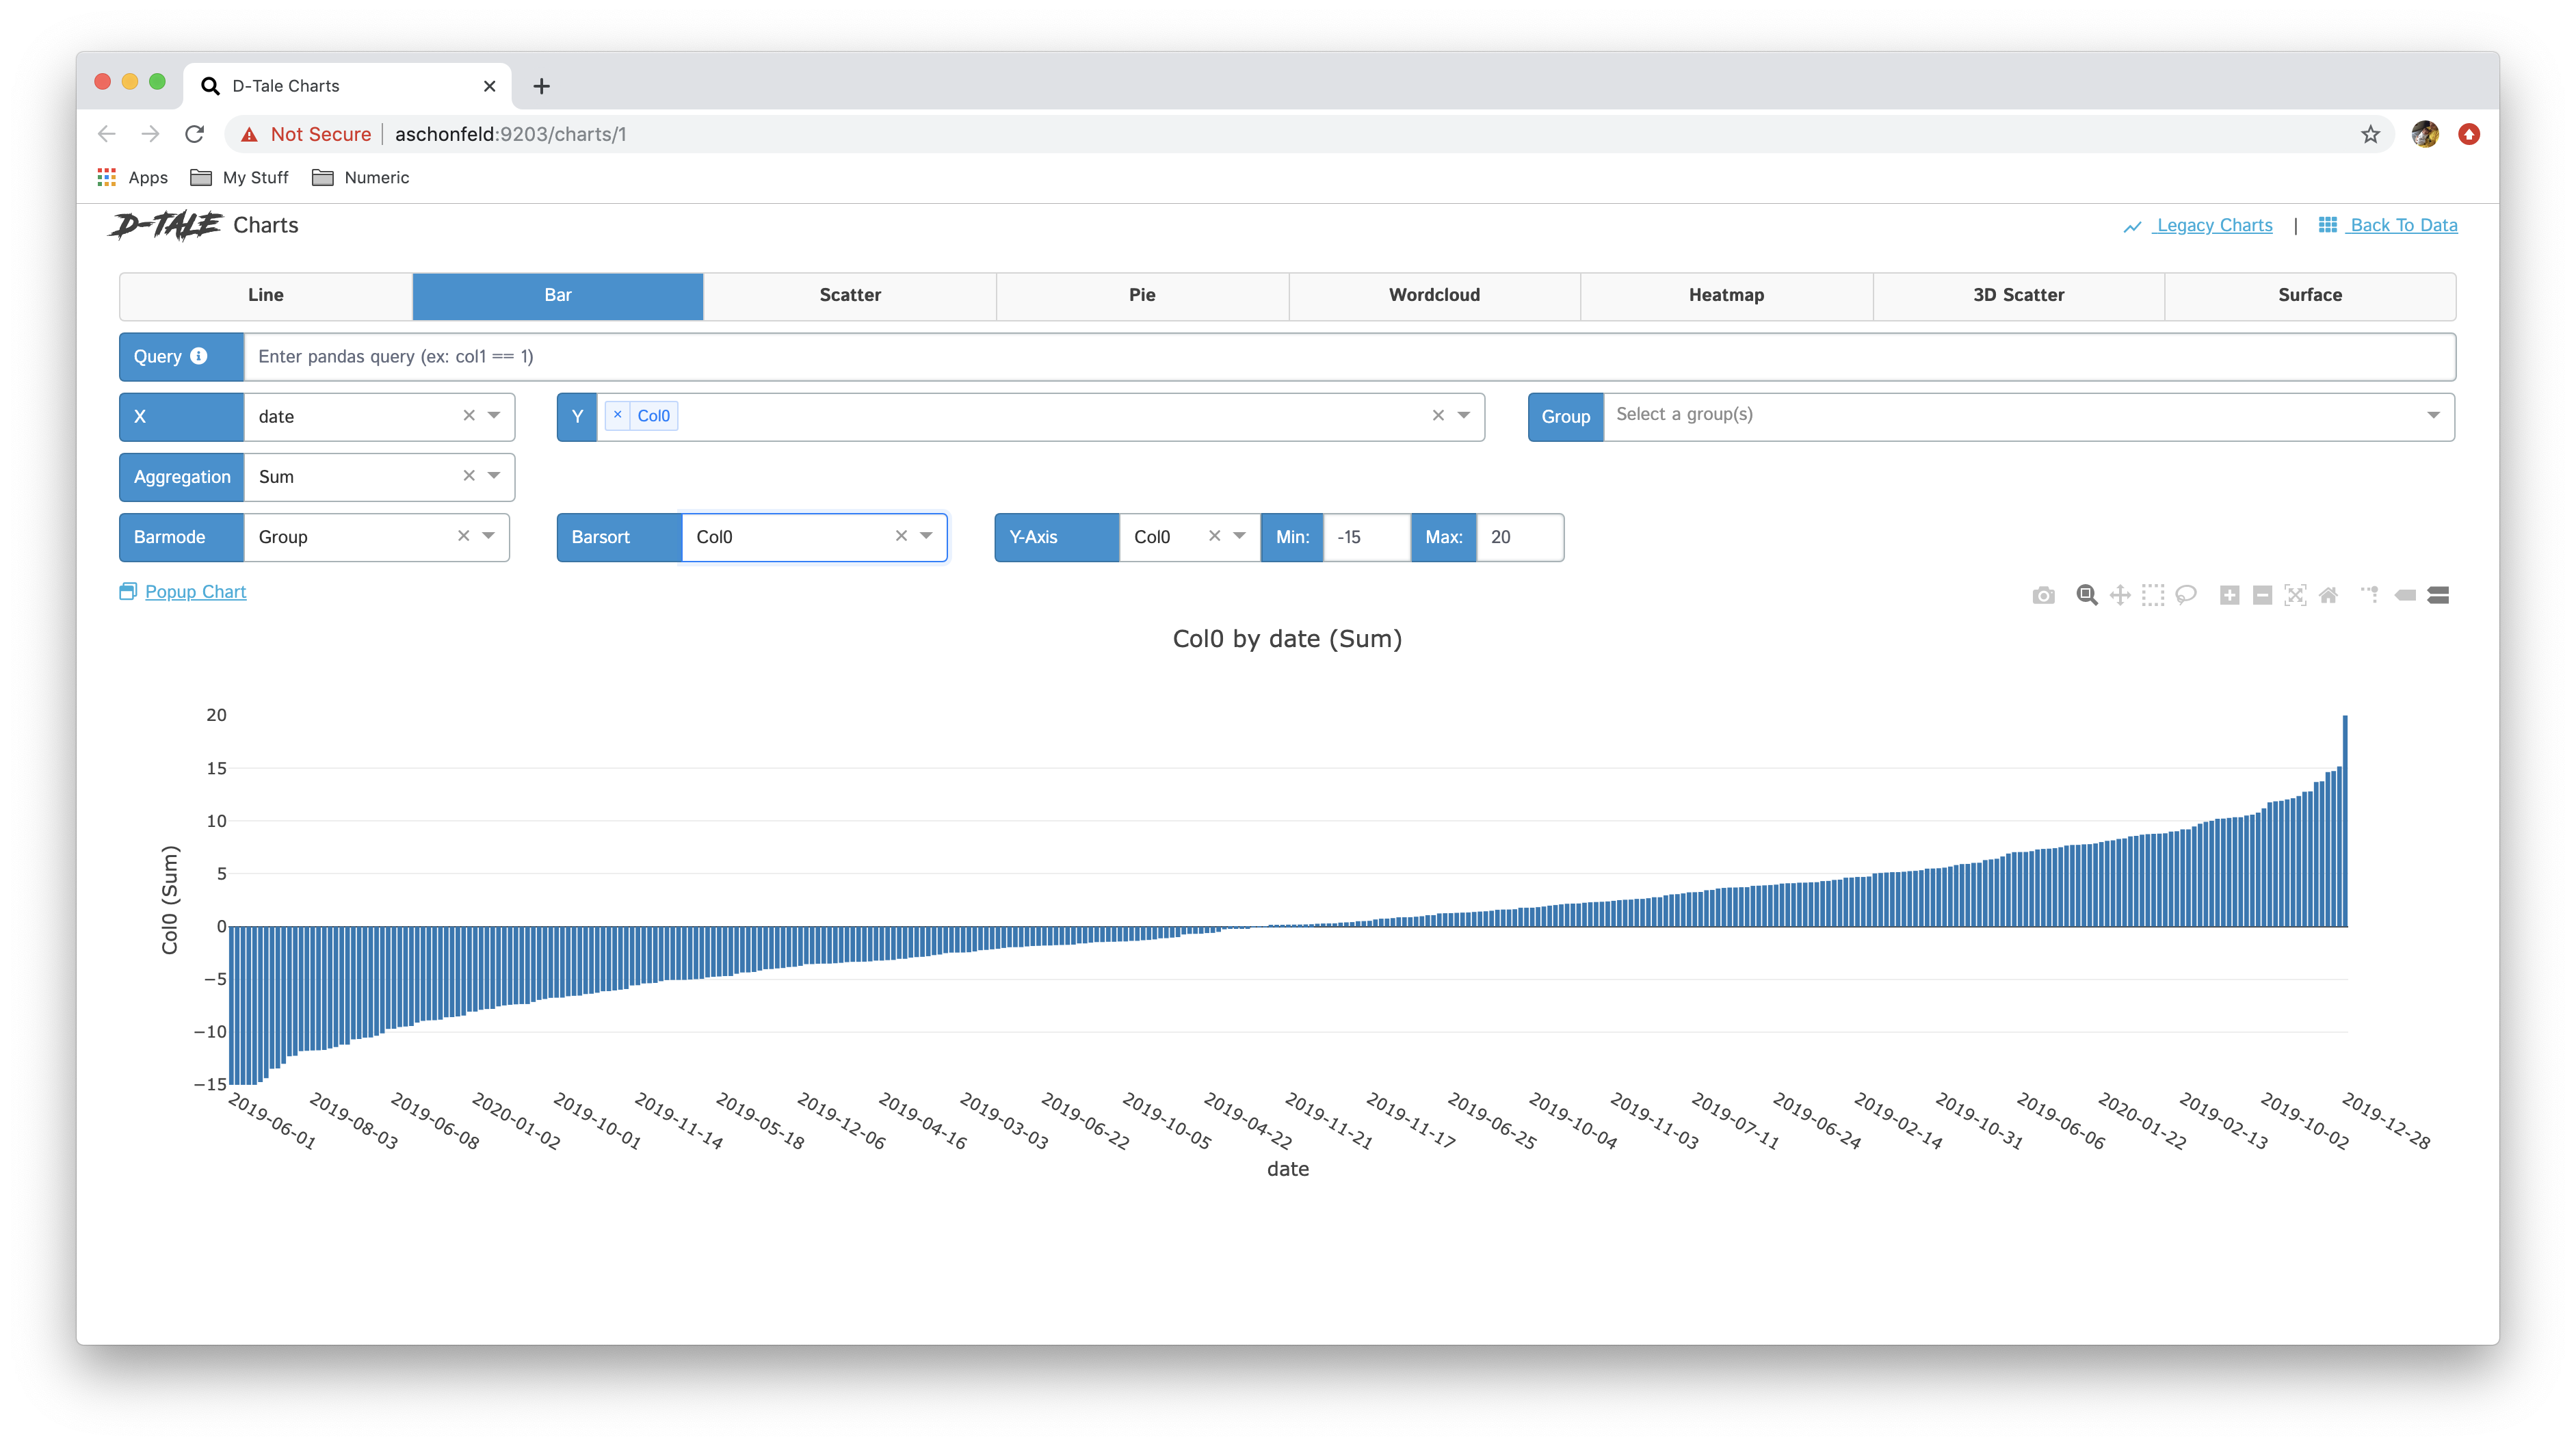 |
Popup Charts
Viewing multiple charts at once and want to separate one out into its own window or simply move one off to the side so you can work on building another for comparison? Well now you can by clicking the "Popup" button :smile:
Copy Link
Want to send what you're looking at to someone else? Simply click the "Copy Link" button and it will save a pre-populated chart URL into your clipboard. As long as your D-Tale process is still running when that link is opened you will see your original chart.
Exporting Charts
You can now export your dash charts (with the exception of Wordclouds) to static HTML files which can be emailed to others or saved down to be viewed at a later time. The best part is that all of the javascript for plotly is embedded in these files so the nice zooming, panning, etc is still available! :boom:
Exporting CSV
I've been asked about being able to export the data that is contained within your chart to a CSV for further analysis in tools like Excel. This button makes that possible.
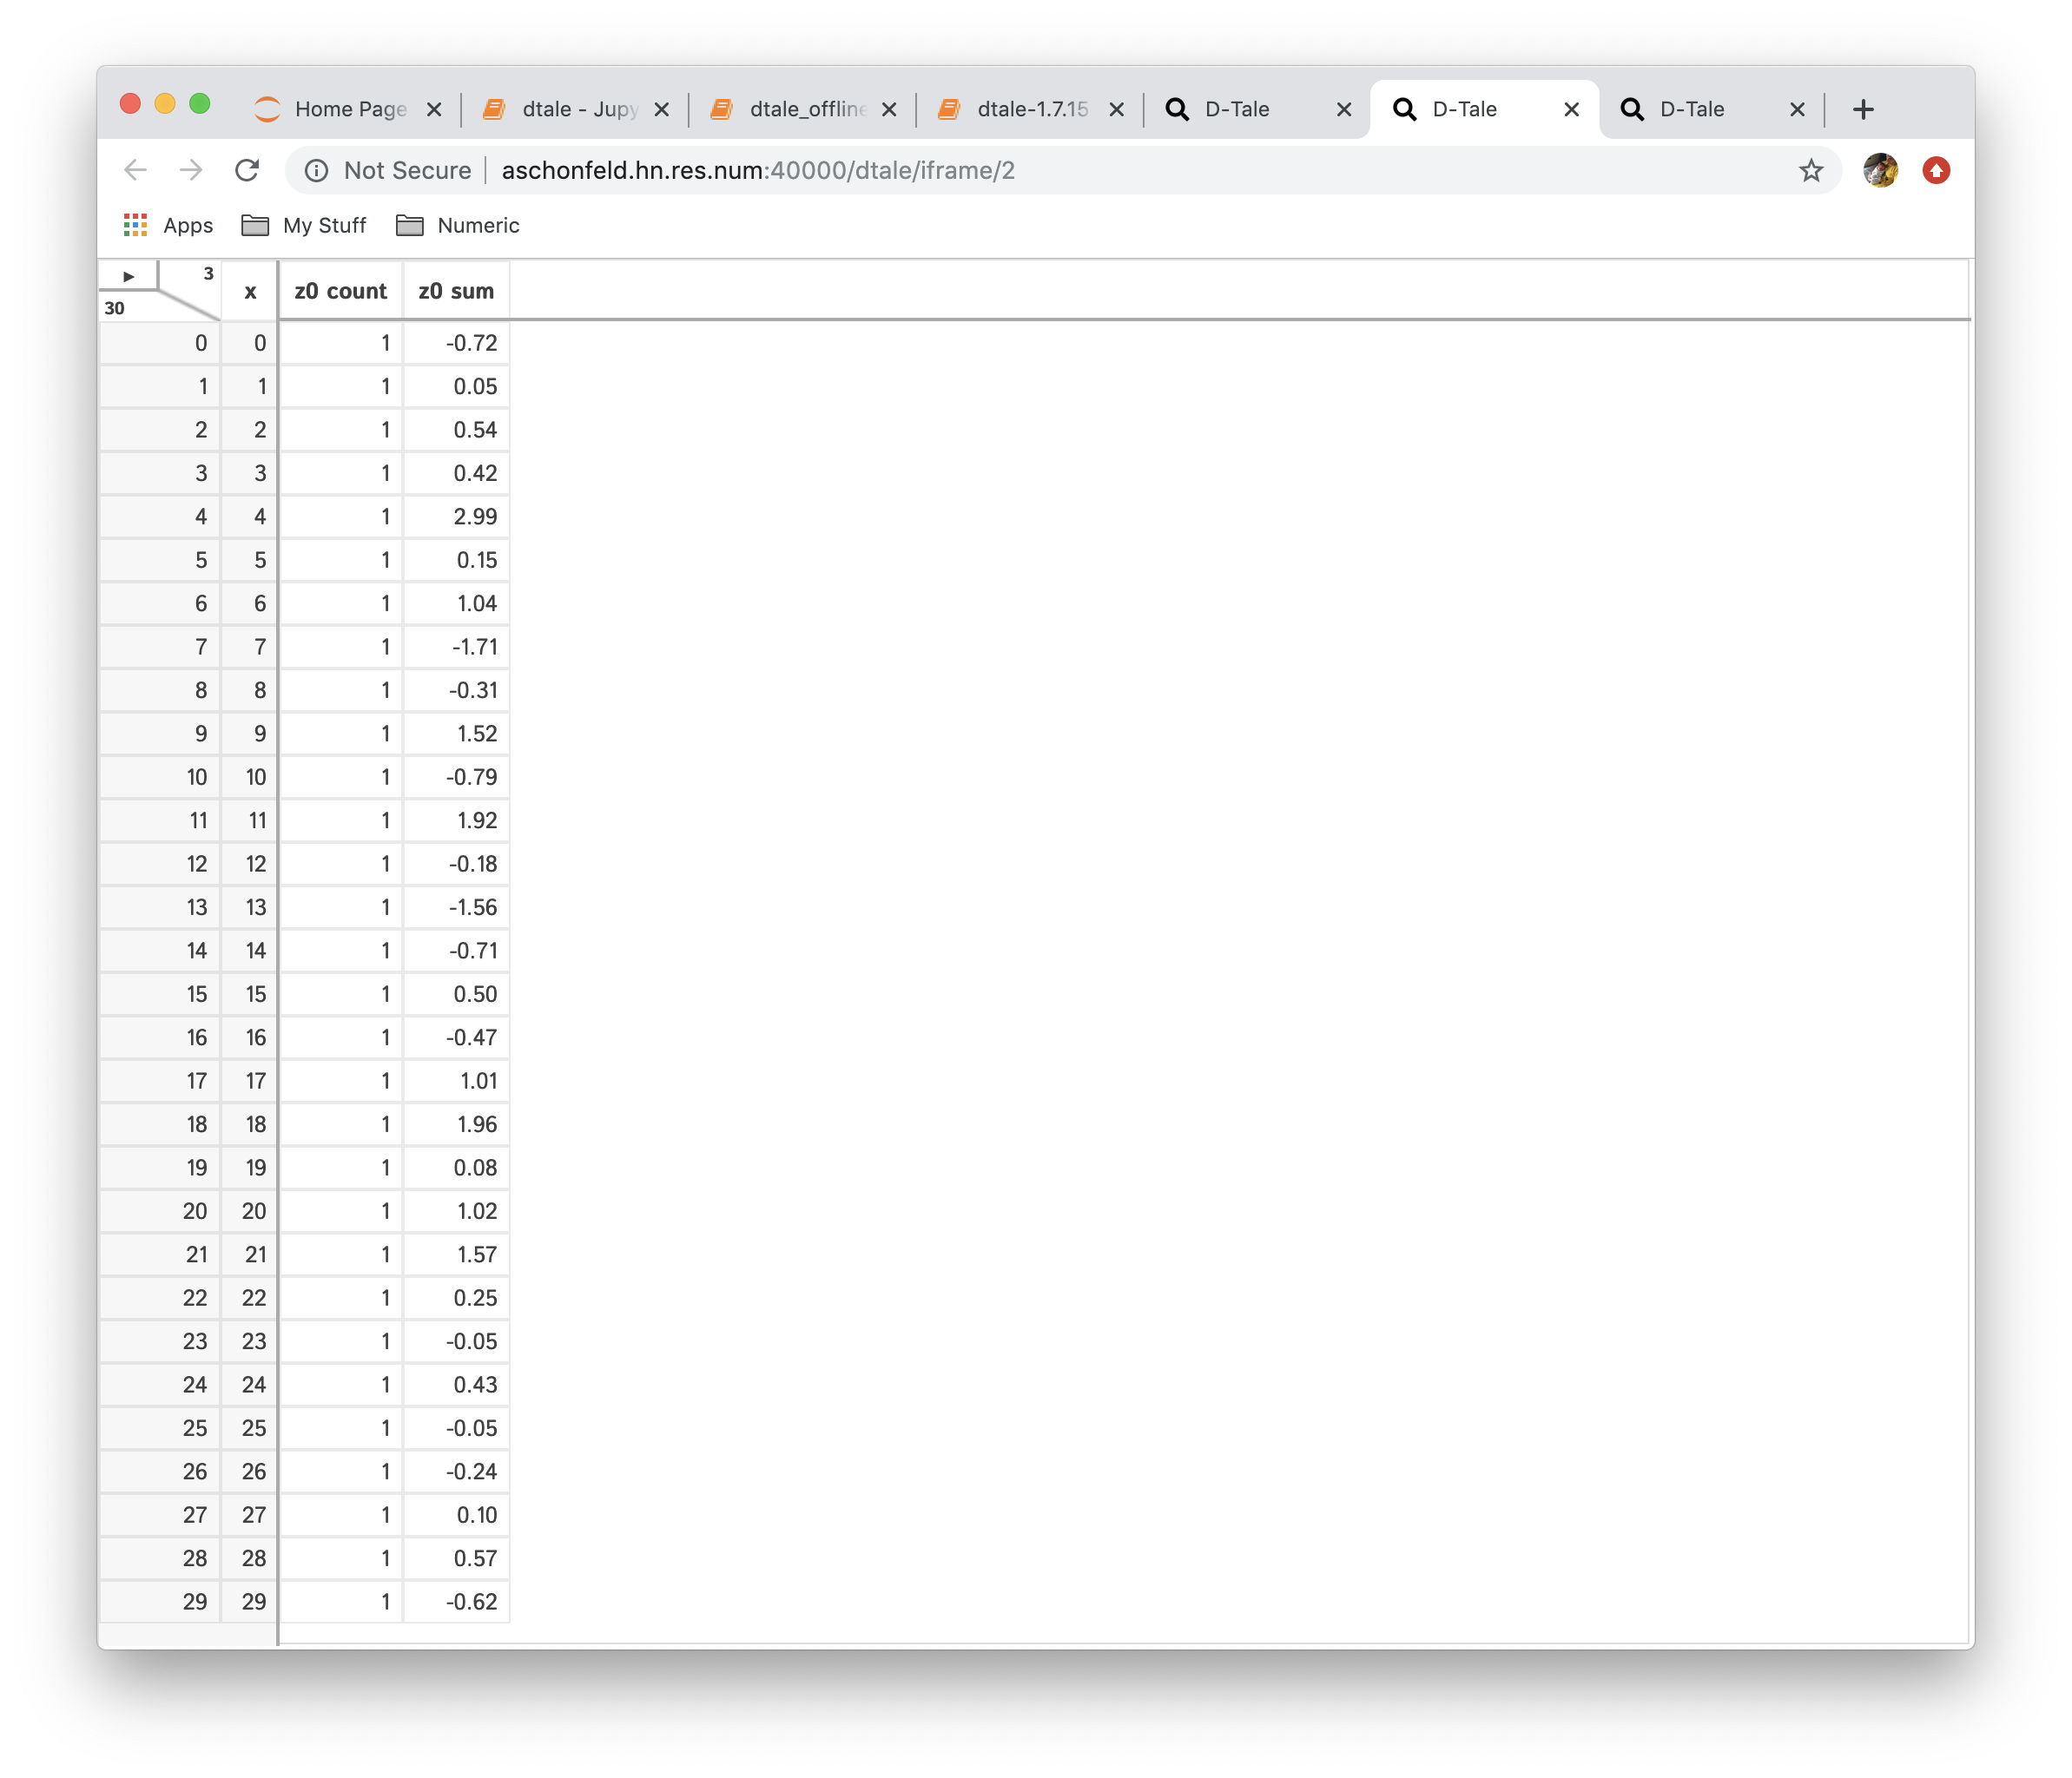
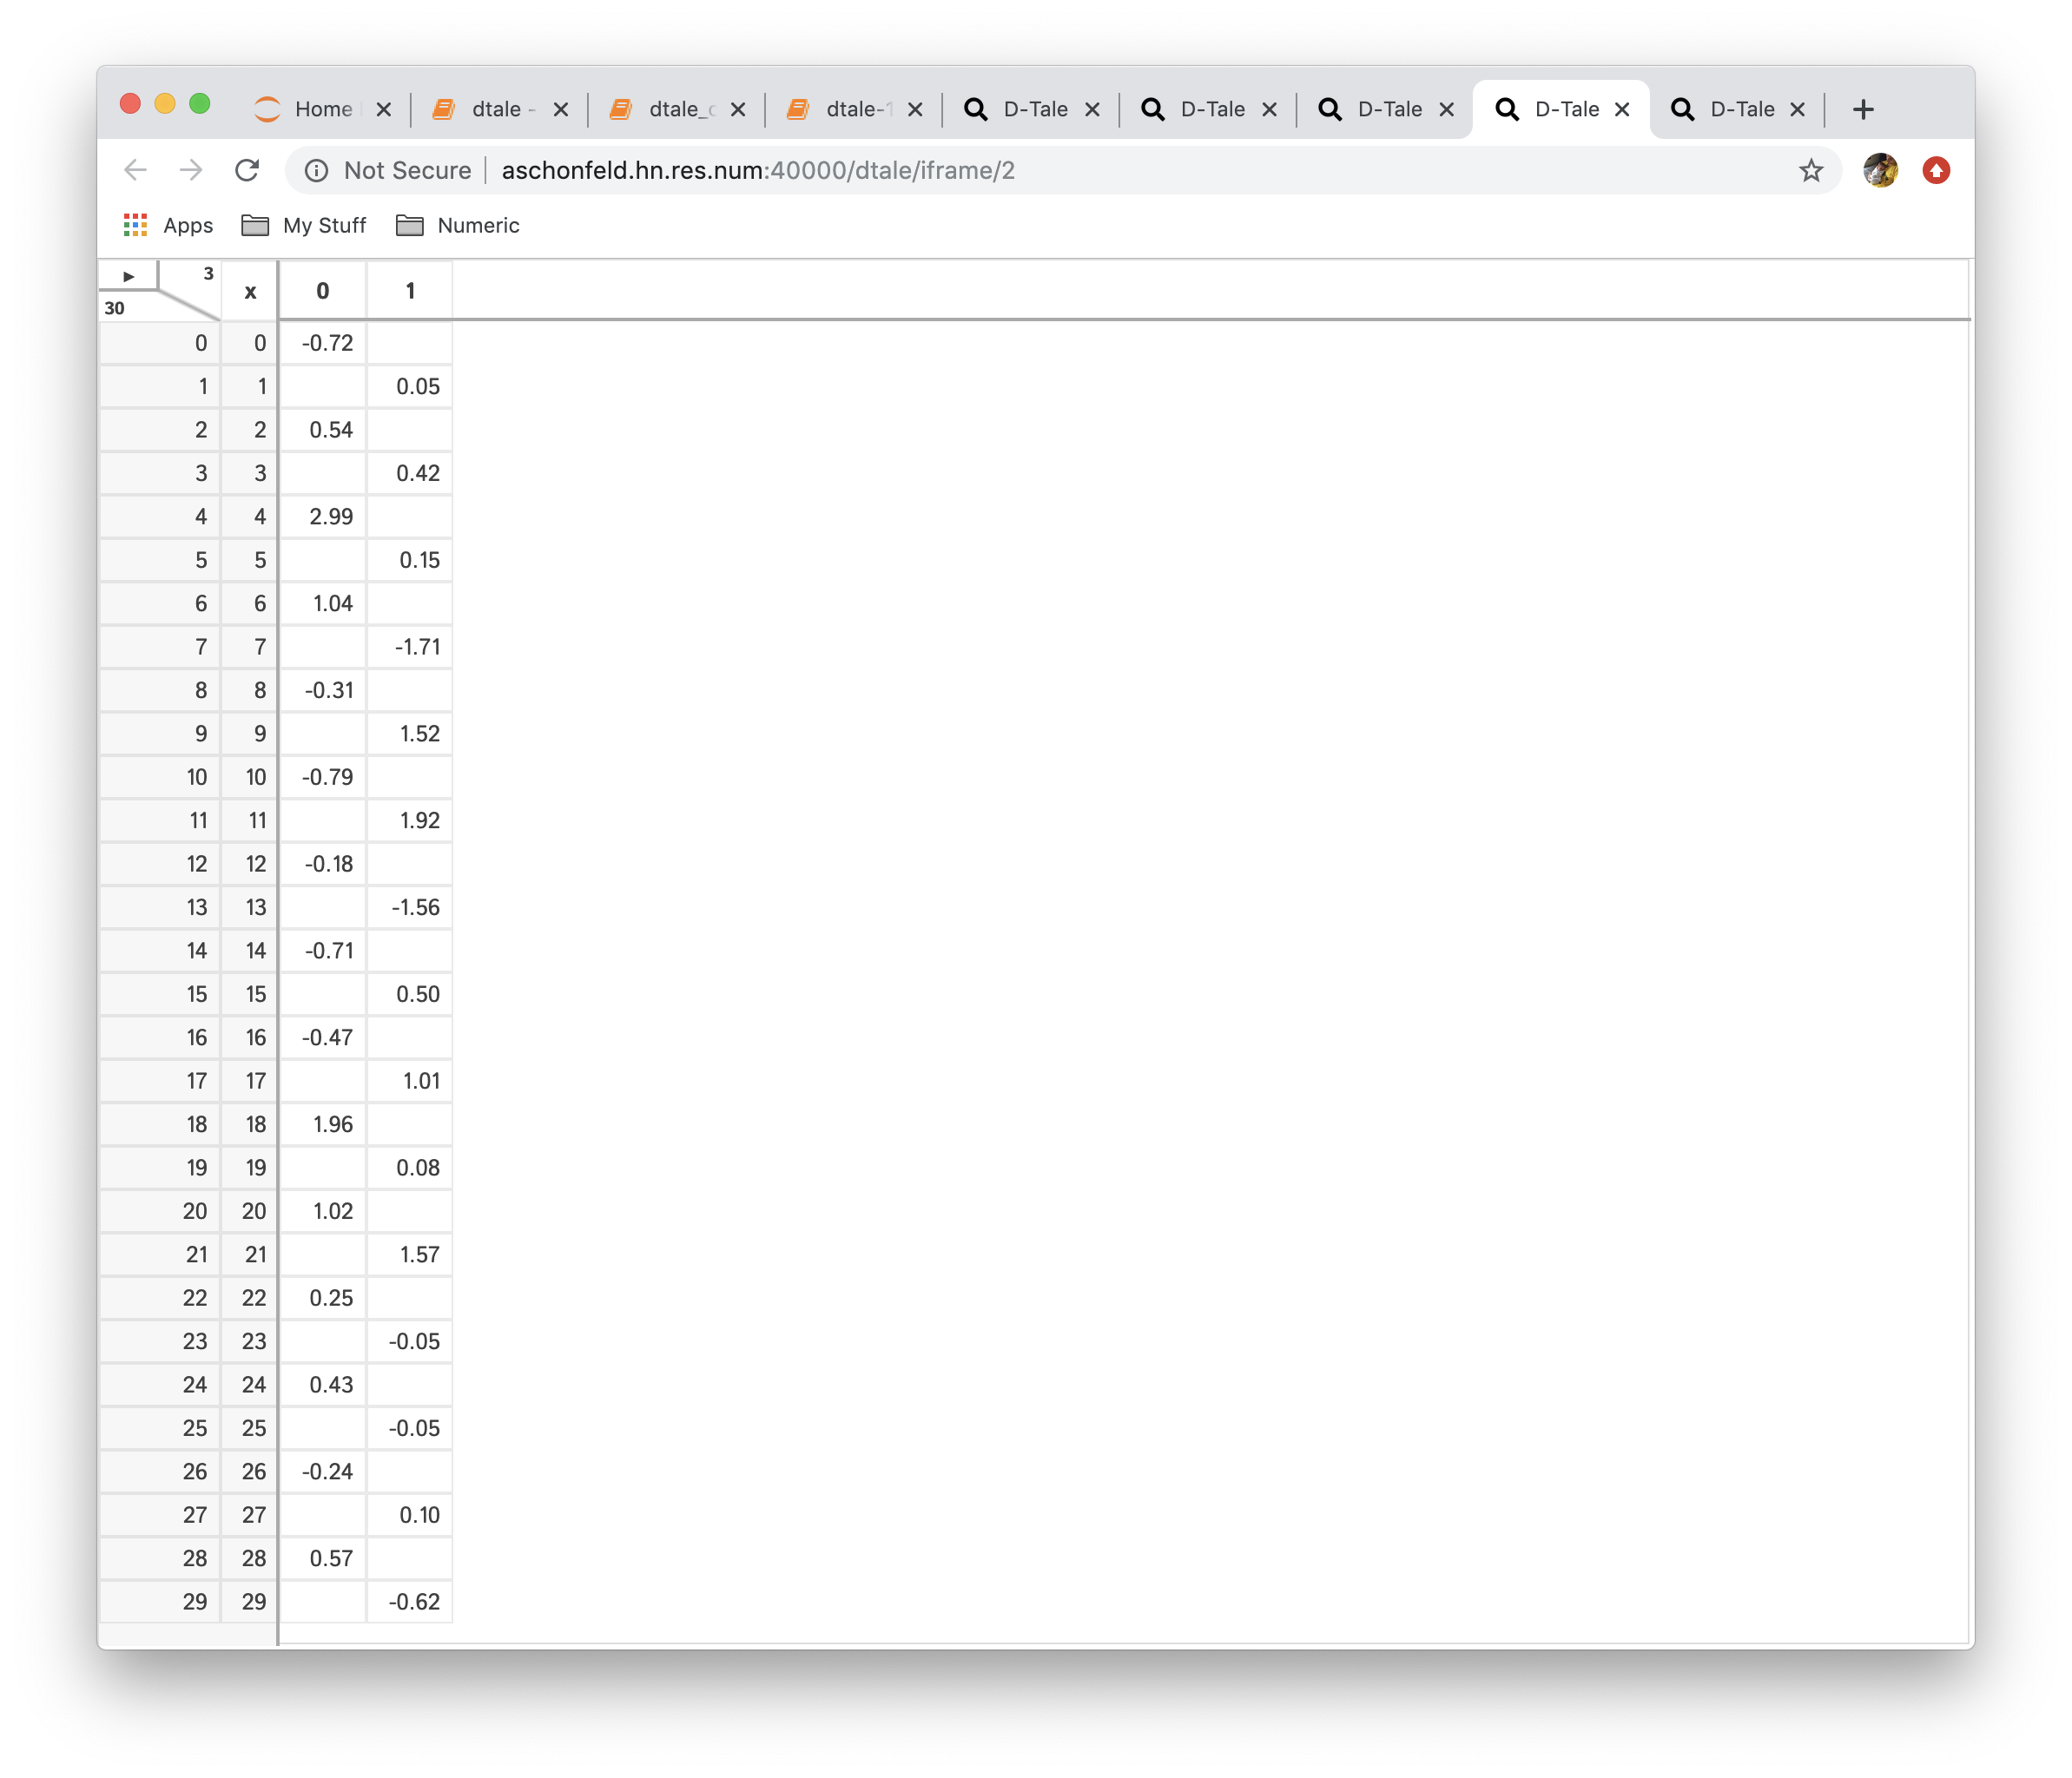
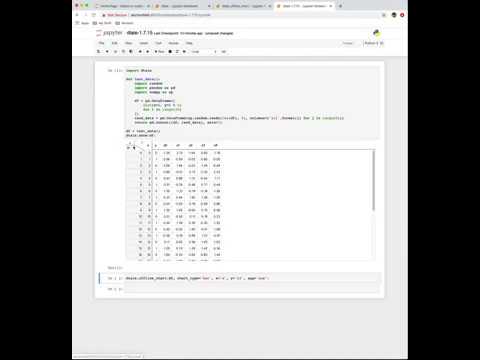
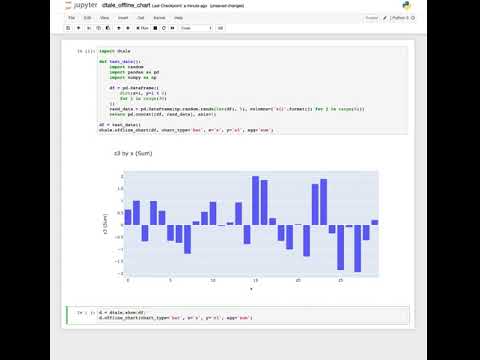
OFFLINE CHARTS
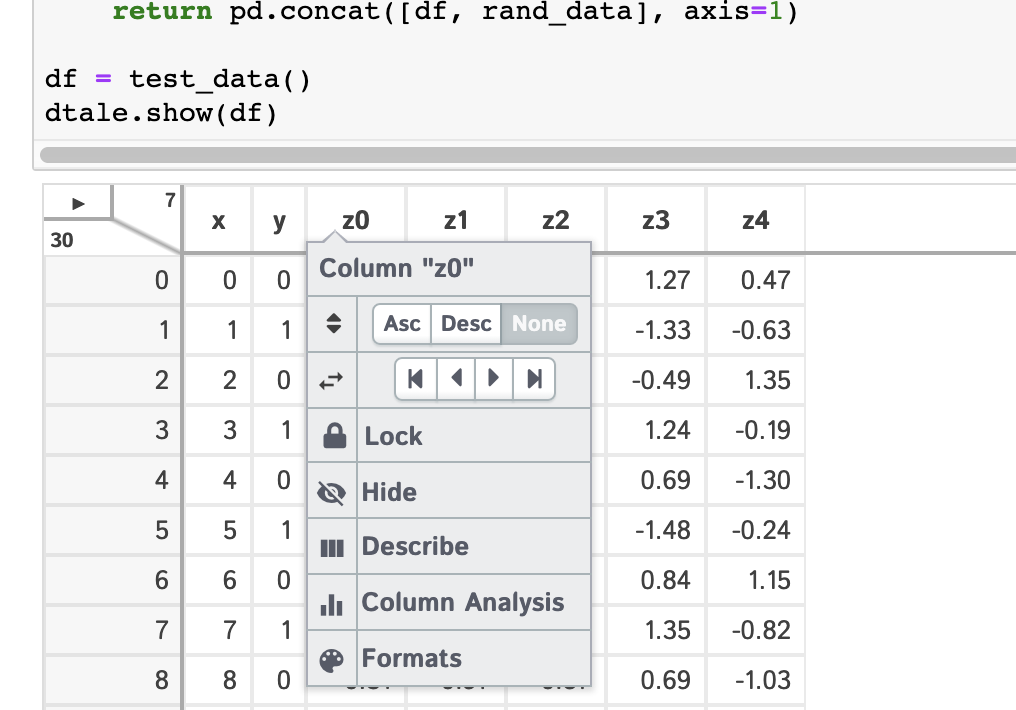
Want to run D-Tale in a jupyter notebook and build a chart that will still be displayed even after your D-Tale process has shutdown? Now you can! Here's an example code snippet show how to use it:
import dtale

def test_data():
    import random
    import pandas as pd
    import numpy as np

    df = pd.DataFrame([
        dict(x=i, y=i % 2)
        for i in range(30)
    ])
    rand_data = pd.DataFrame(np.random.randn(len(df), 5), columns=['z{}'.format(j) for j in range(5)])
    return pd.concat([df, rand_data], axis=1)

d = dtale.show(test_data())
d.offline_chart(chart_type='bar', x='x', y='z3', agg='sum')
Pro Tip: If generating offline charts in jupyter notebooks and you run out of memory please add the following to your command-line when starting jupyter
--NotebookApp.iopub_data_rate_limit=1.0e10
Disclaimer: Long Running Chart Requests
If you choose to build a chart that requires a lot of computational resources then it will take some time to run. Based on the way Flask & plotly/dash interact this will block you from performing any other request until it completes. There are two courses of action in this situation:
- Restart your jupyter notebook kernel or python console
- Open a new D-Tale session on a different port than the current session. You can do that with the following command:
dtale.show(df, port=[any open port], force=True)
If you miss the legacy (non-plotly/dash) charts, not to worry! They are still available from the link in the upper-right corner, but on for a limited time... Here is the documentation for those: Legacy Charts
Your Feedback is Valuable
This is a very powerful feature with many more features that could be offered (linked subplots, different statistical aggregations, etc...) so please submit issues :)
Network Viewer
This tool gives users the ability to visualize directed graphs. For the screenshots I'll beshowing for this functionality we'll be working off a dataframe with the following data:
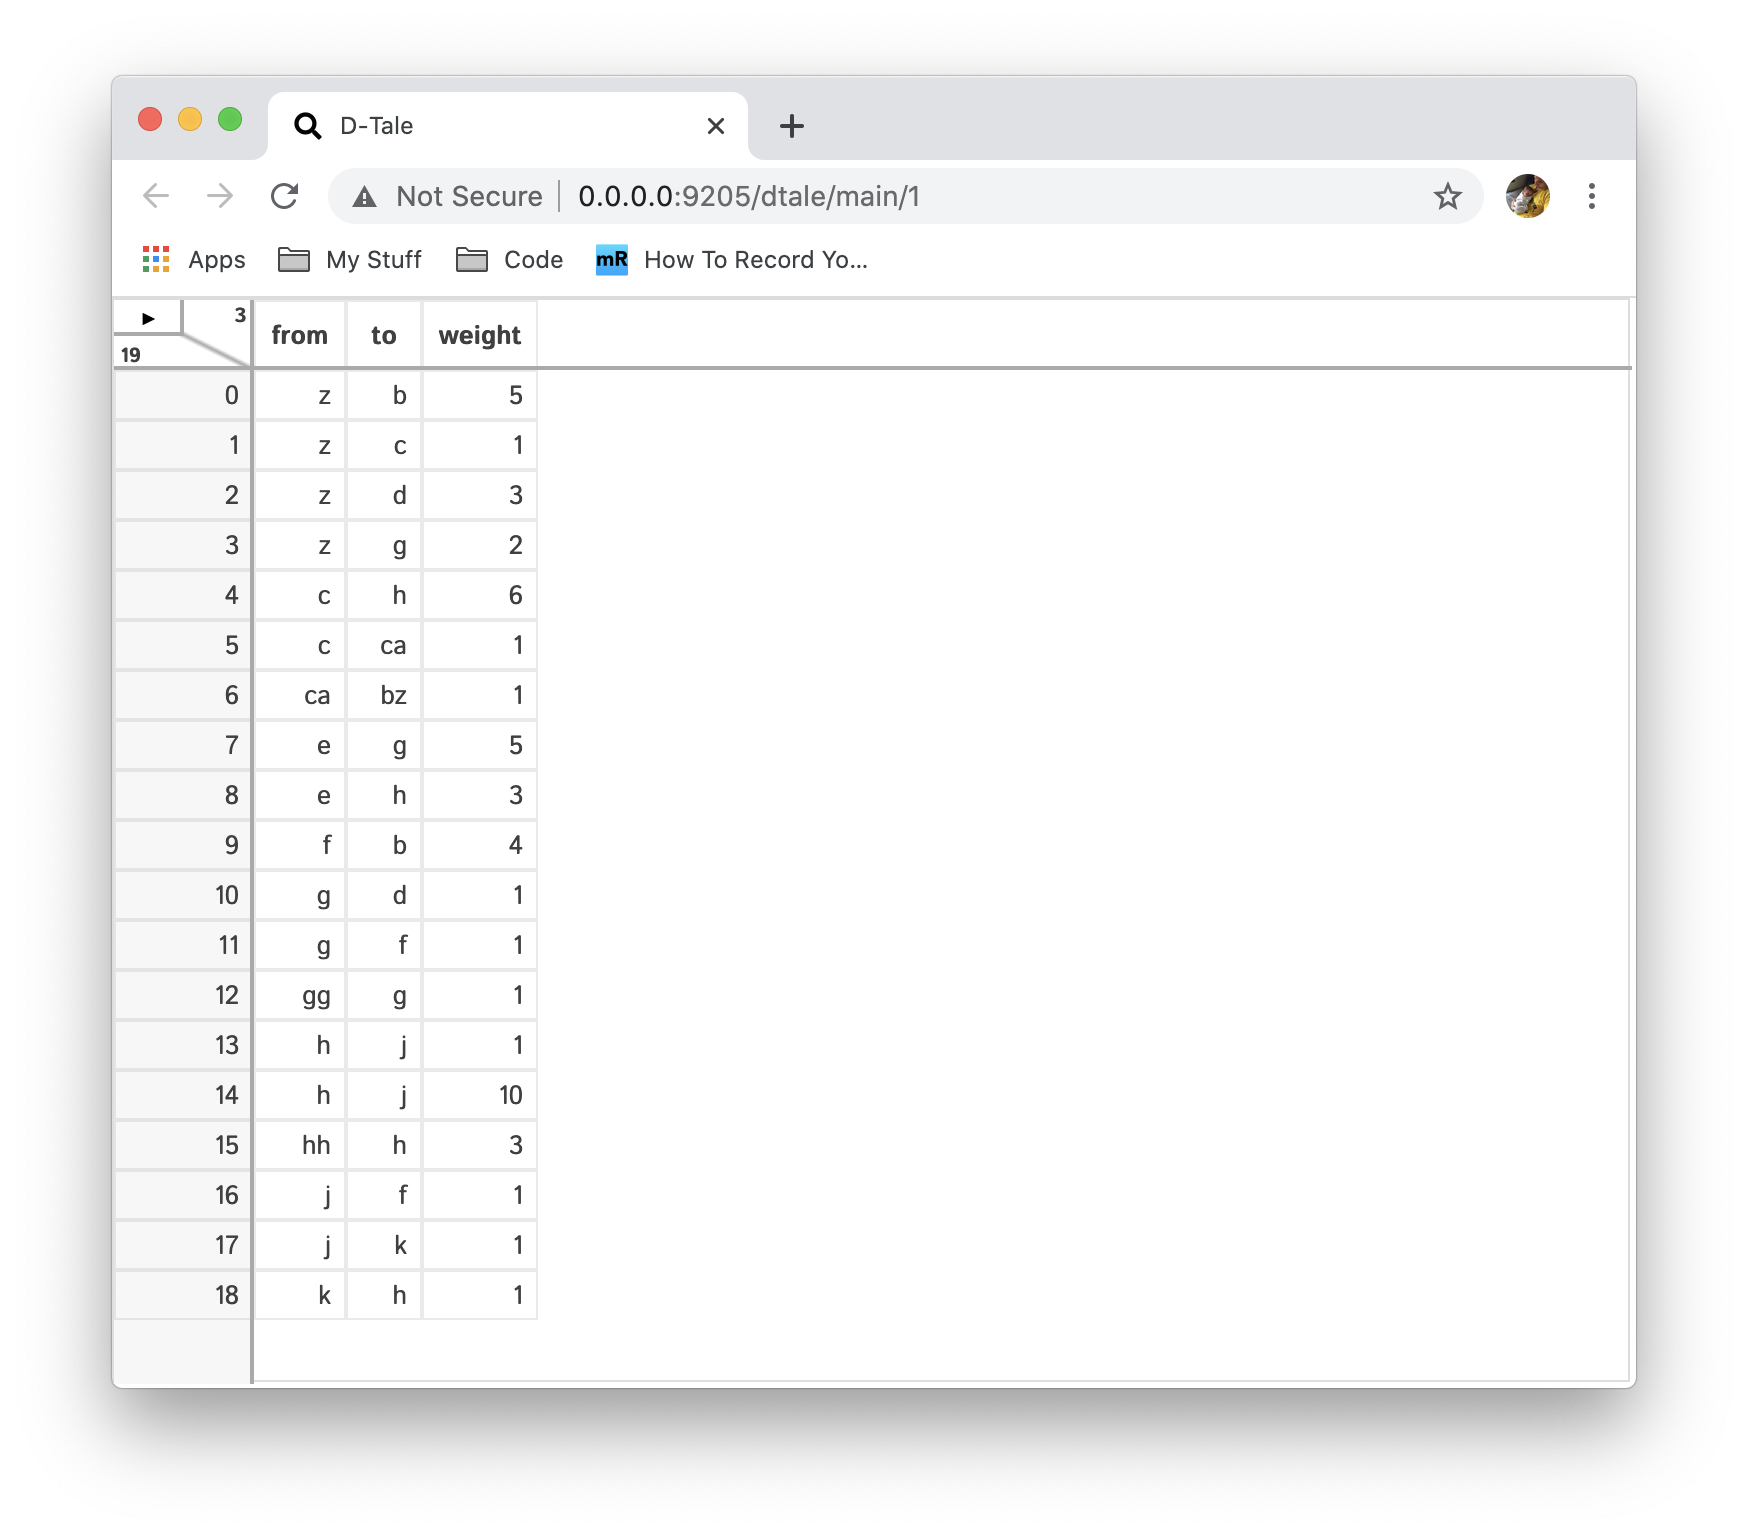
Start by selecting columns containing the "To" and "From" values for the nodes in you network and then click "Load":
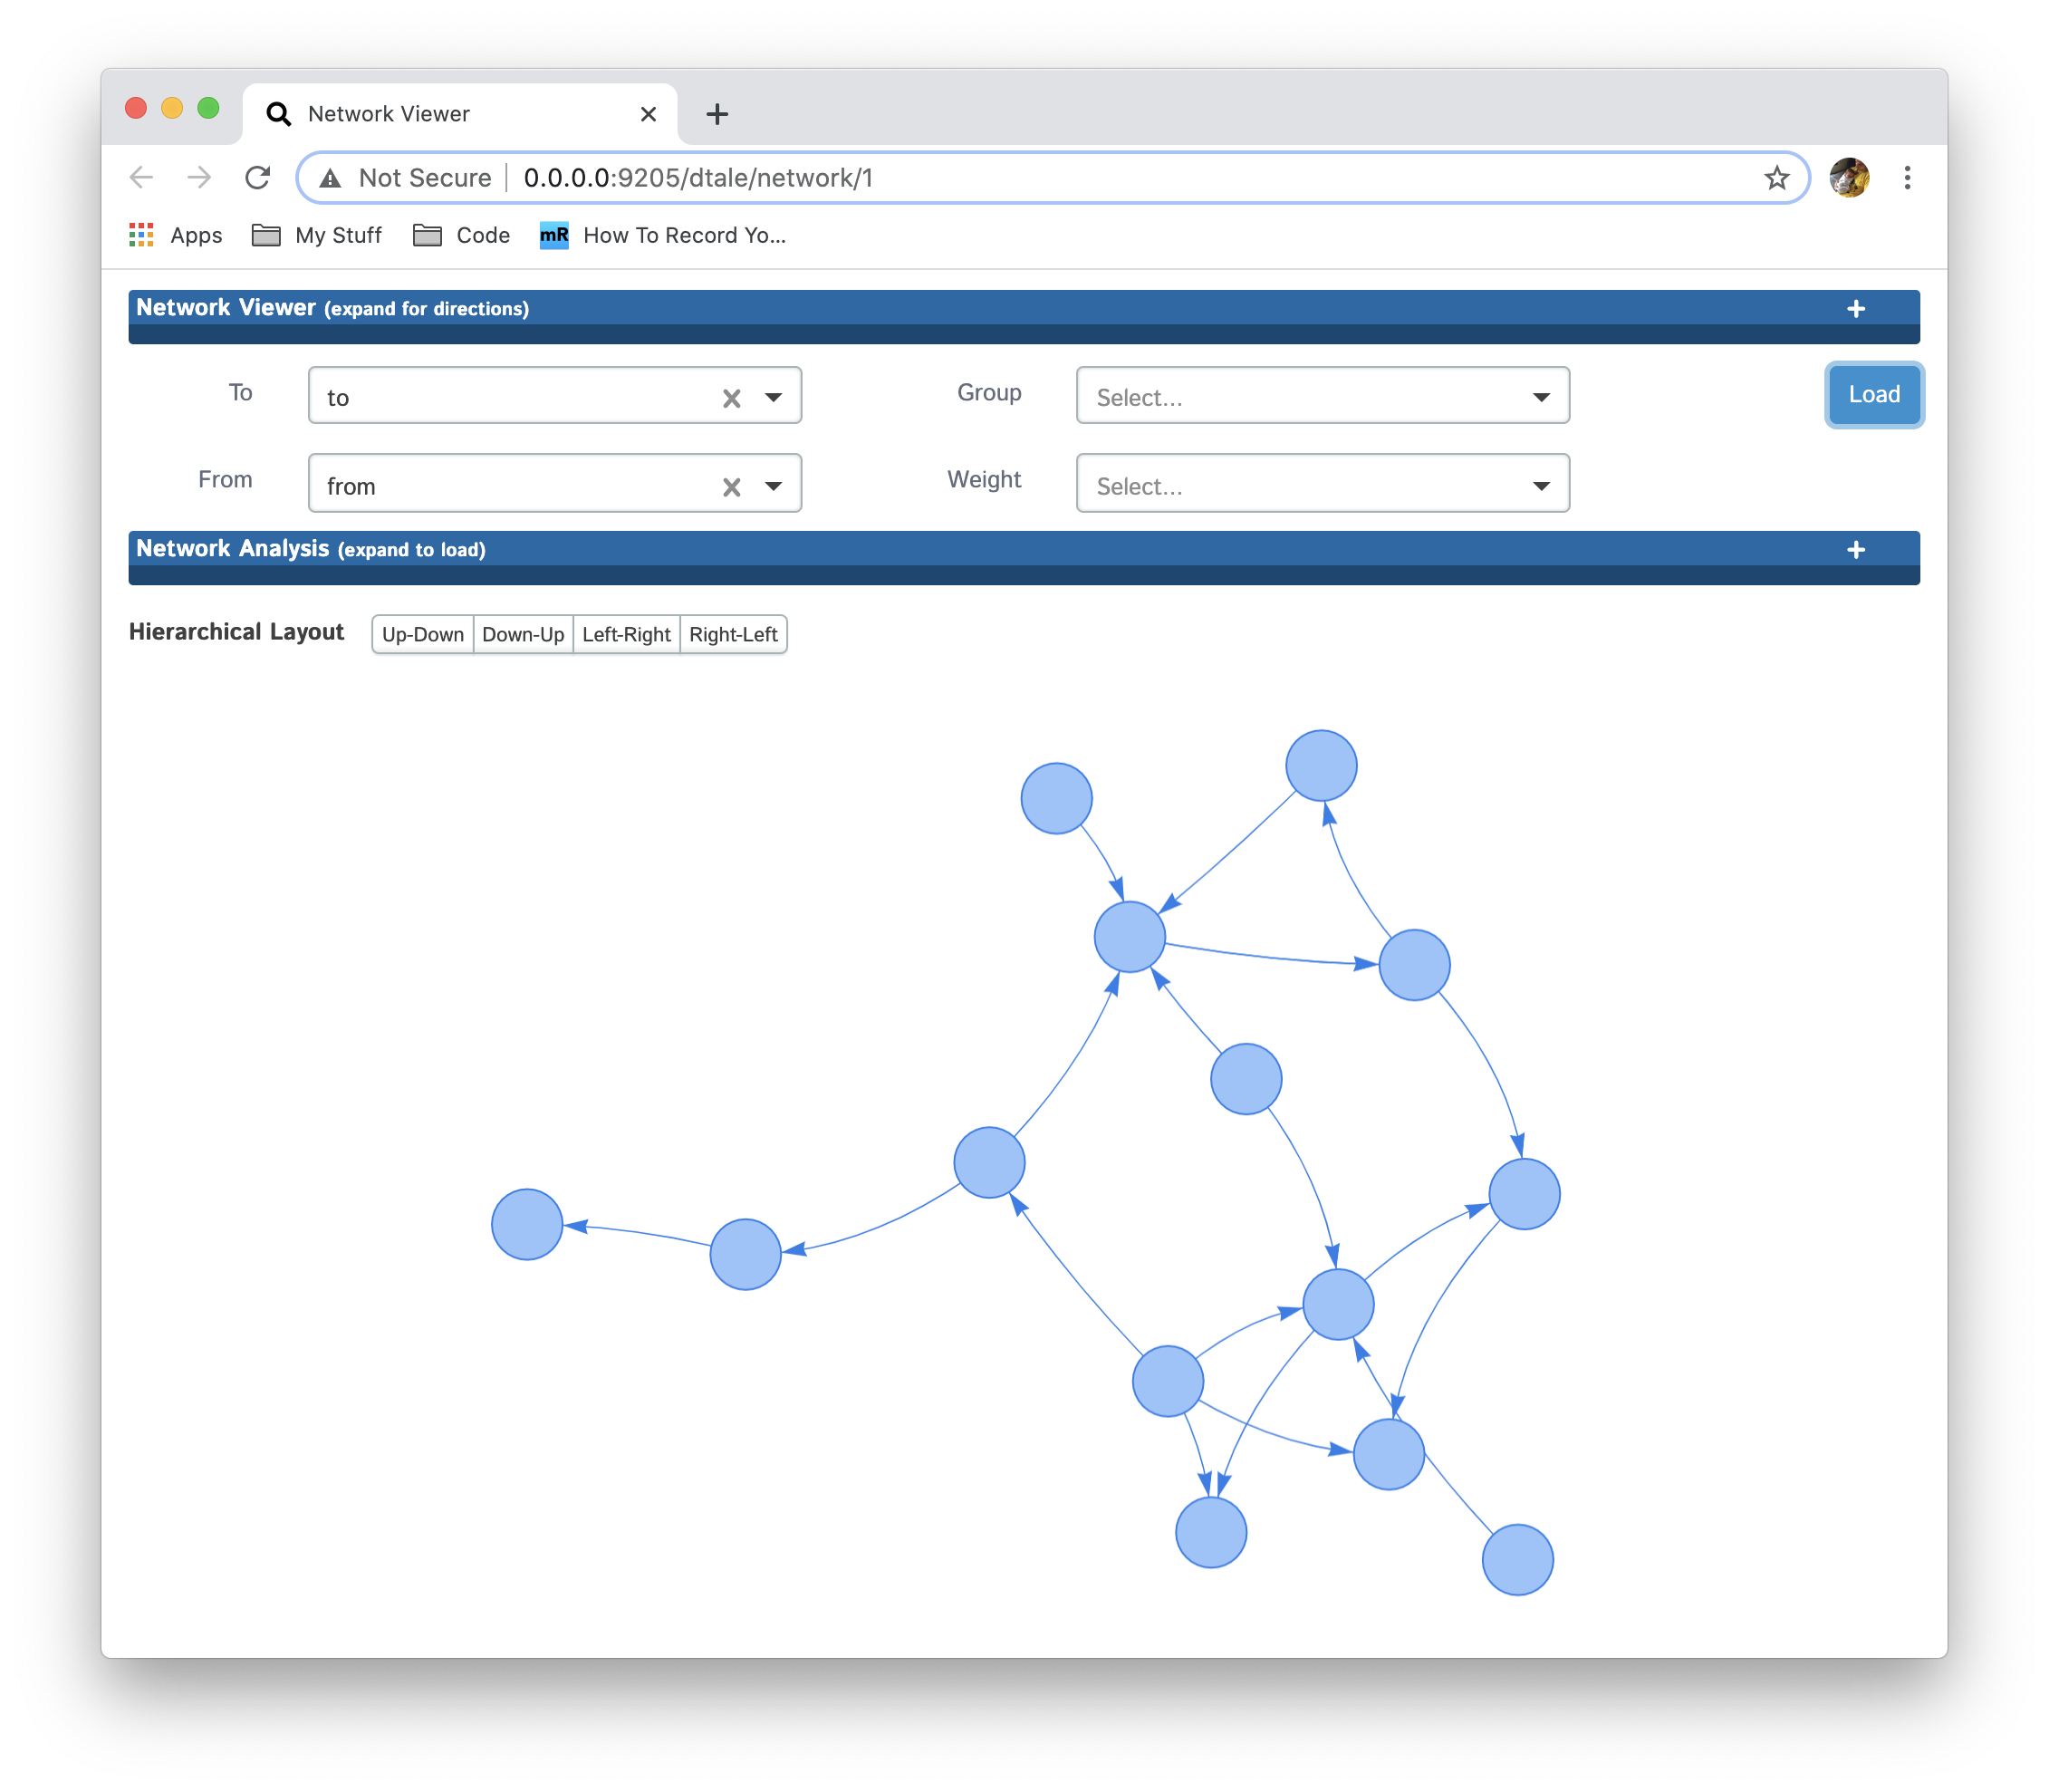
You can also see instructions on to interact with the network by expanding the directions section by clicking on the header "Network Viewer" at the top. You can also view details about the network provided by the package networkx by clicking the header "Network Analysis".

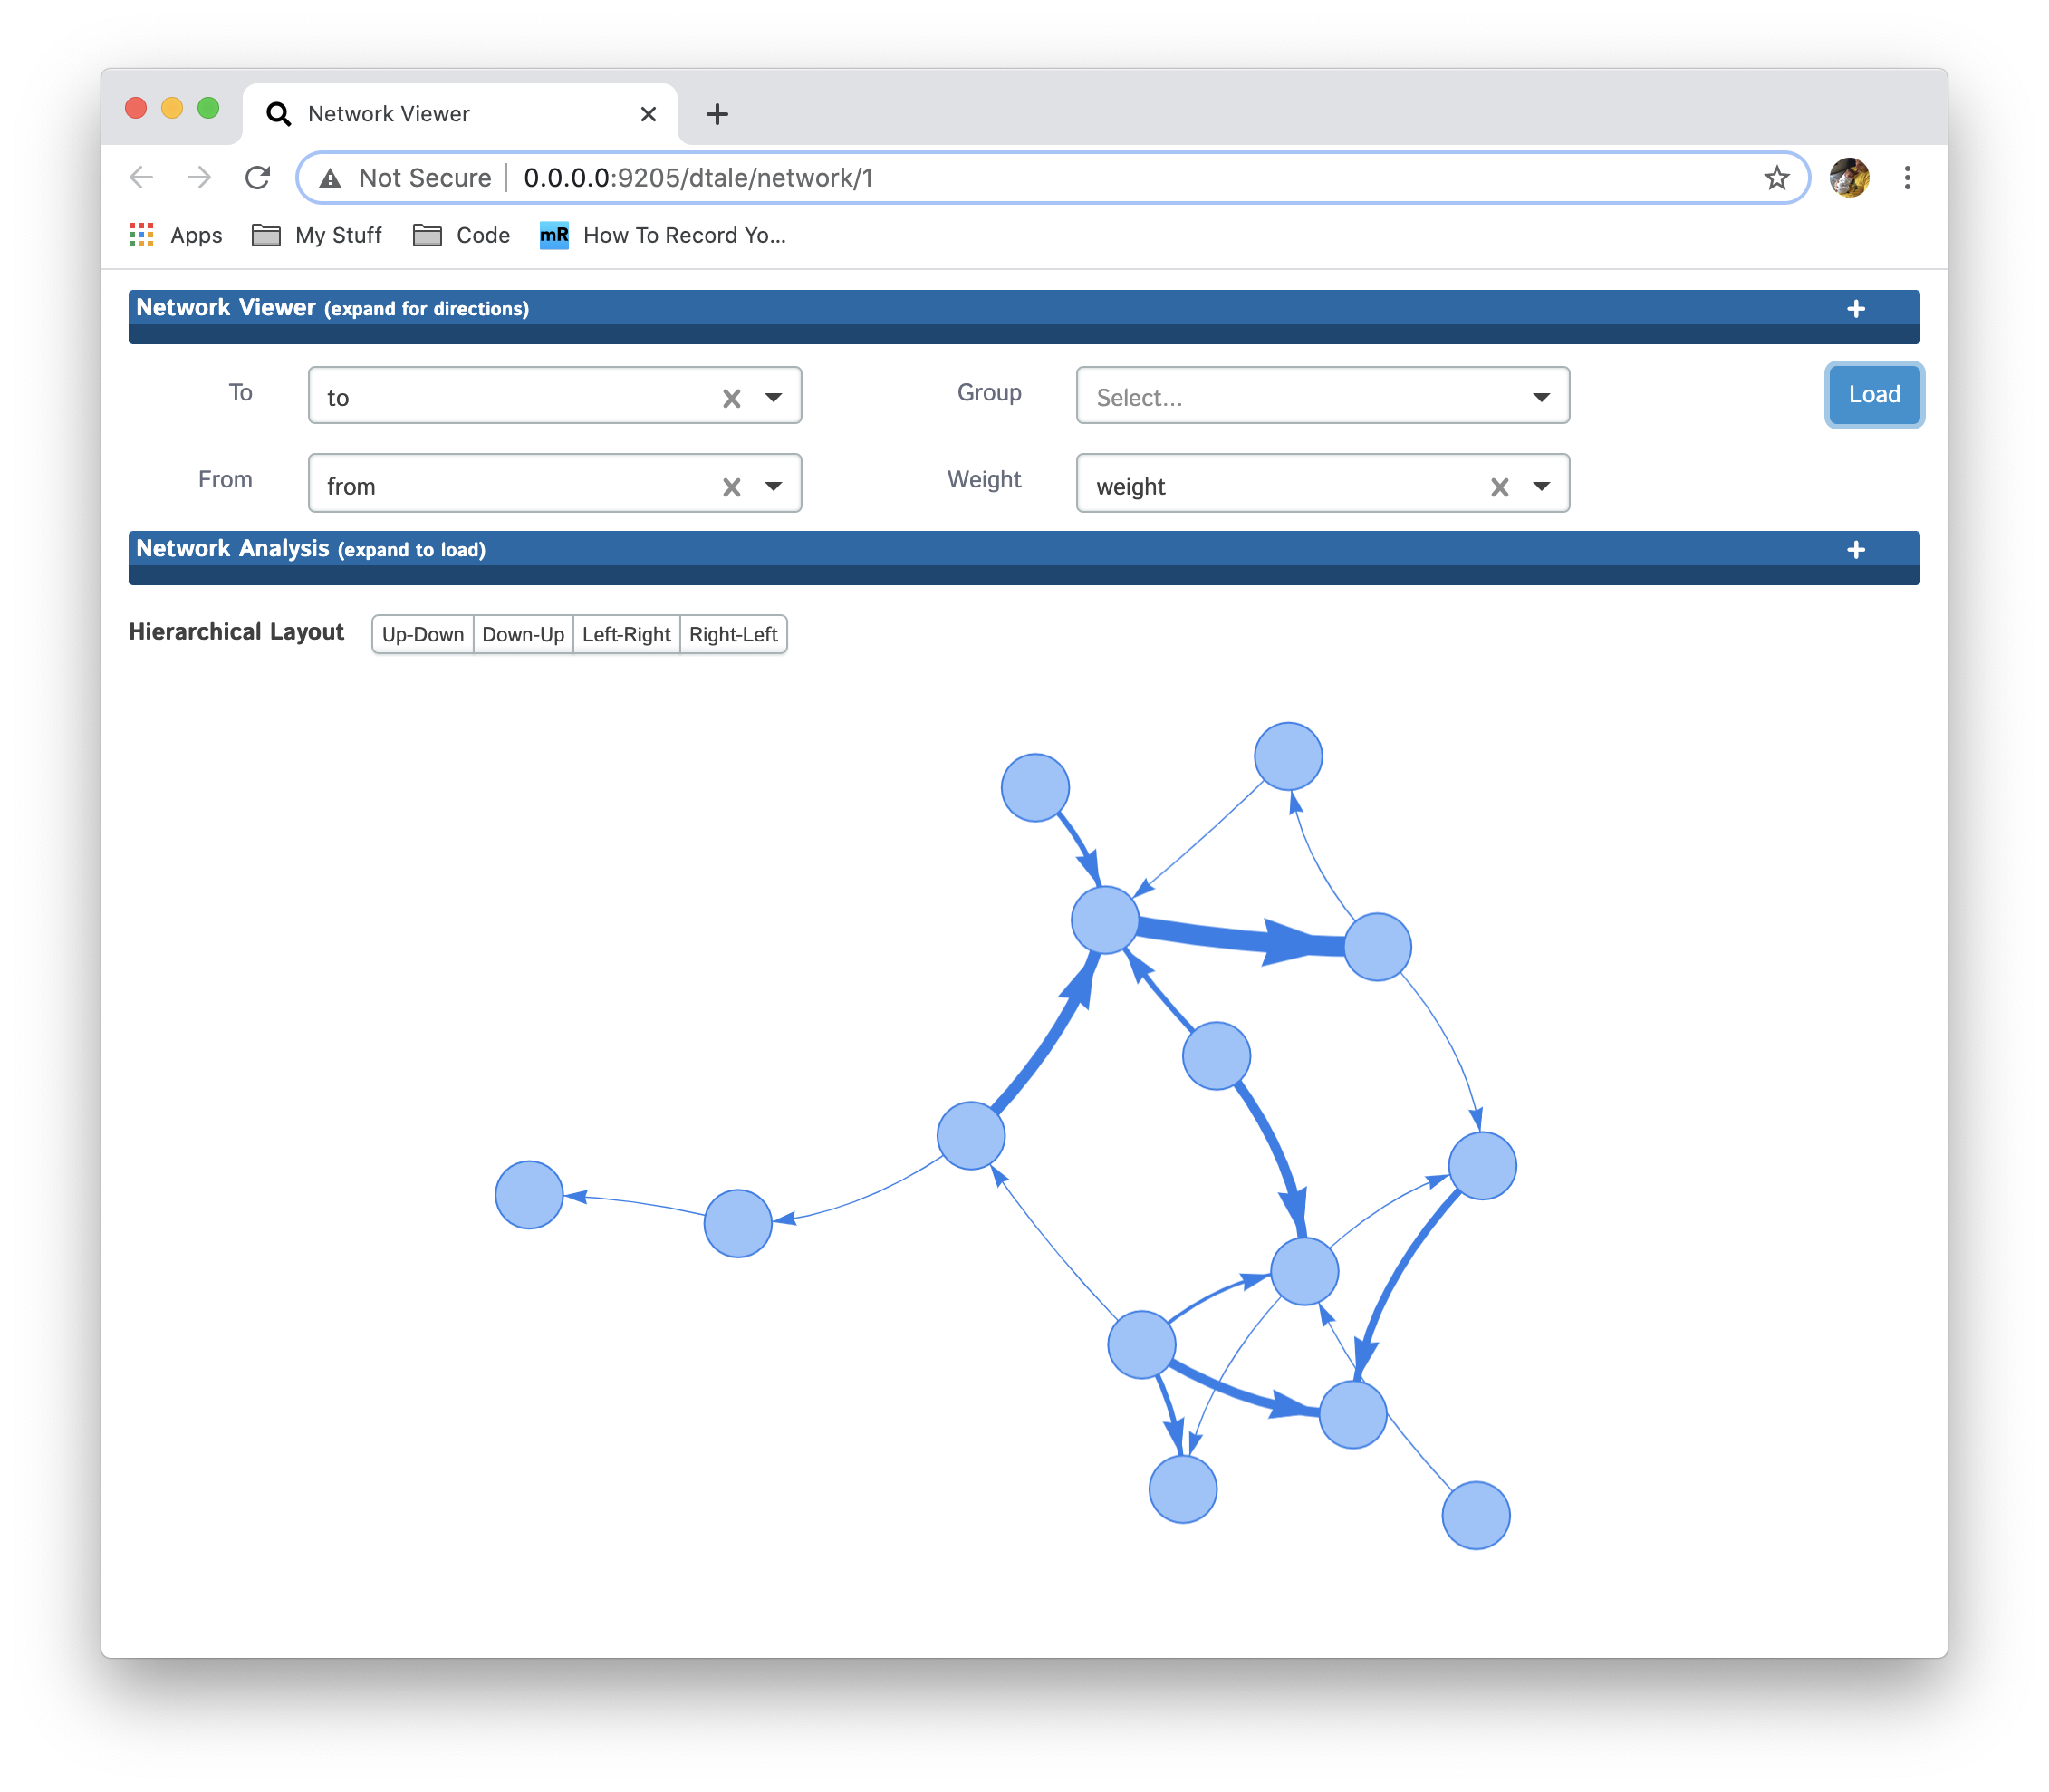
Select a column containing weighting for the edges of the nodes in the "Weight" column and click "Load":
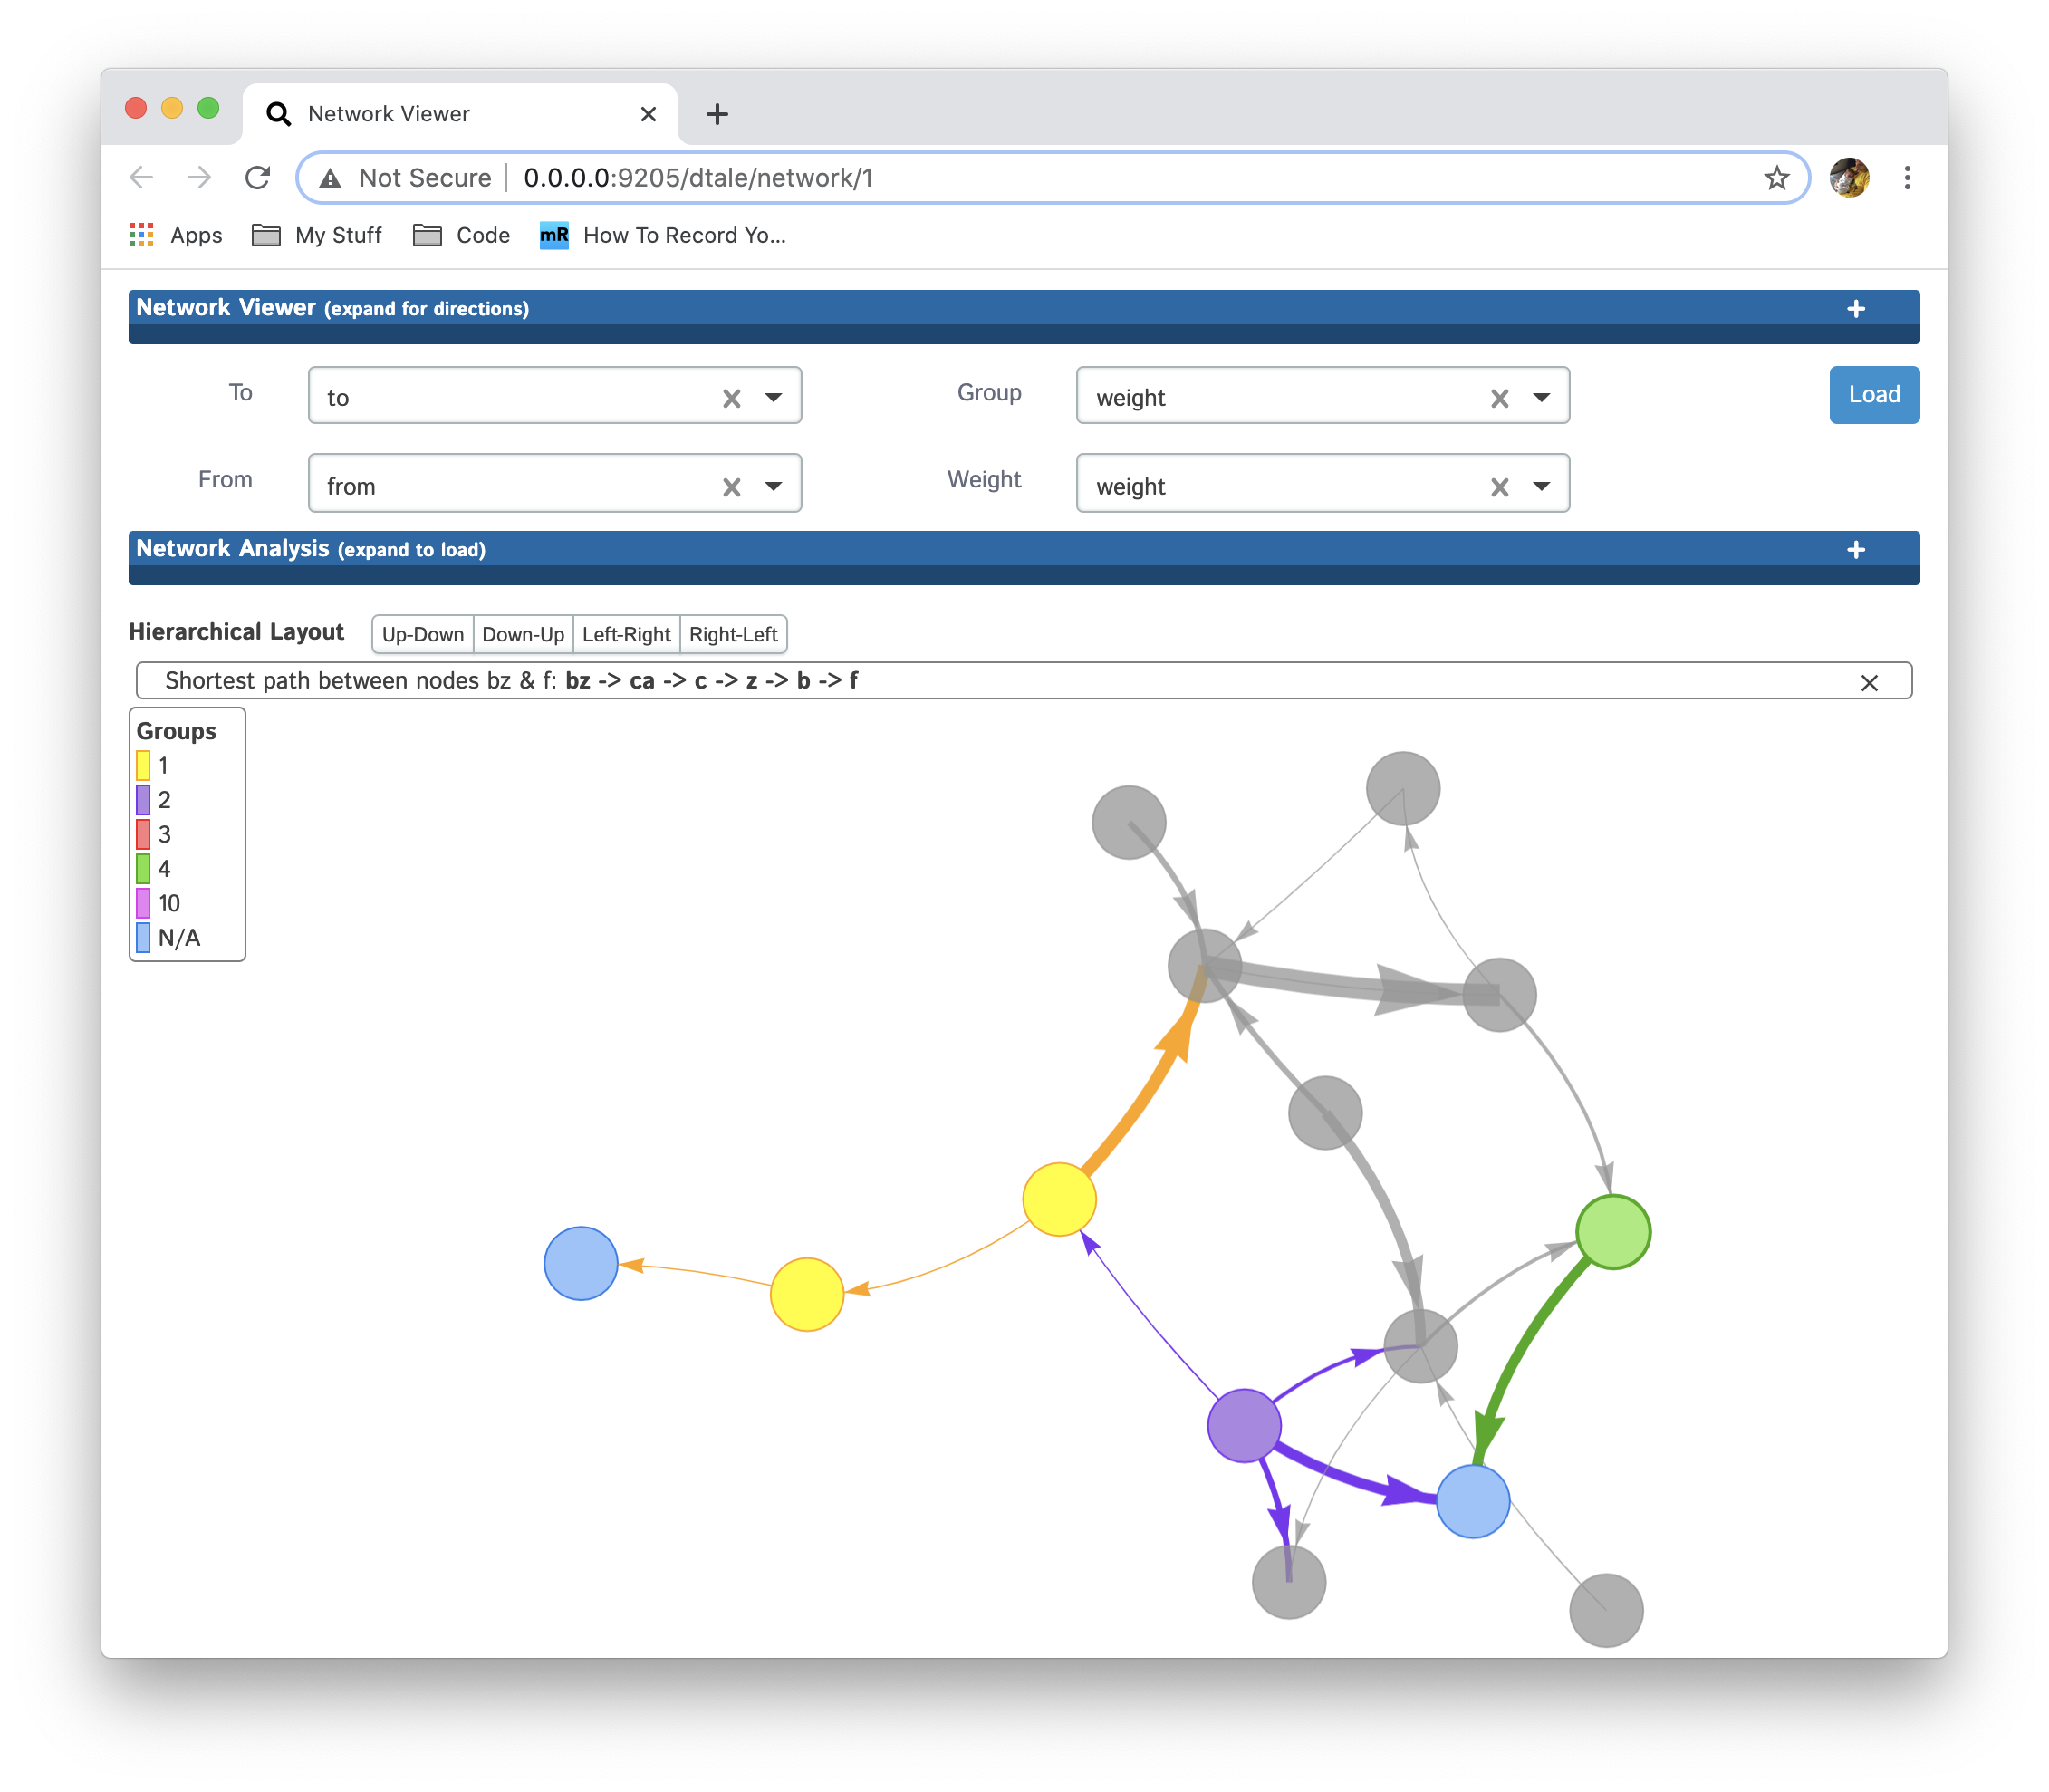
Select a column containing group information for each node in the "From" column by populating "Group" and then clicking "Load":

Perform shortest path analysis by doing a Shift+Click on two nodes:
View direct descendants of each node by clicking on it:
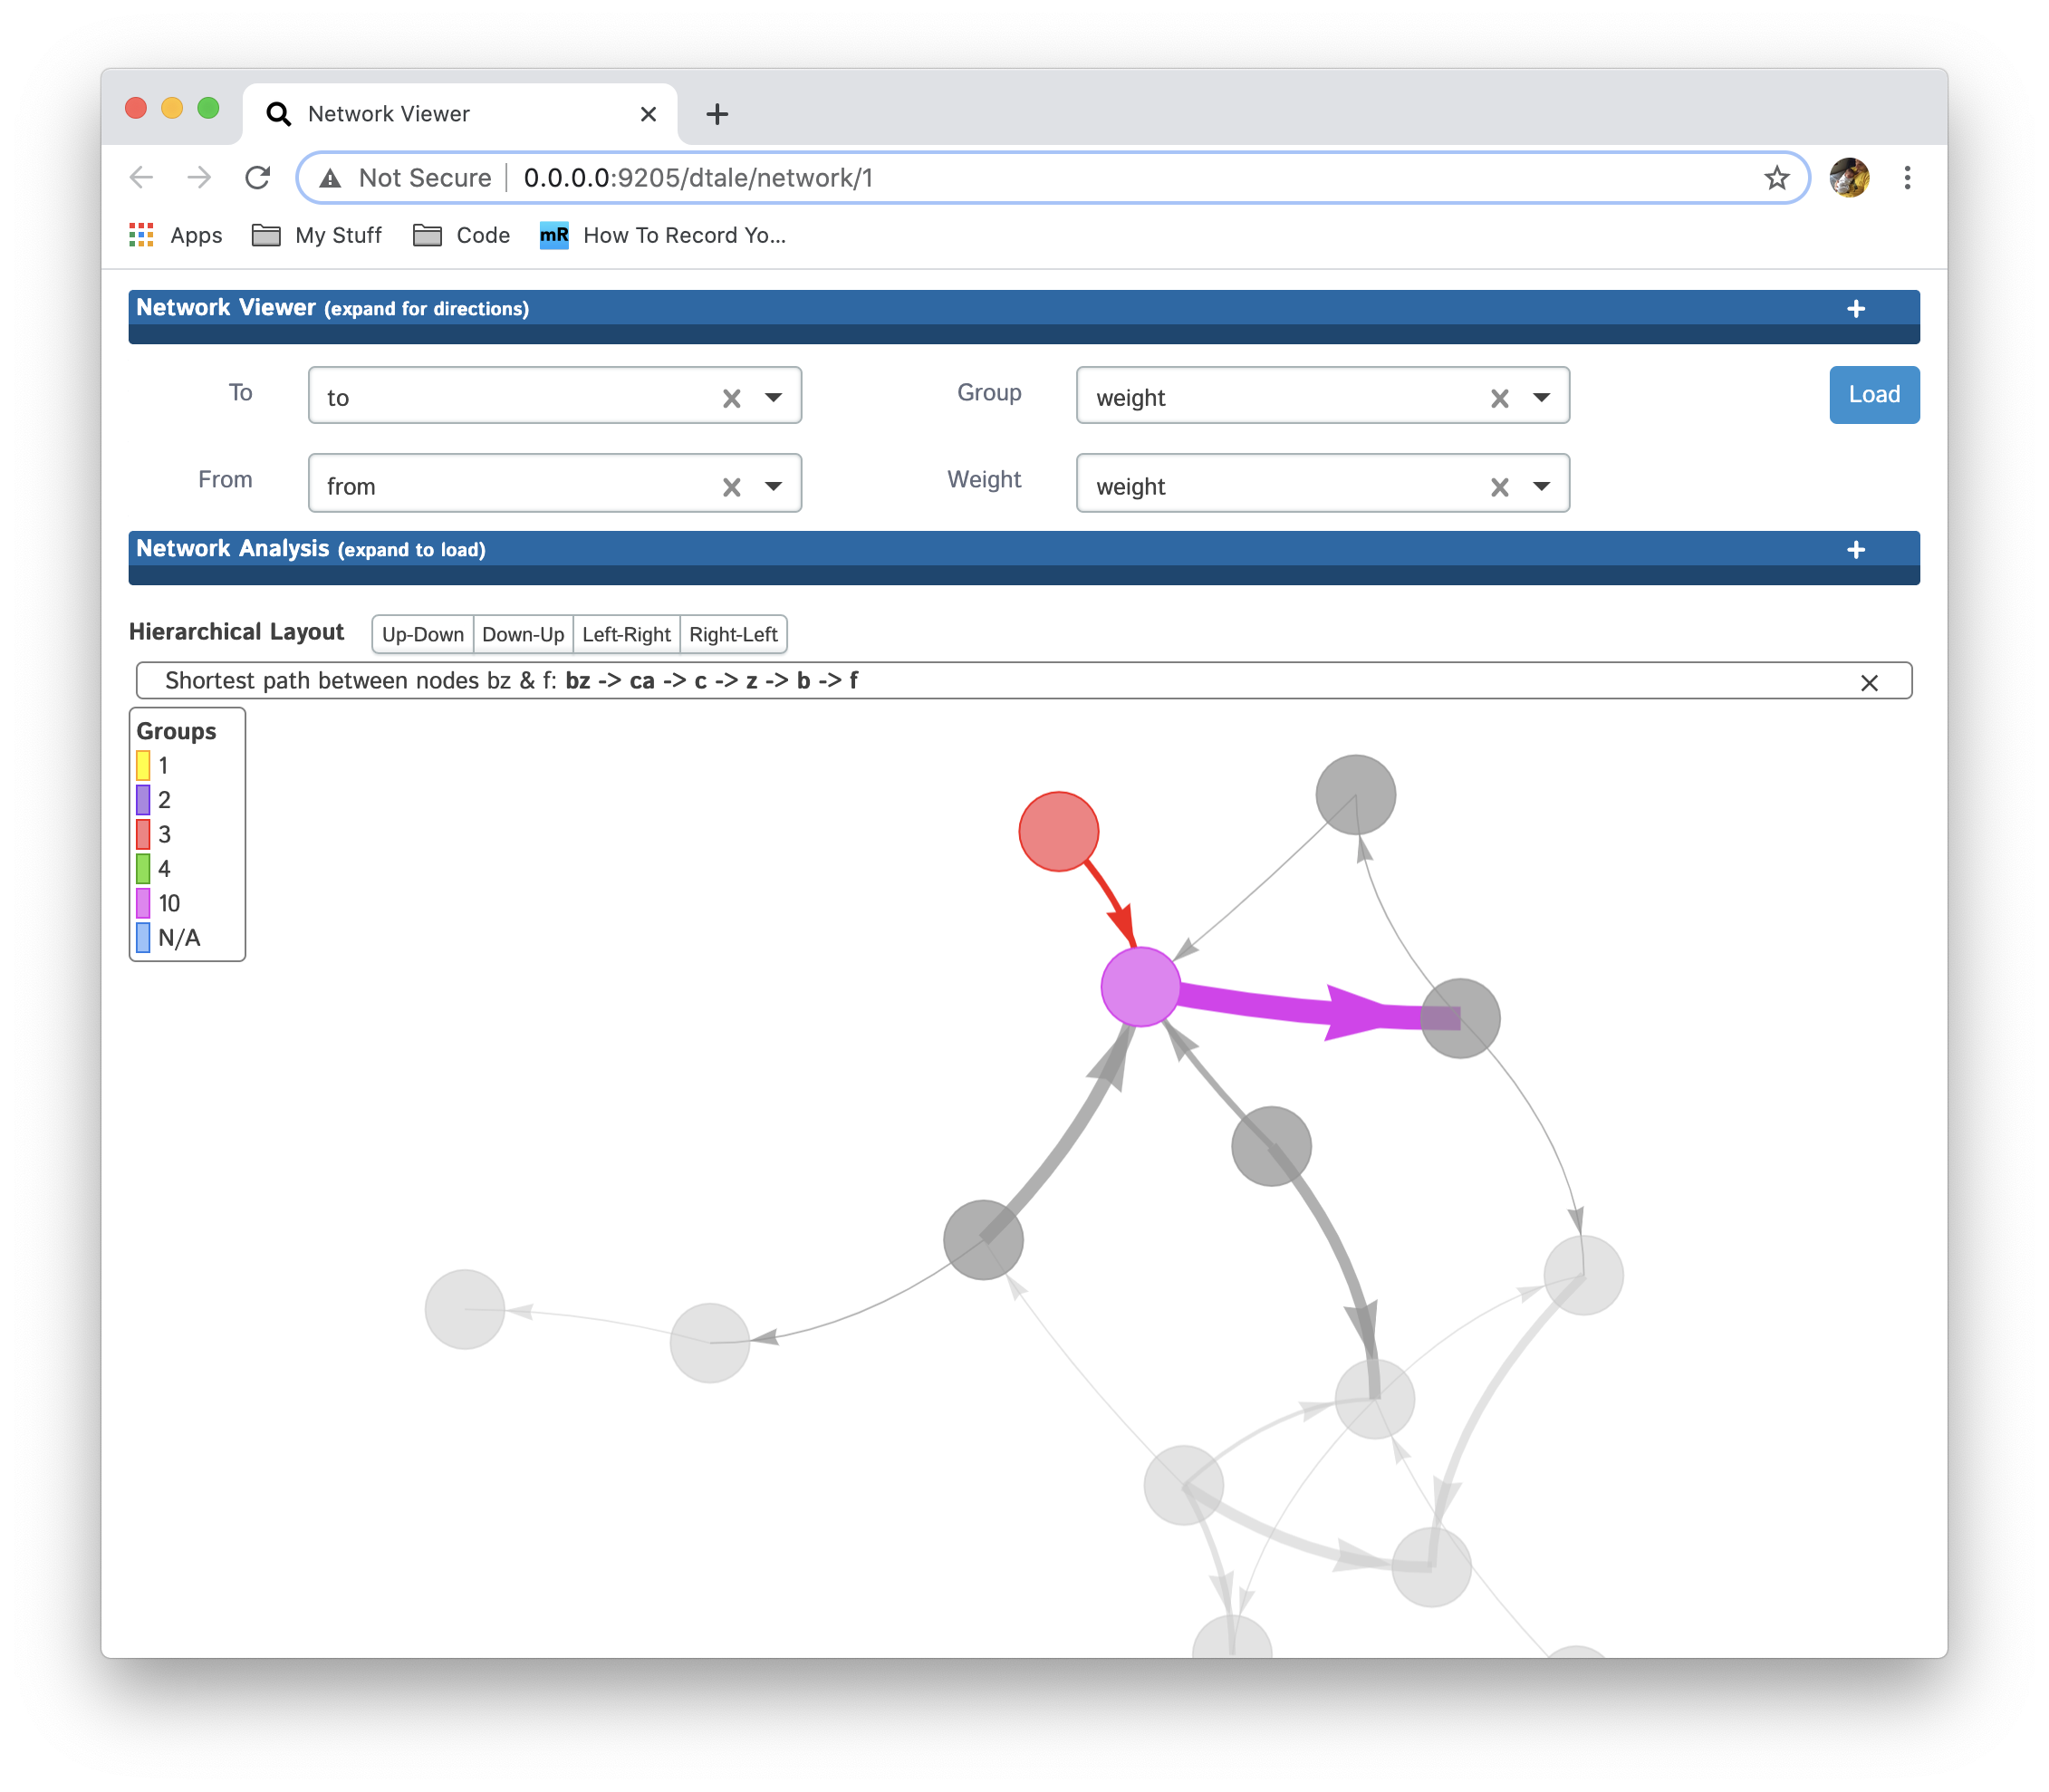
You can zoom in on nodes by double-clicking and zoom back out by pressing "Esc".
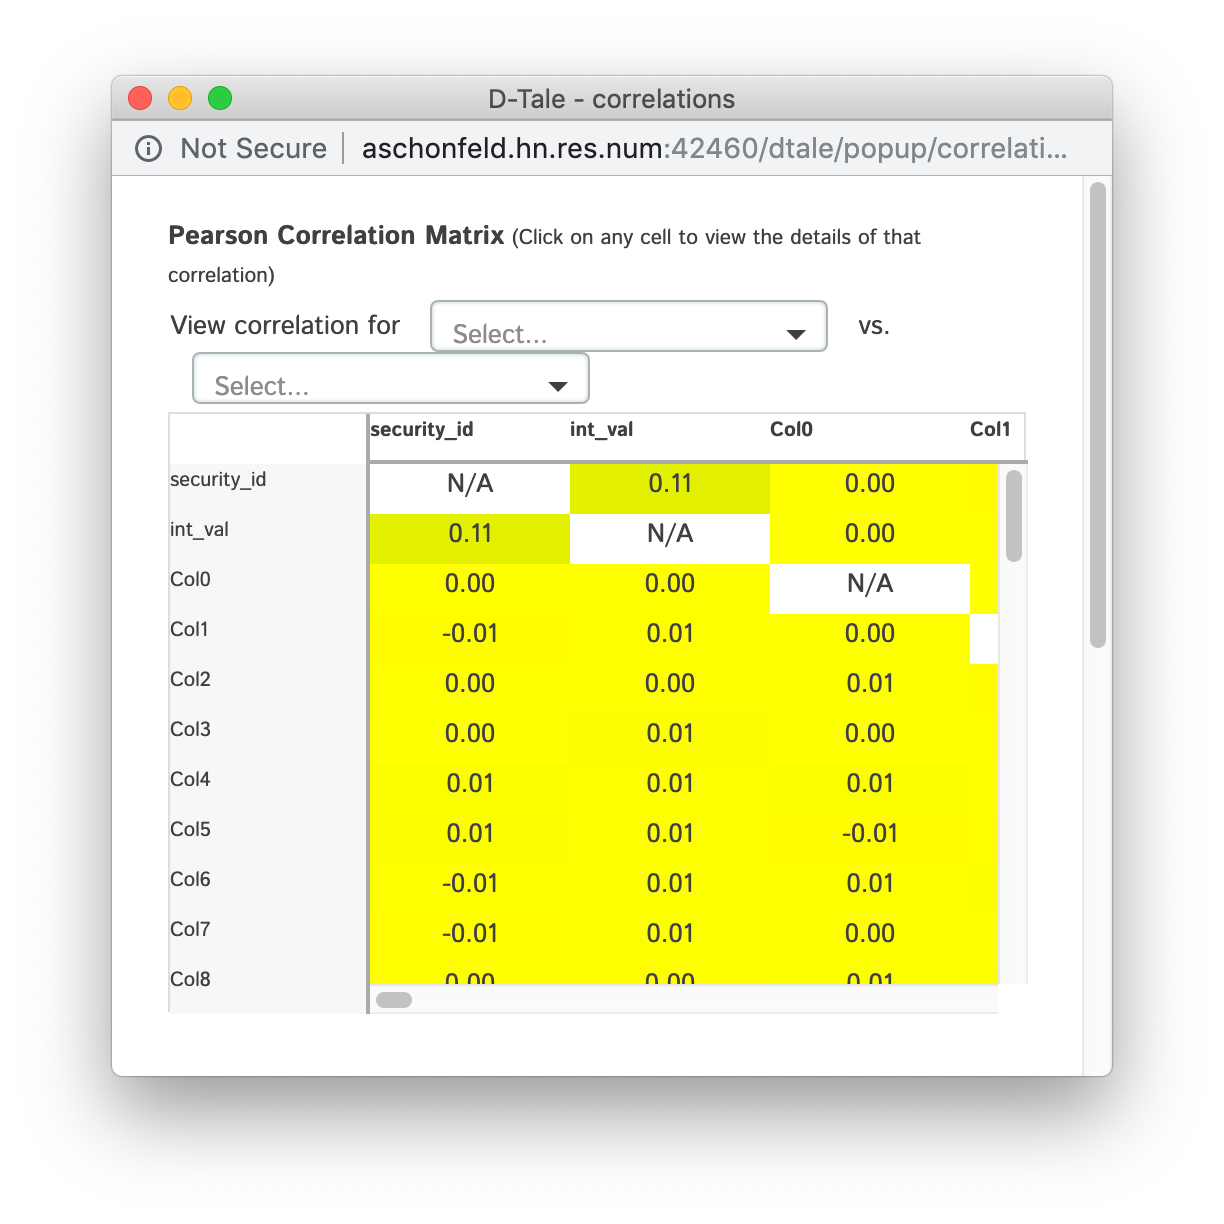
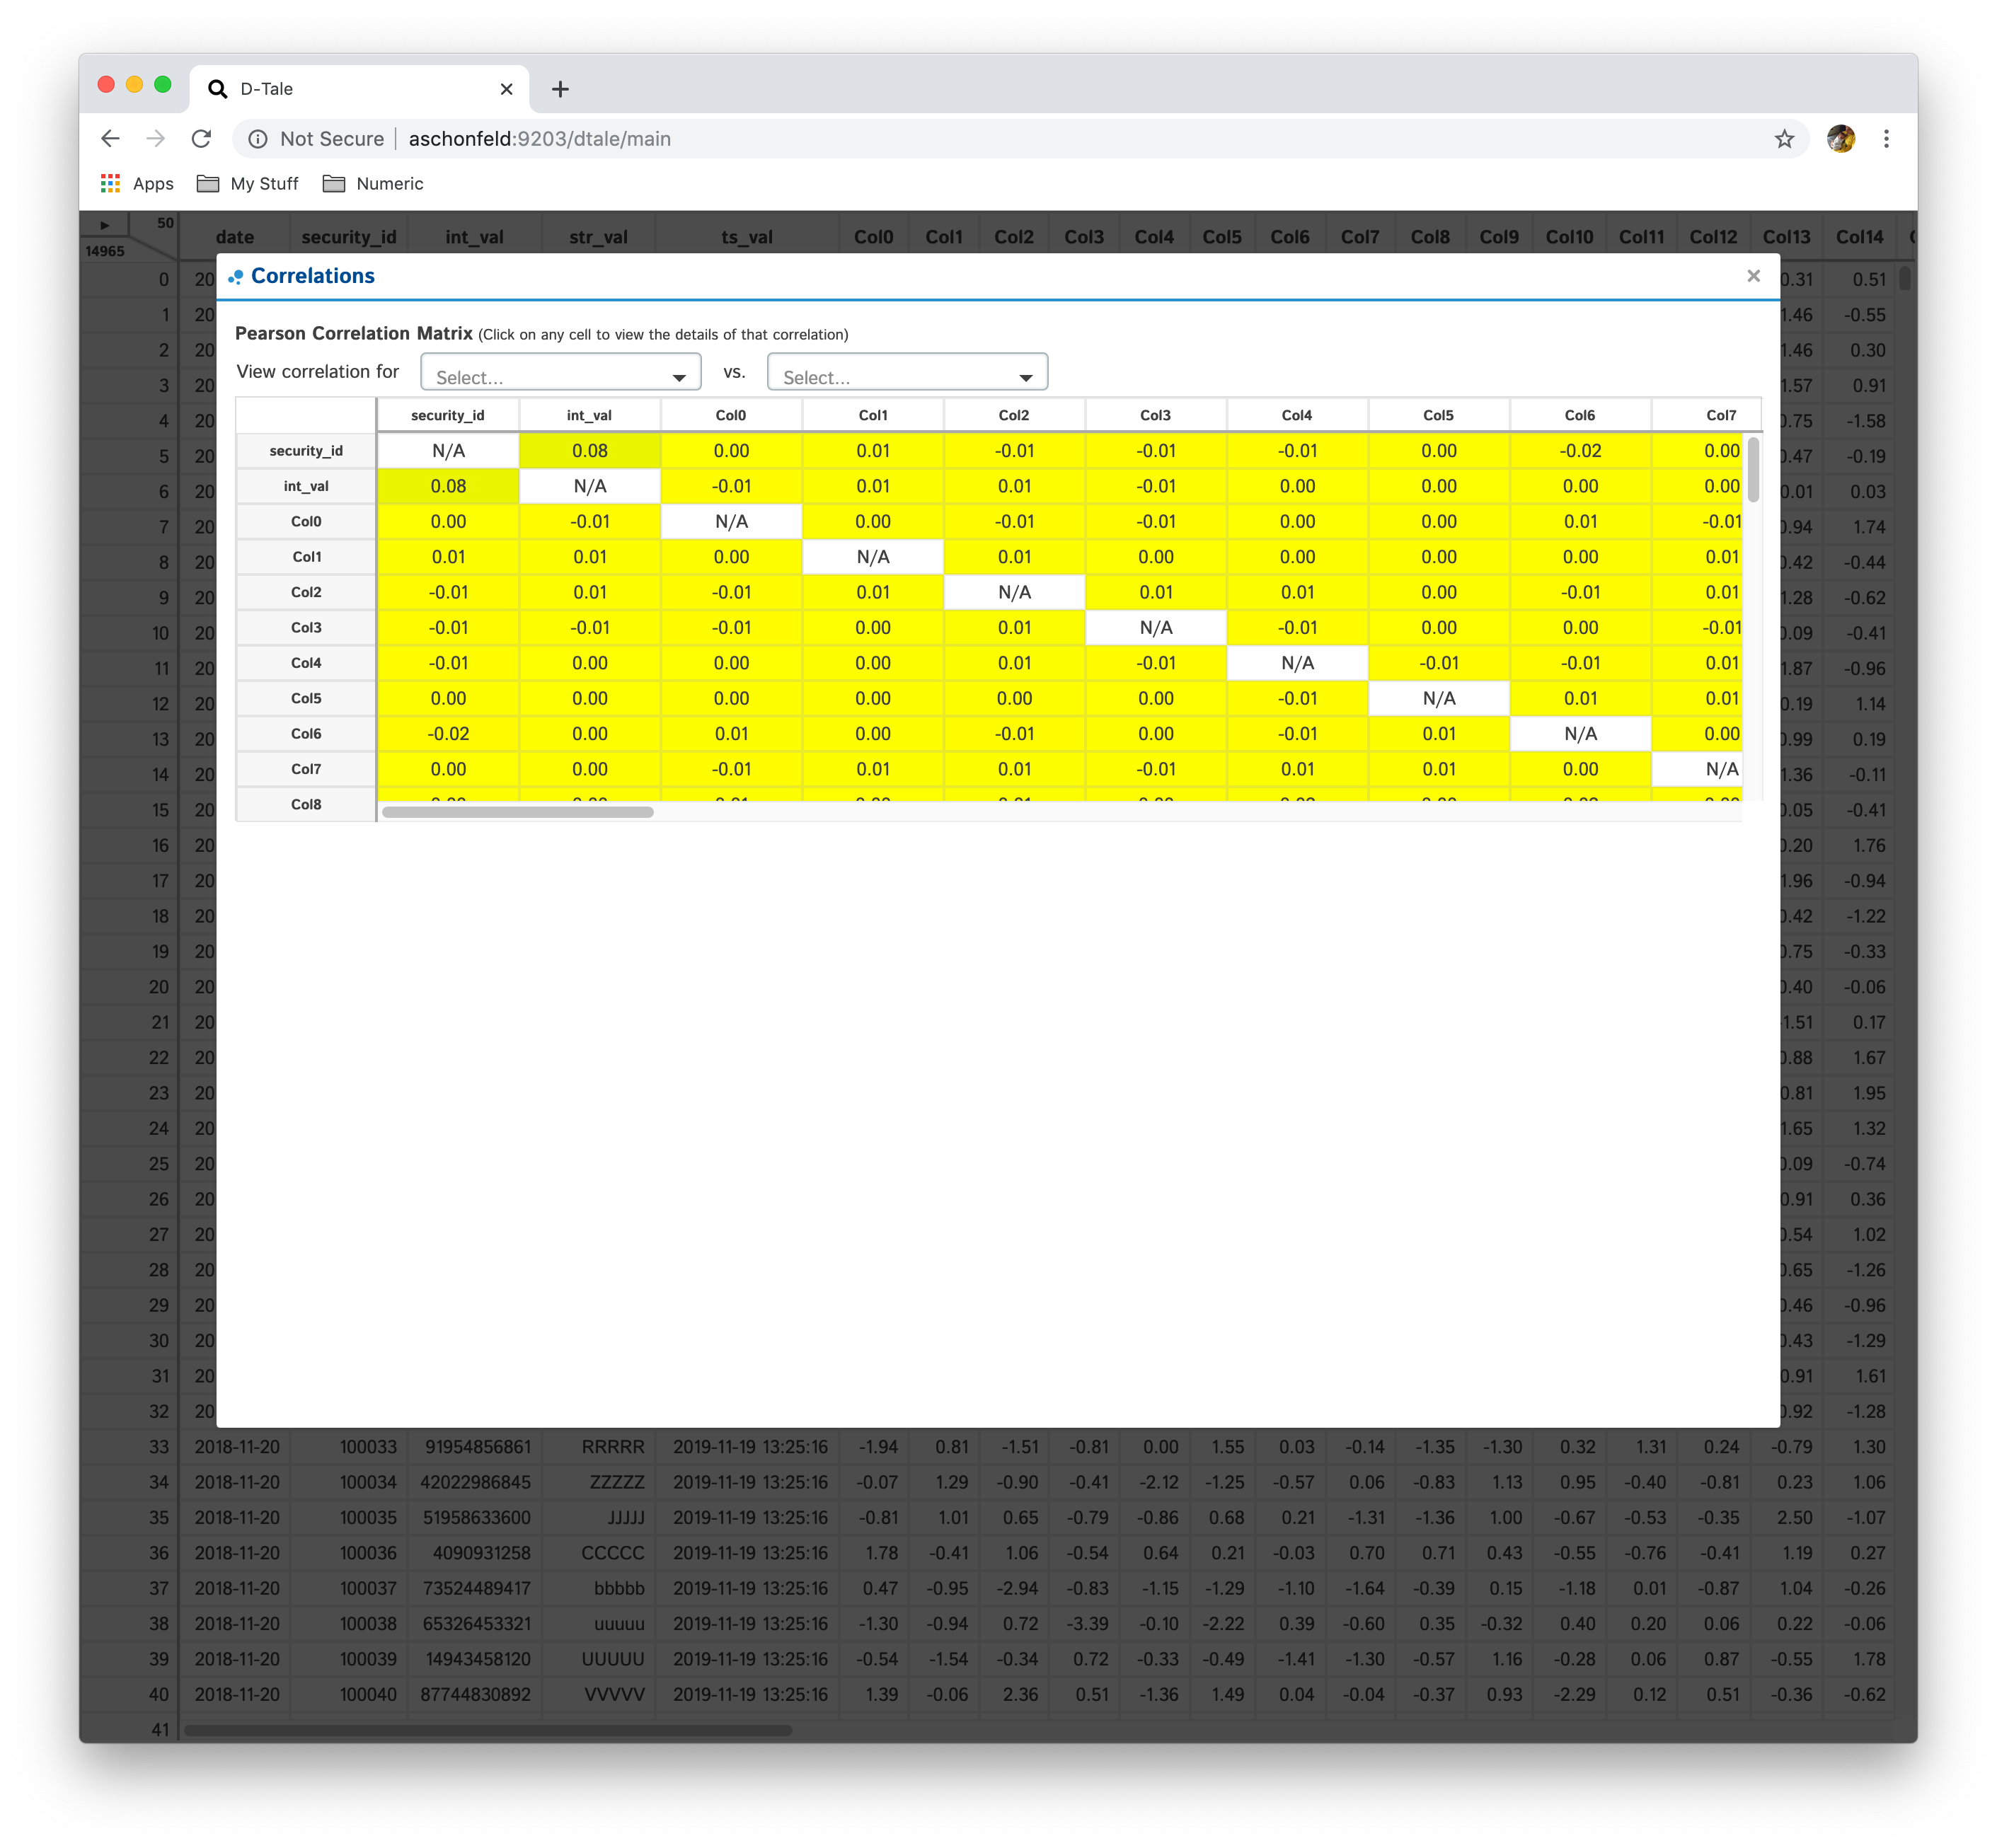
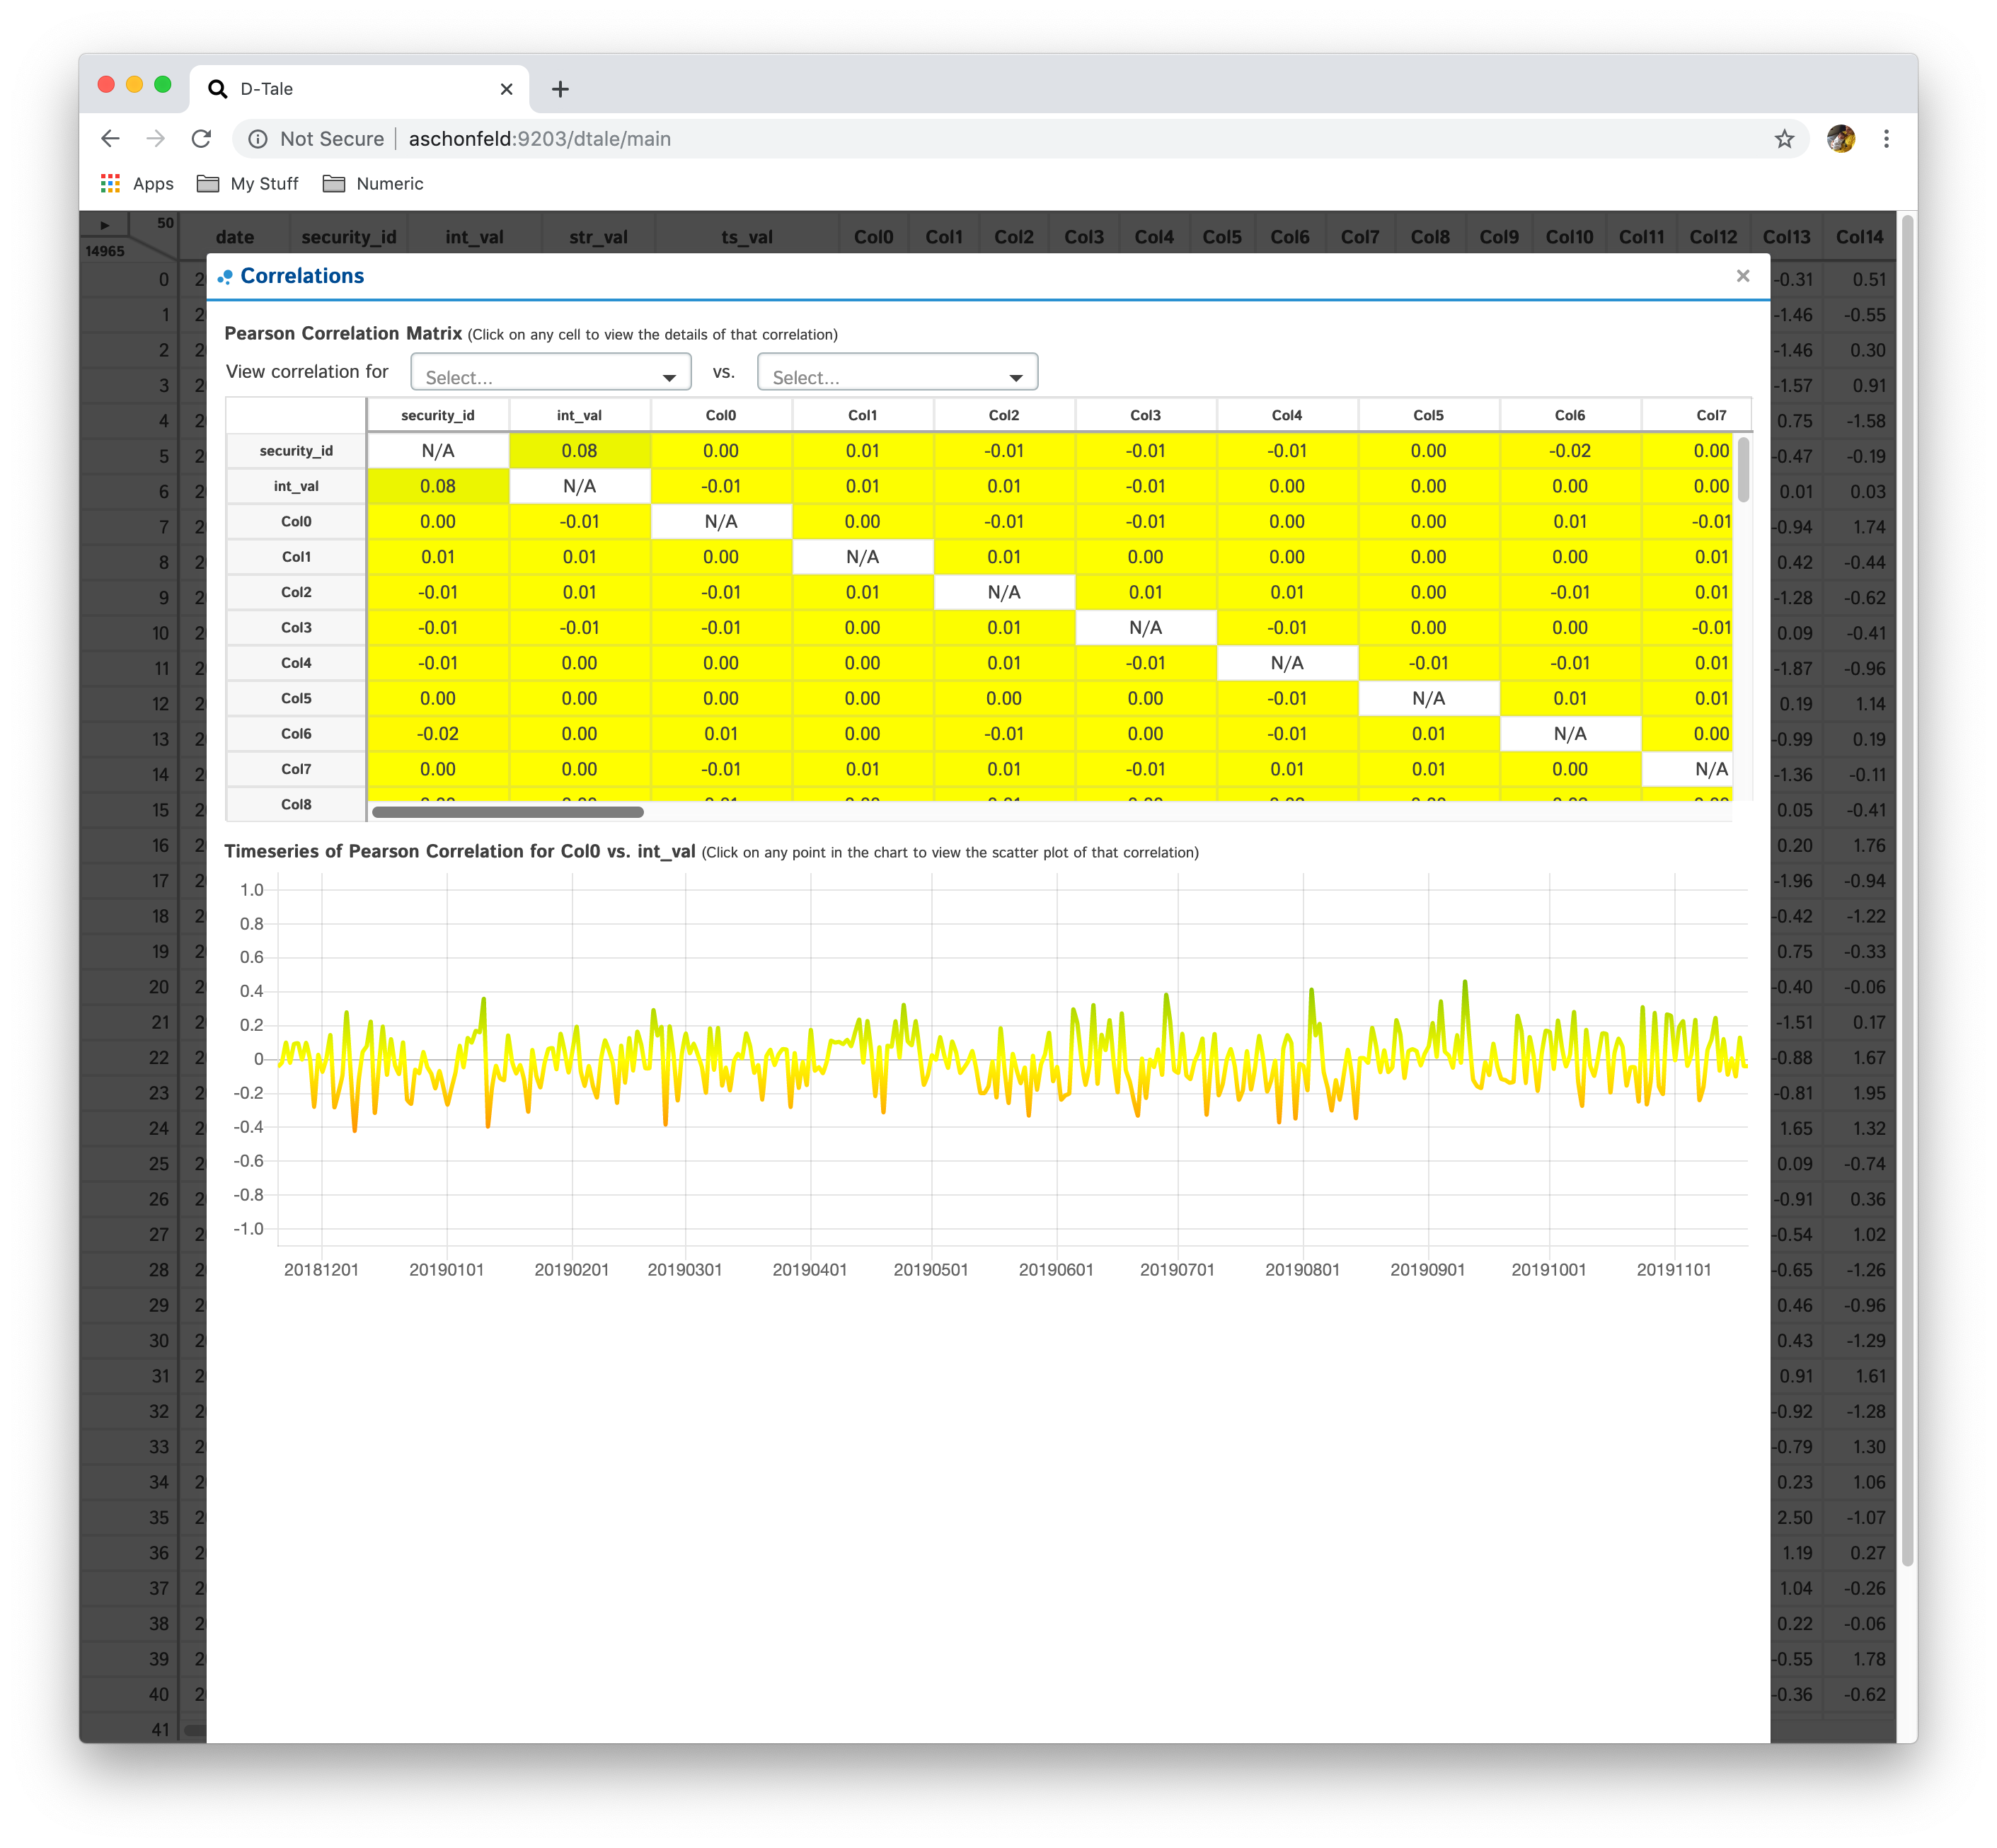
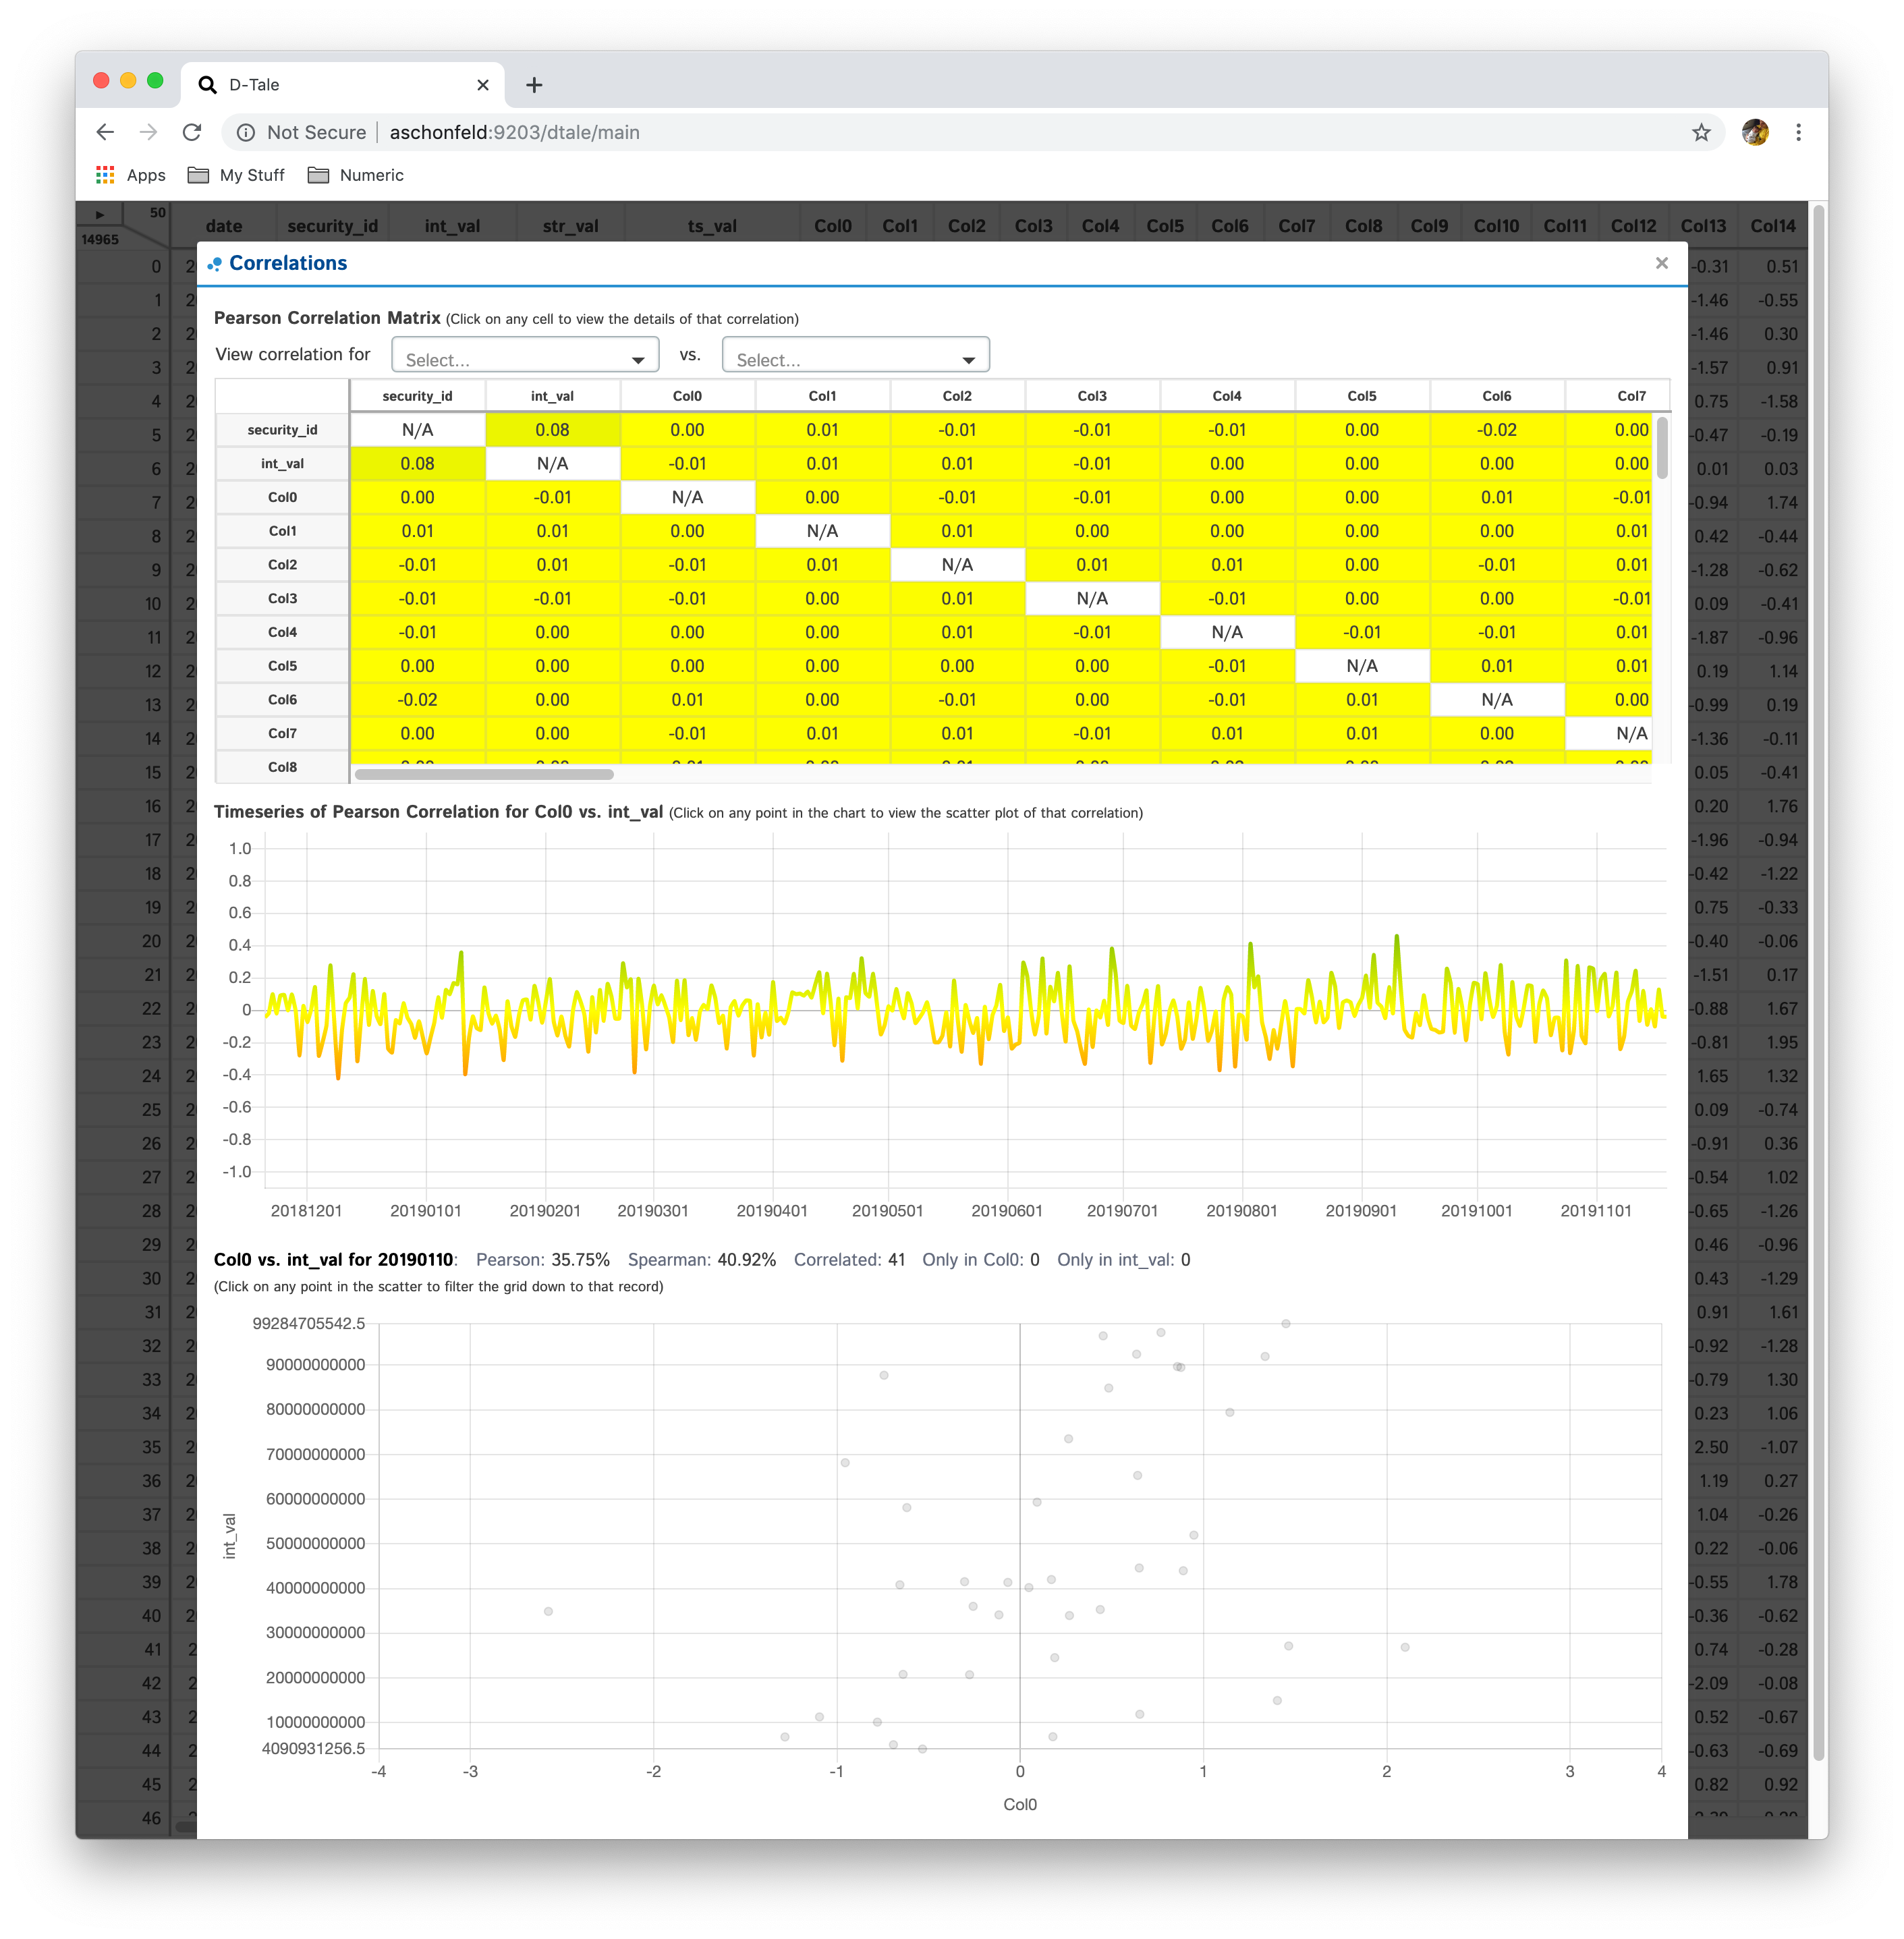
Correlations
Shows a pearson correlation matrix of all numeric columns against all other numeric columns
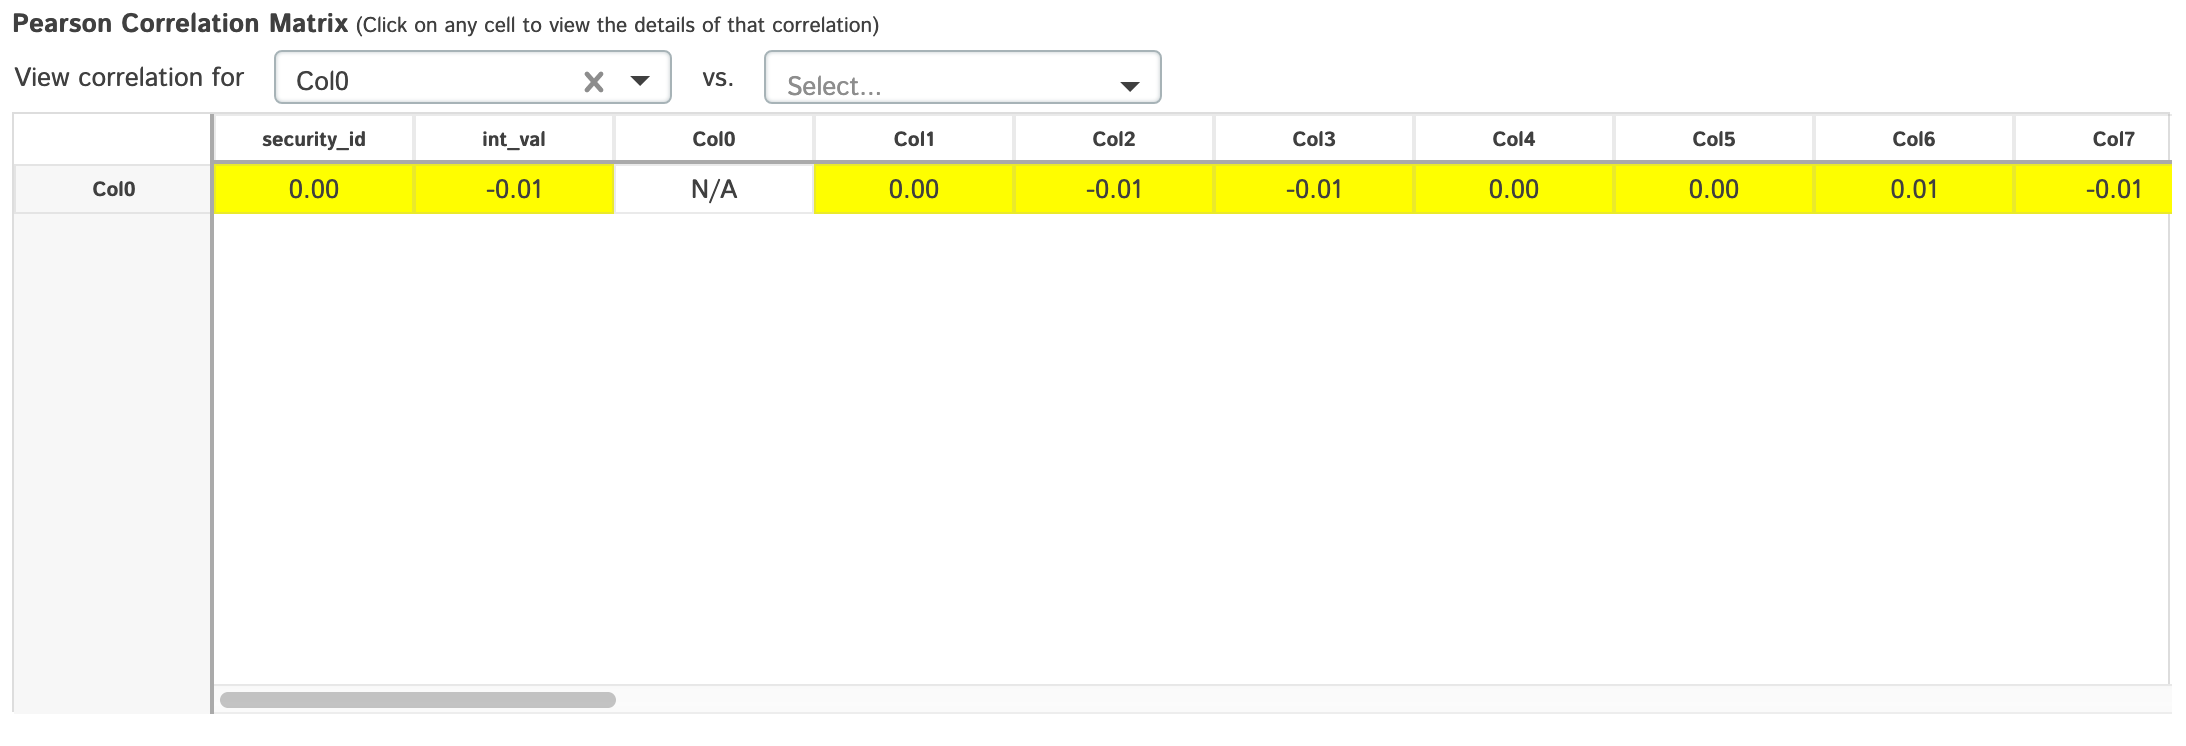
- By default, it will show a grid of pearson correlations (filtering available by using drop-down see 2nd table of screenshots)
- If you have a date-type column, you can click an individual cell and see a timeseries of pearson correlations for that column combination
- Currently if you have multiple date-type columns you will have the ability to toggle between them by way of a drop-down
- Furthermore, you can click on individual points in the timeseries to view the scatter plot of the points going into that correlation
- Within the scatter plot section you can also view the details of the PPS for those data points in the chart by hovering over the number next to "PPS"
| Matrix | PPS | Timeseries | Scatter |
|---|---|---|---|
 |  |  |  |
| Col1 Filtered | Col2 Filtered | Col1 & Col2 Filtered |
|---|---|---|
 |  |  |
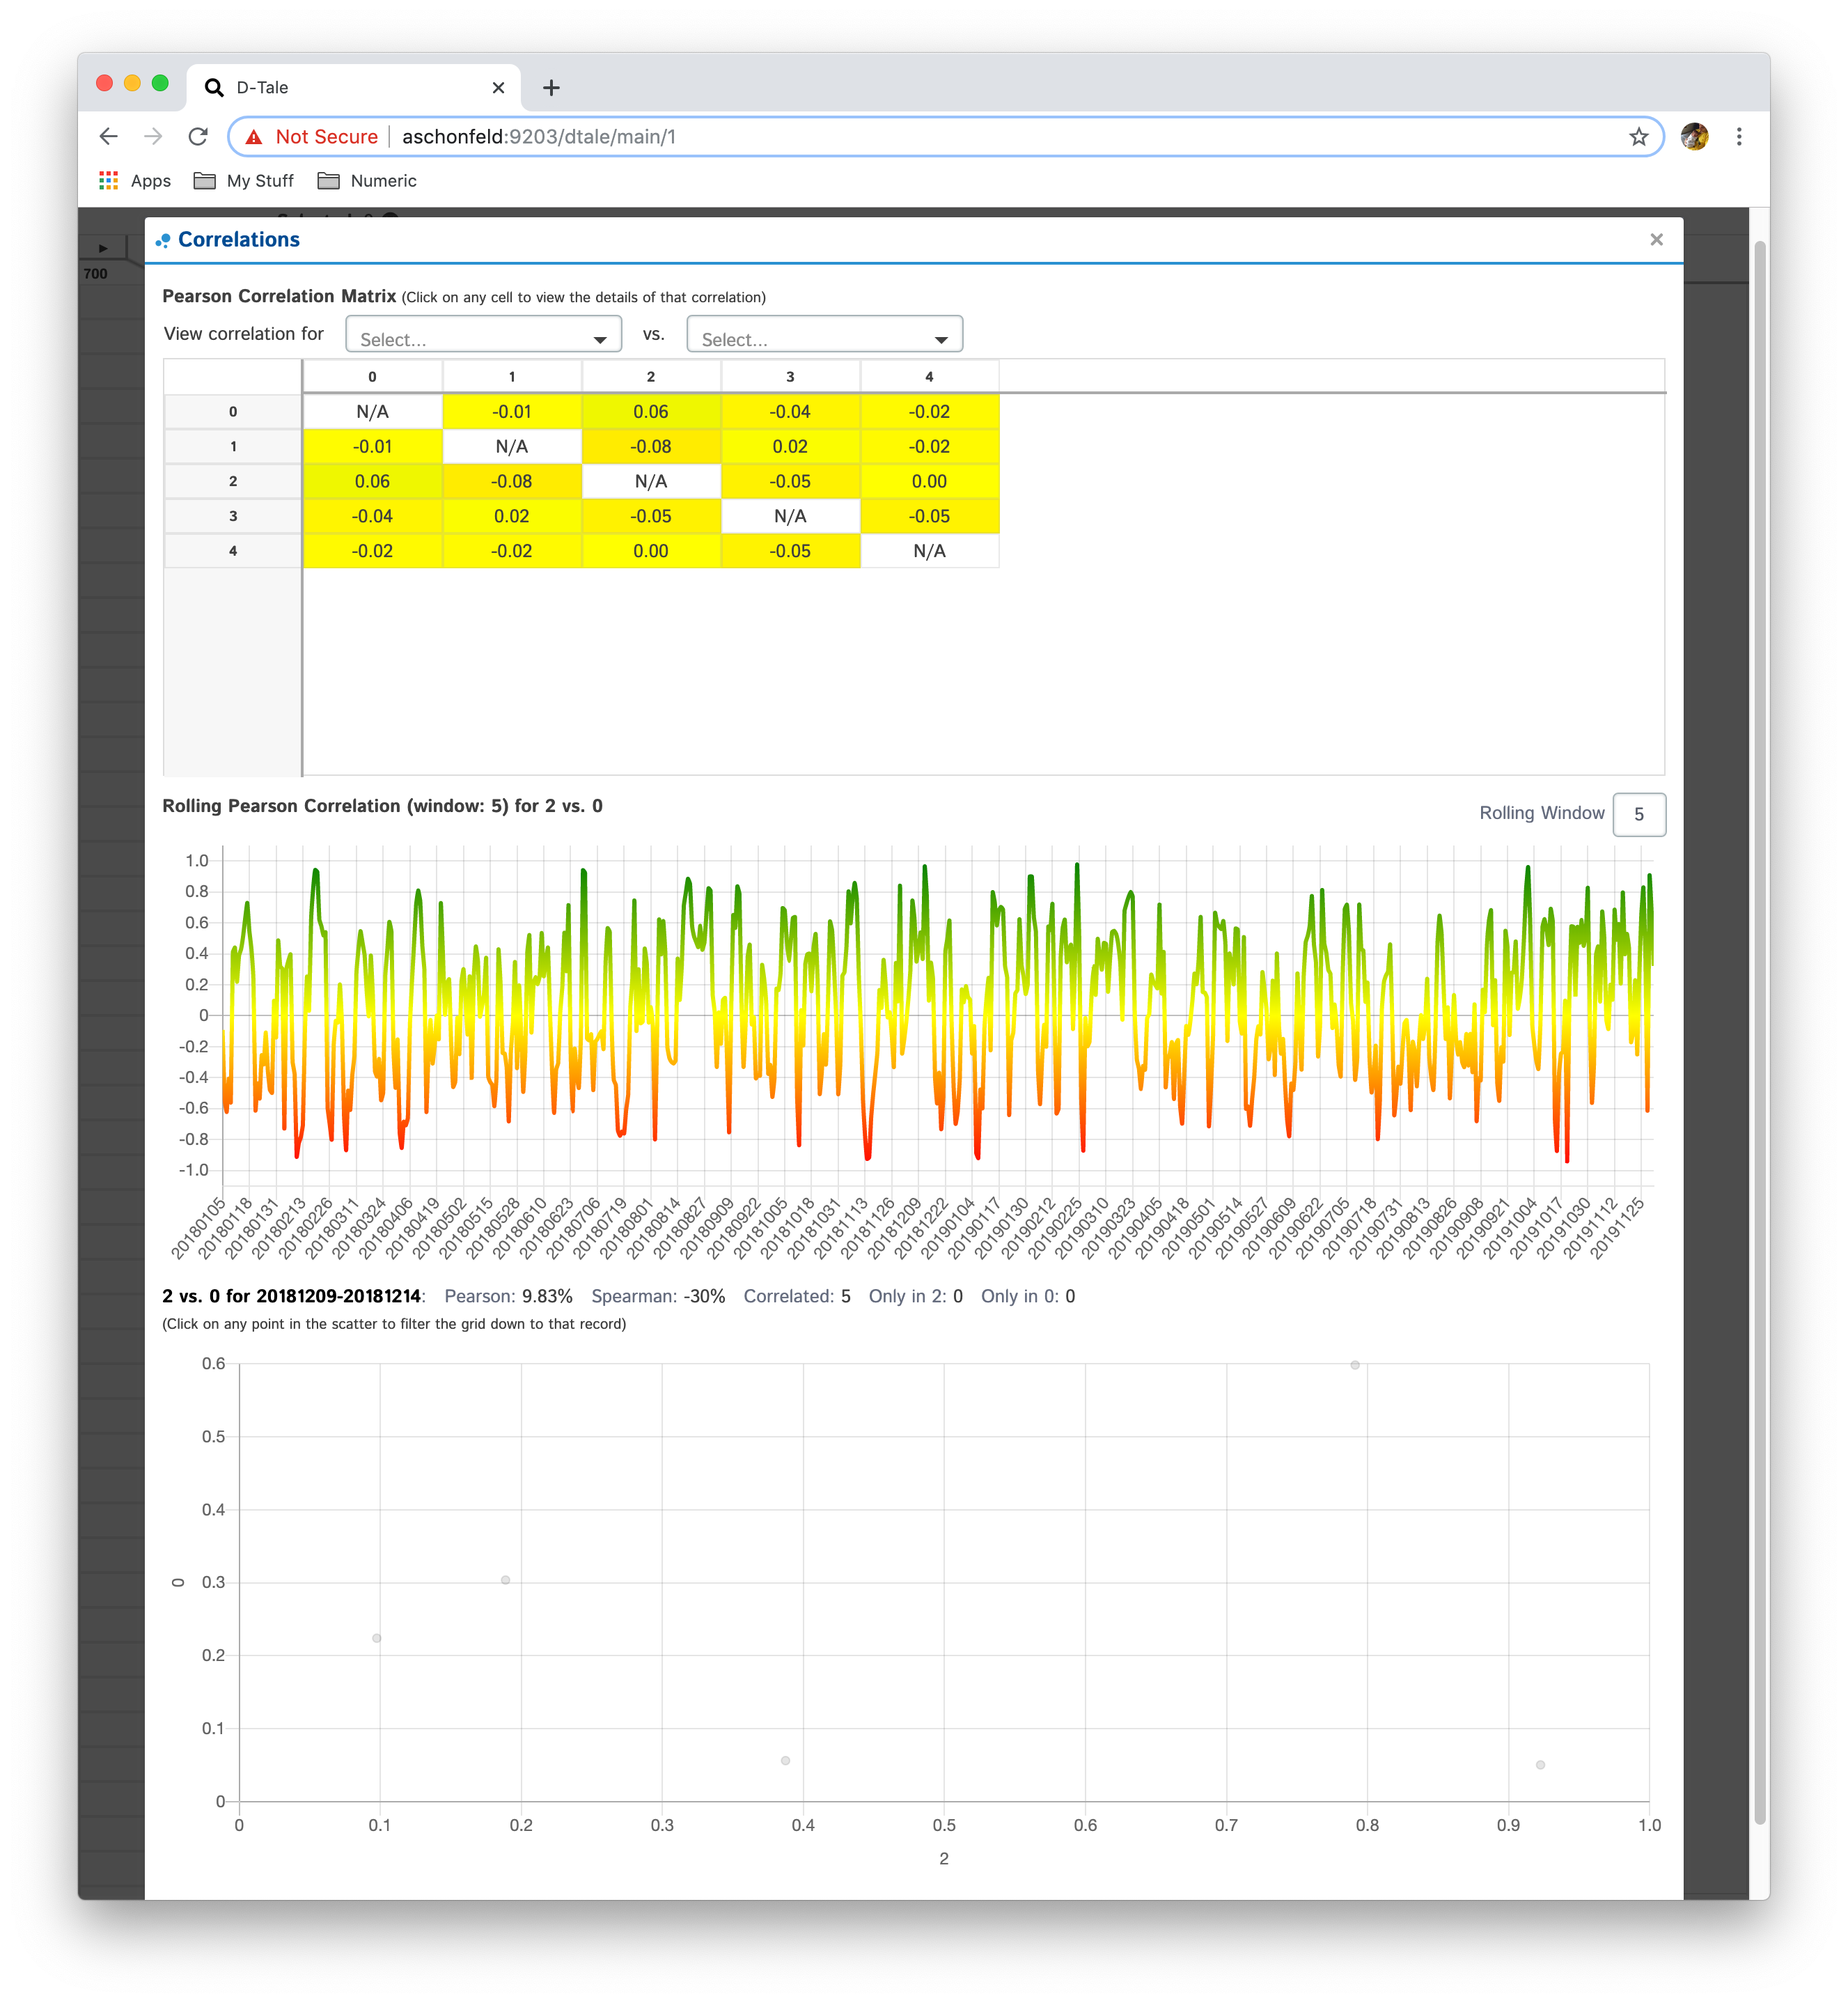
When the data being viewed in D-Tale has date or timestamp columns but for each date/timestamp vlaue there is only one row of data the behavior of the Correlations popup is a little different
- Instead of a timeseries correlation chart the user is given a rolling correlation chart which can have the window (default: 10) altered
- The scatter chart will be created when a user clicks on a point in the rollign correlation chart. The data displayed in the scatter will be for the ranges of dates involved in the rolling correlation for that date.
| Data | Correlations |
|---|---|
 |  |
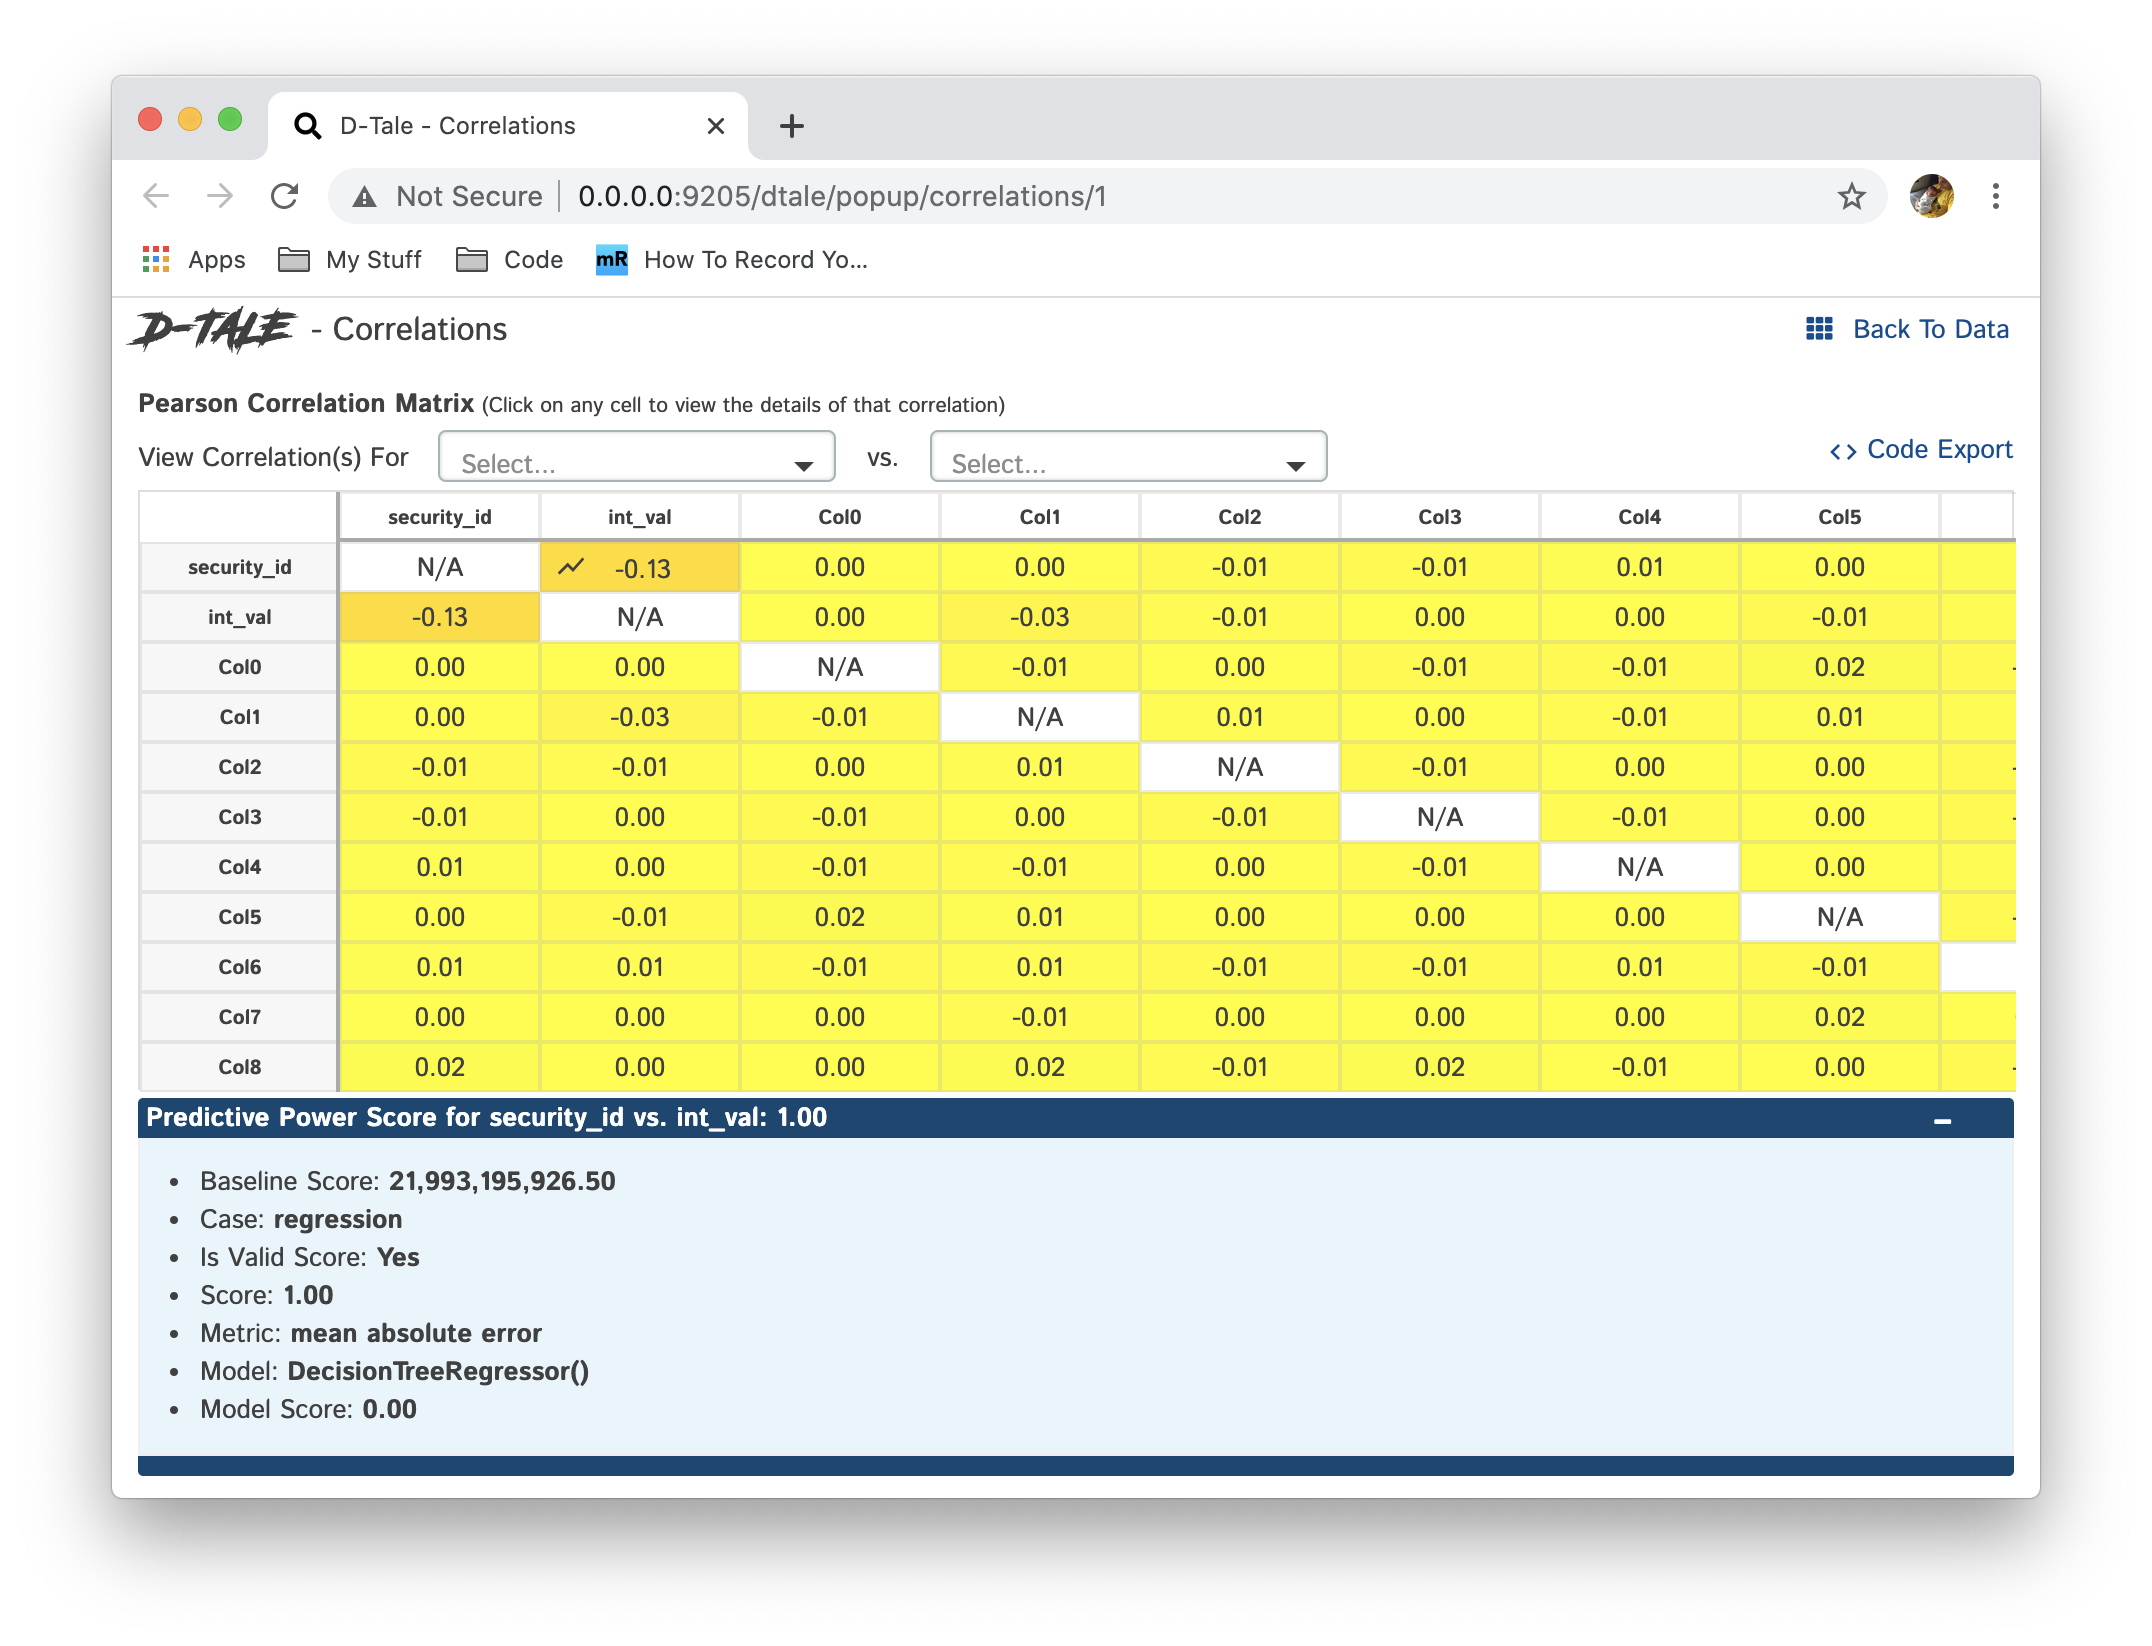
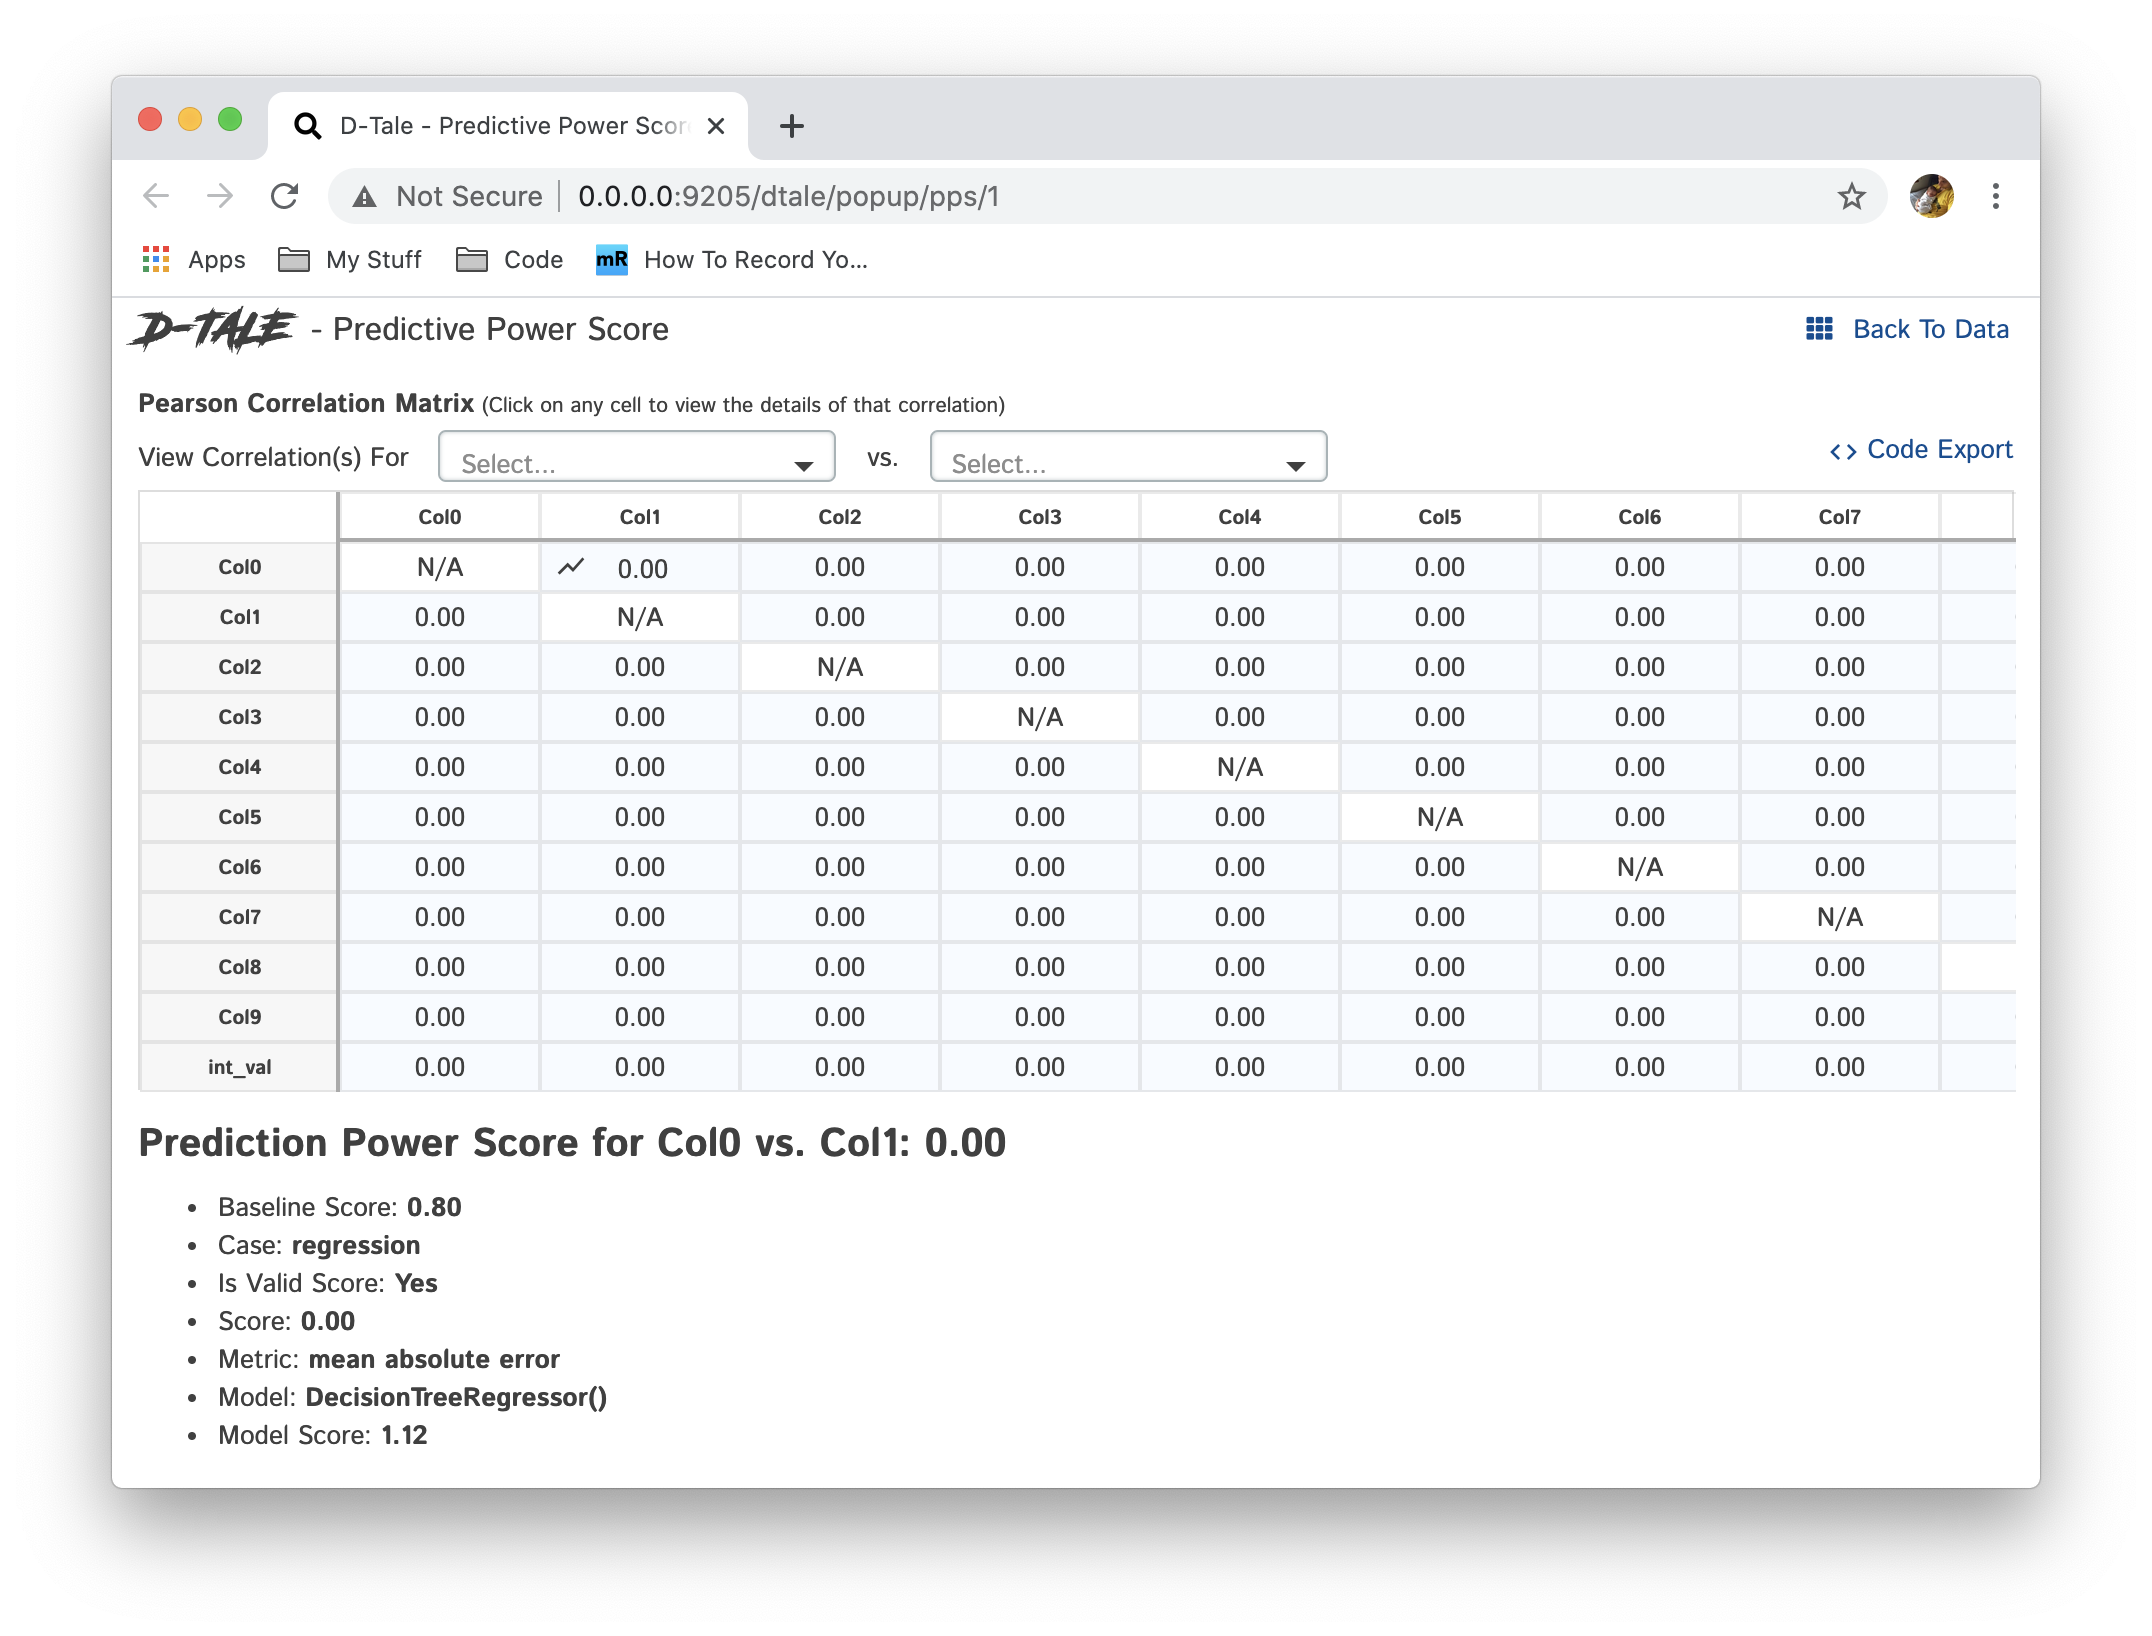
Predictive Power Score
Predictive Power Score (using the package ppscore) is an asymmetric, data-type-agnostic score that can detect linear or non-linear relationships between two columns. The score ranges from 0 (no predictive power) to 1 (perfect predictive power). It can be used as an alternative to the correlation (matrix). WARNING: This could take a while to load.
This page works similar to the Correlations page but uses the PPS calcuation to populate the grid and by clicking on cells you can view the details of the PPS for those two columns in question.
|
Heat Map
This will hide any non-float or non-int columns (with the exception of the index on the right) and apply a color to the background of each cell.
- Each float is renormalized to be a value between 0 and 1.0
- You have two options for the renormalization
- By Col: each value is calculated based on the min/max of its column
- Overall: each value is caluclated by the overall min/max of all the non-hidden float/int columns in the dataset
- Each renormalized value is passed to a color scale of red(0) - yellow(0.5) - green(1.0)
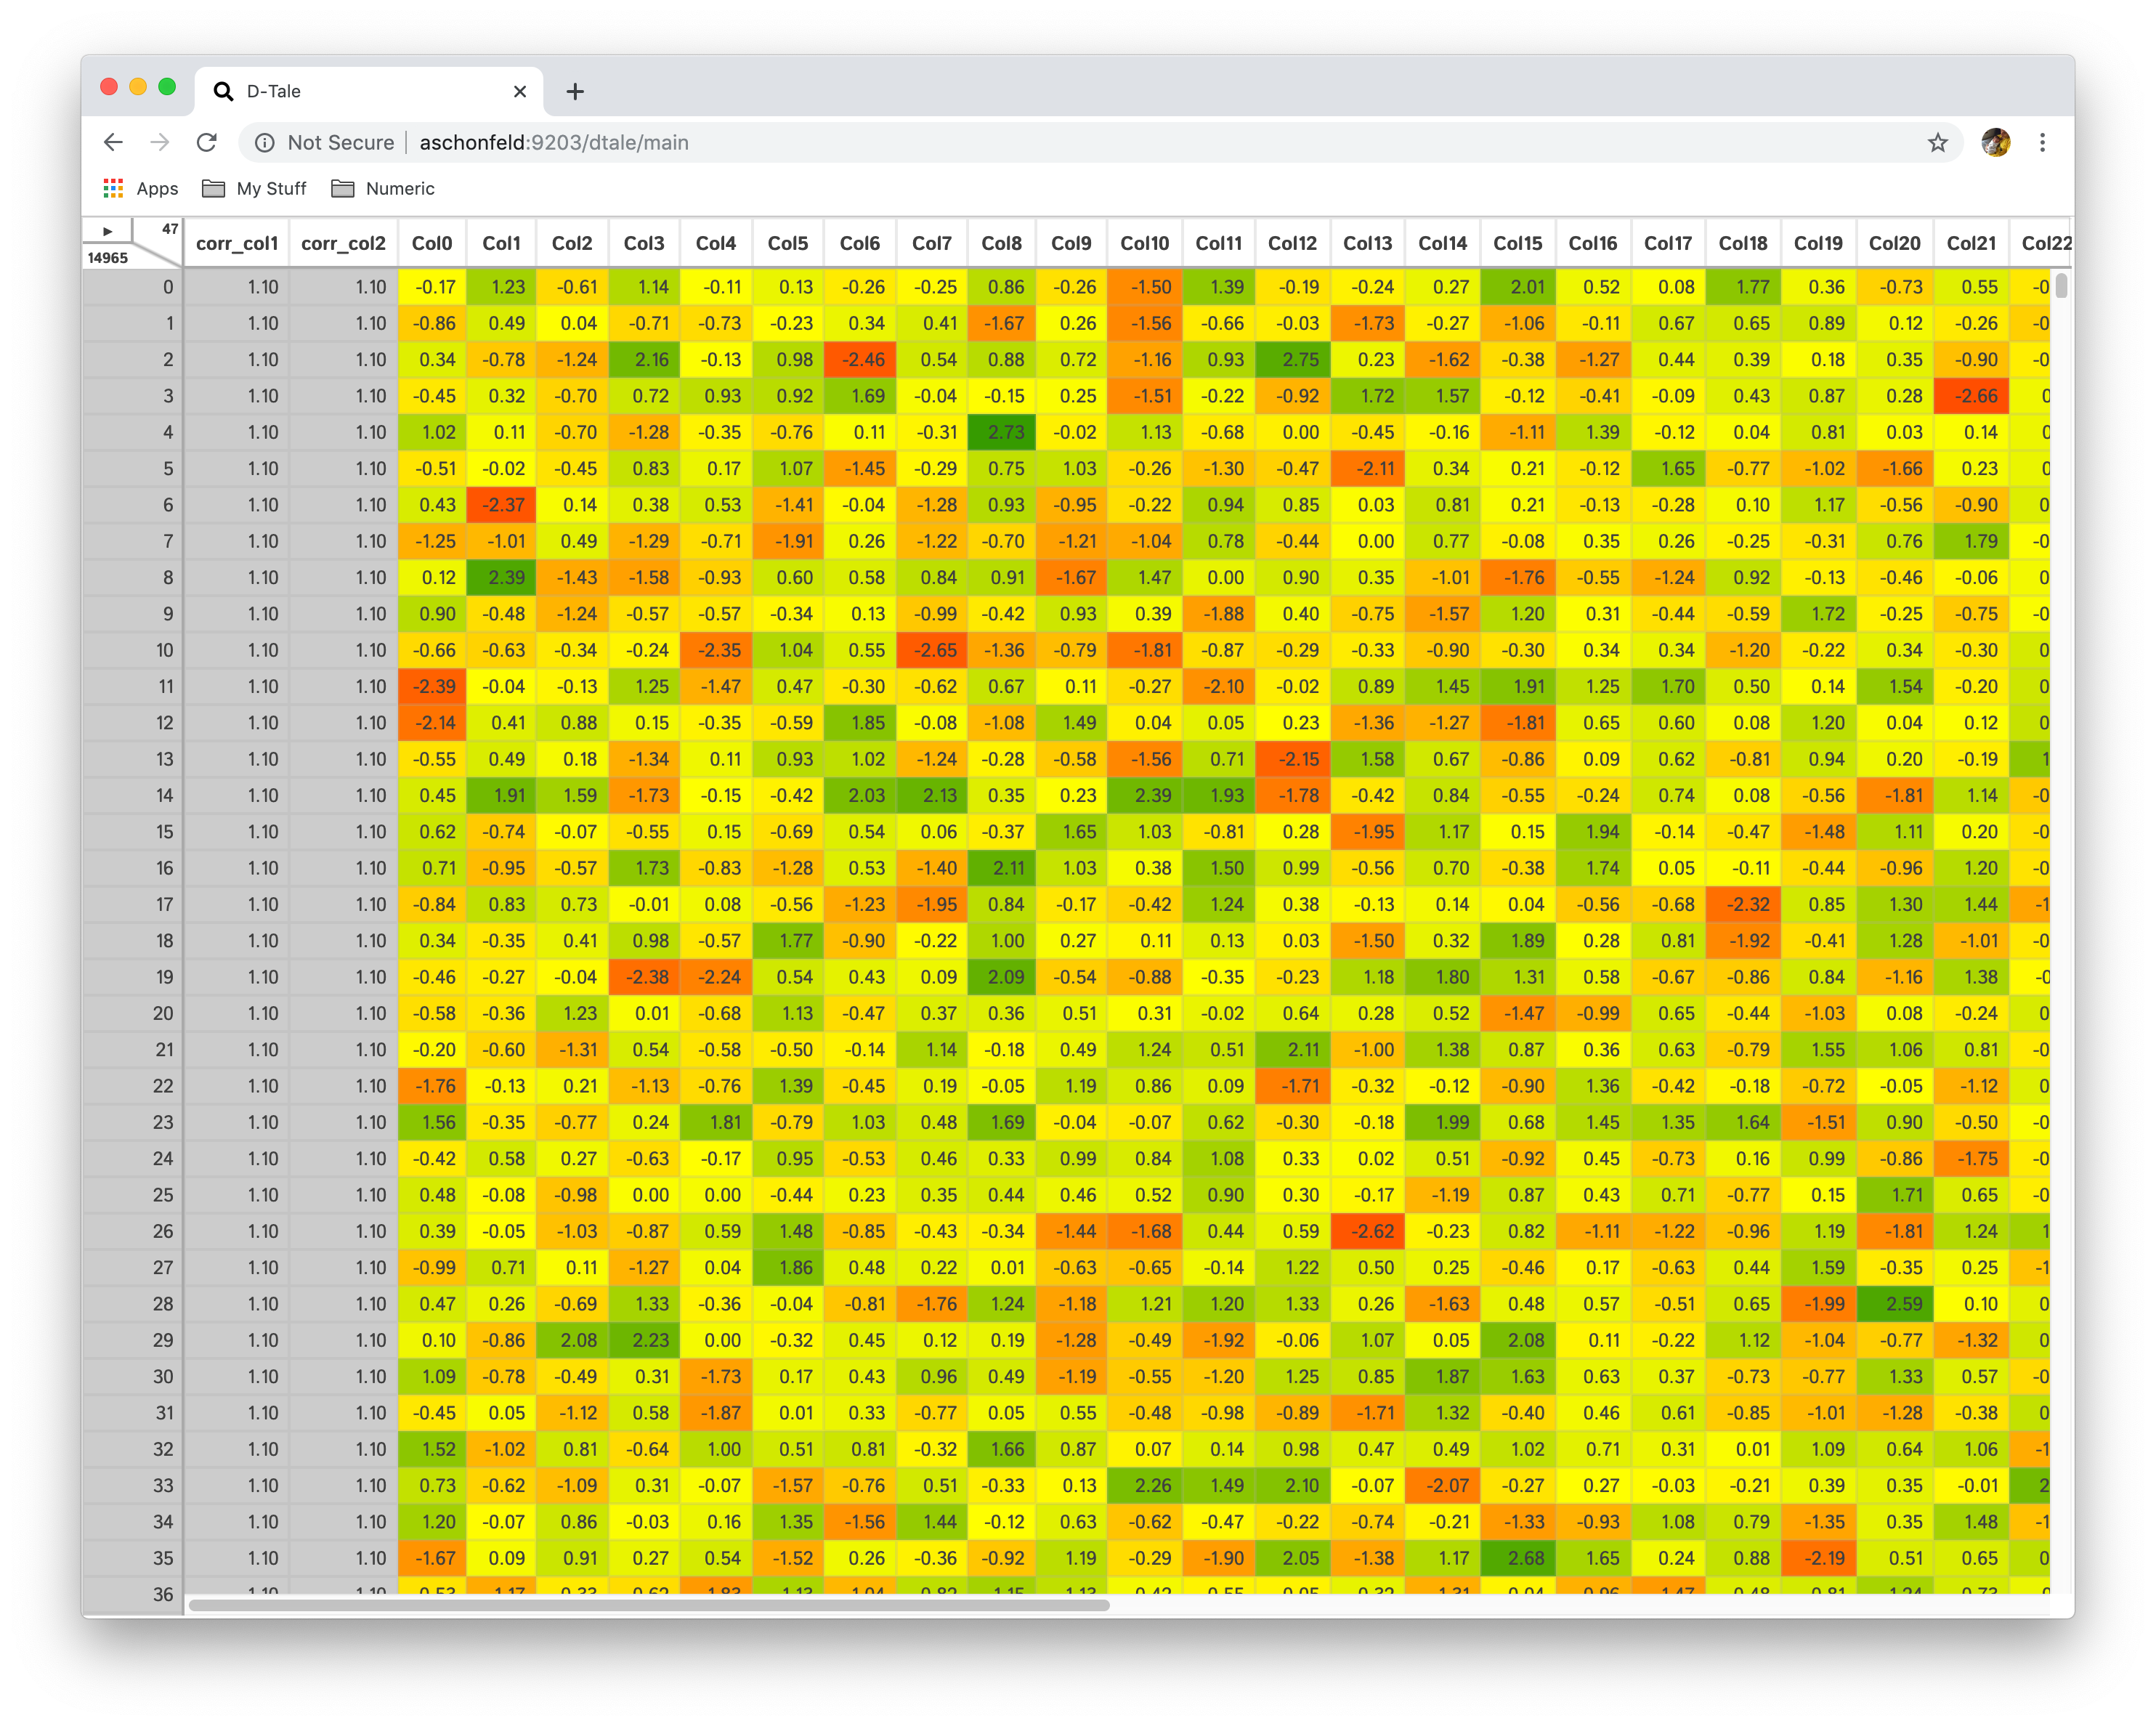
Turn off Heat Map by clicking menu option you previously selected one more time
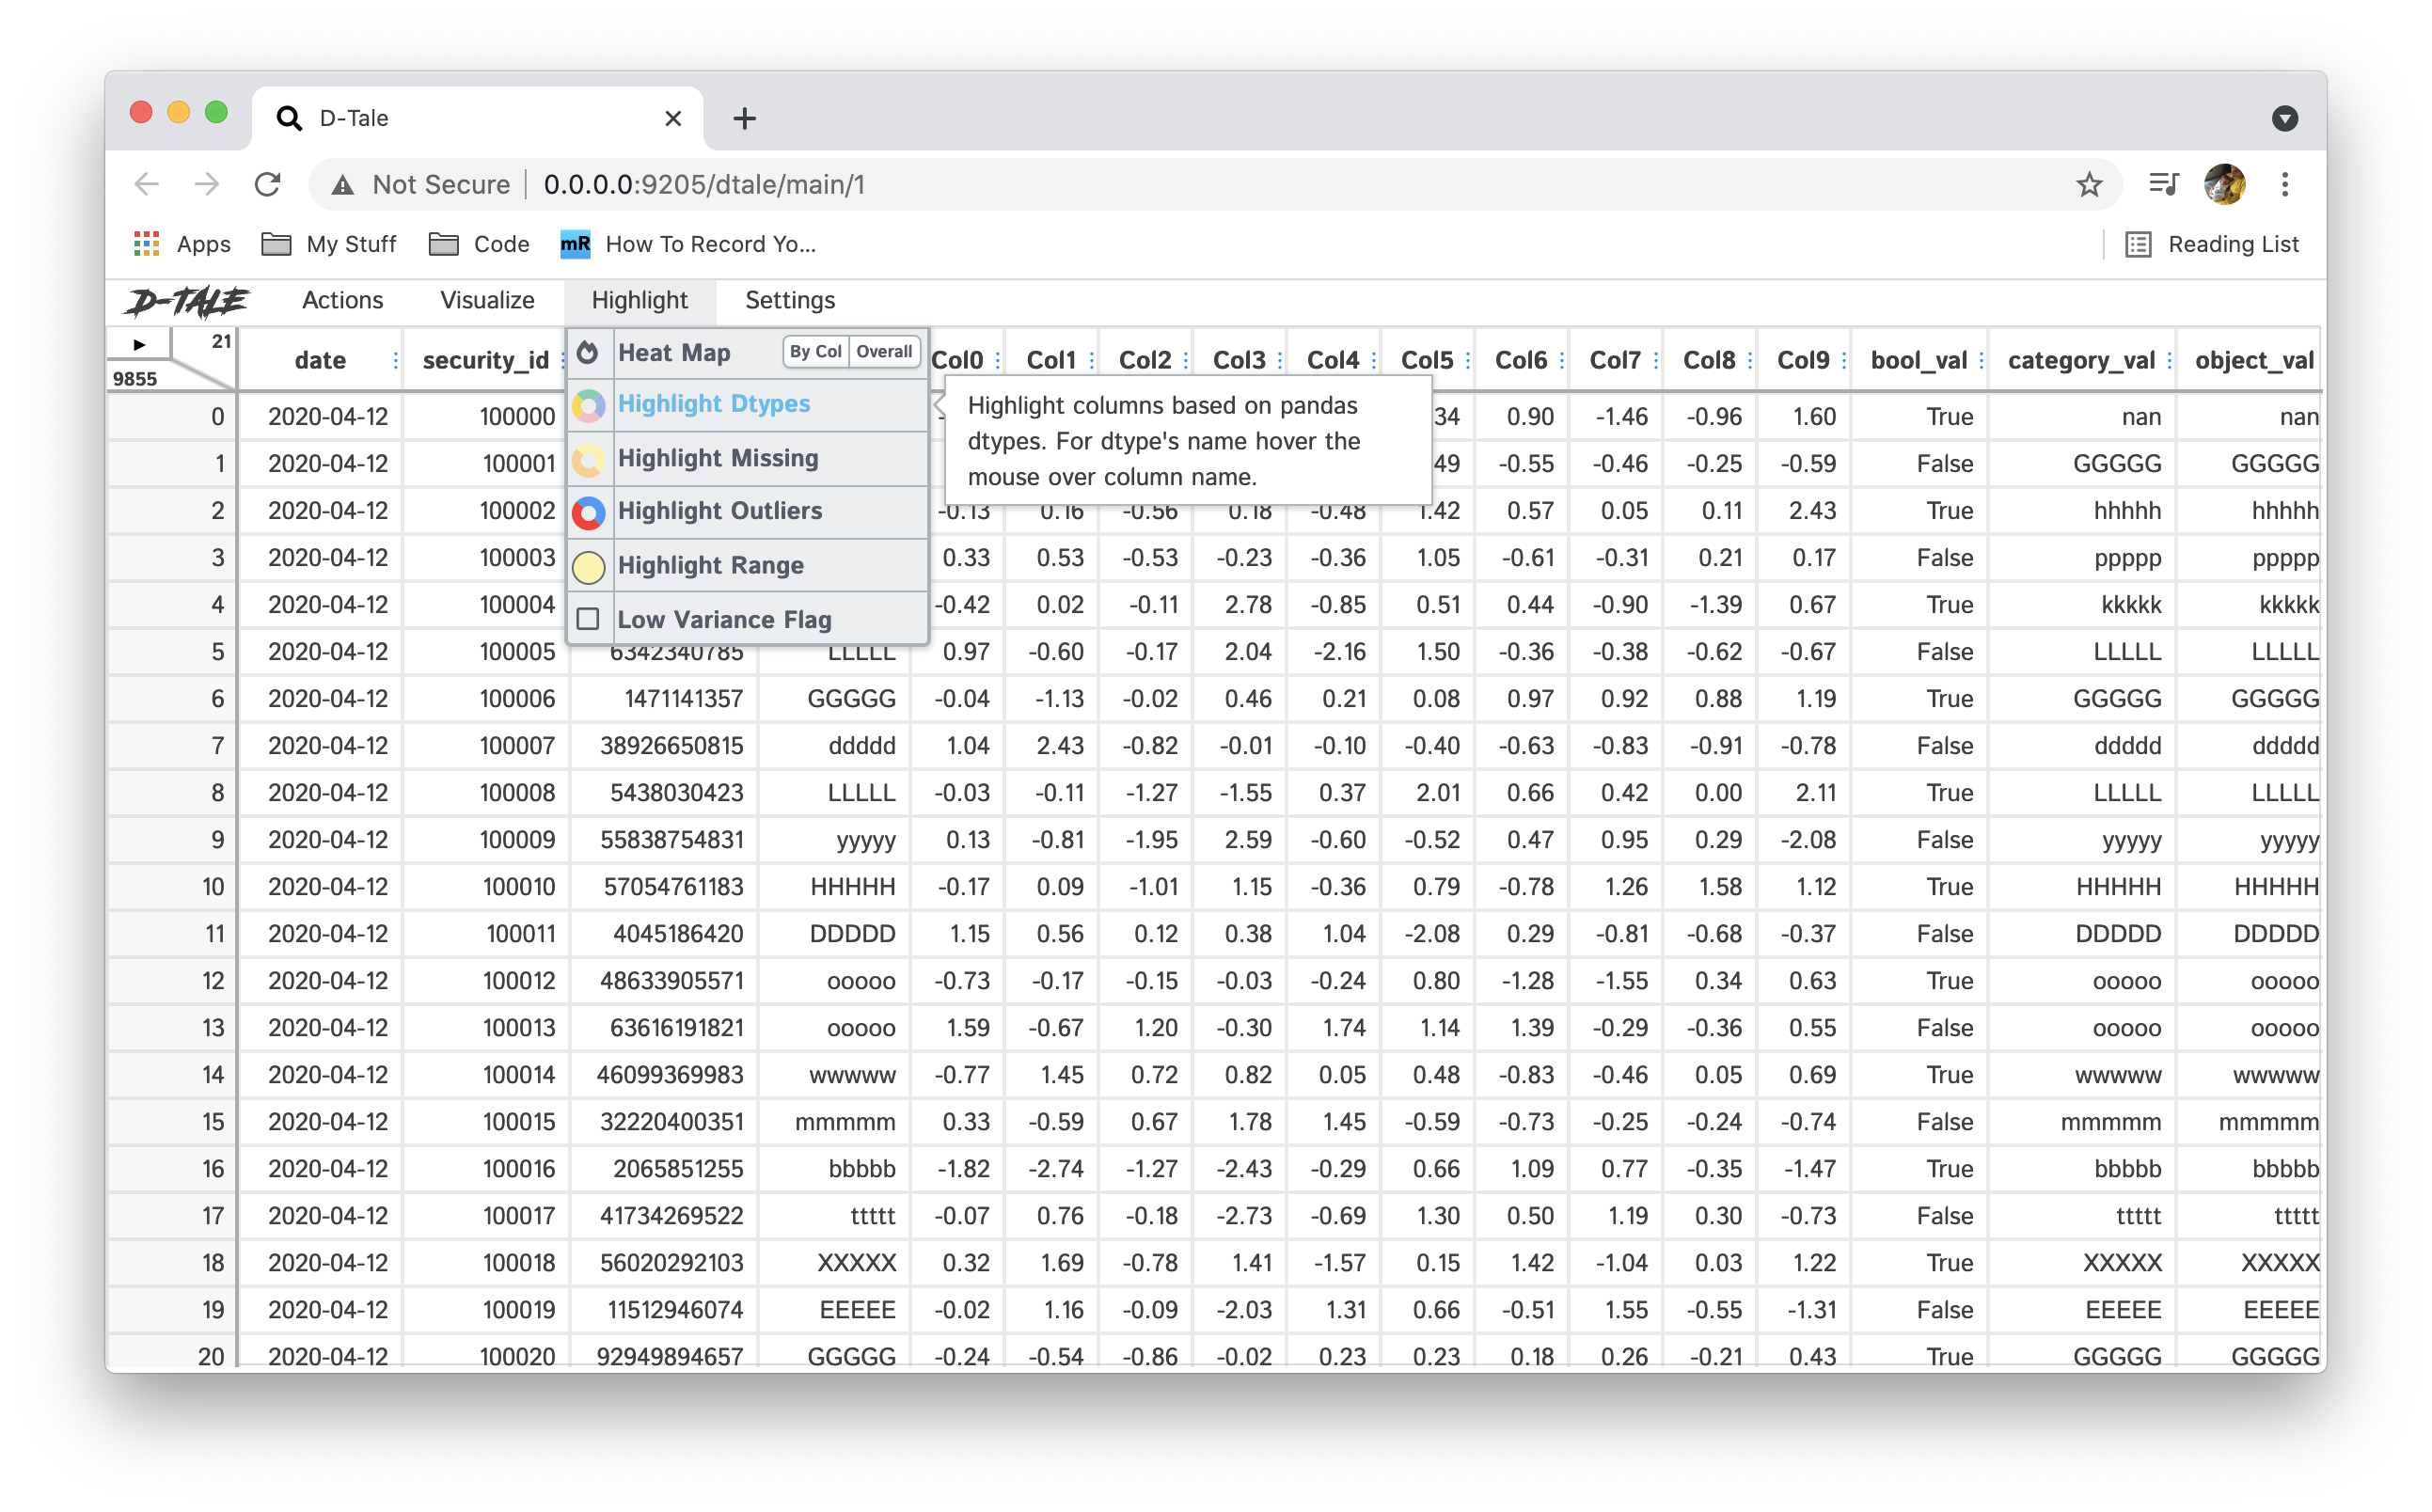
Highlight Dtypes
This is a quick way to check and see if your data has been categorized correctly. By clicking this menu option it will assign a specific background color to each column of a specific data type.
| category | timedelta | float | int | date | string | bool |
|---|---|---|---|---|---|---|
| purple | orange | green | light blue | pink | white | yellow |

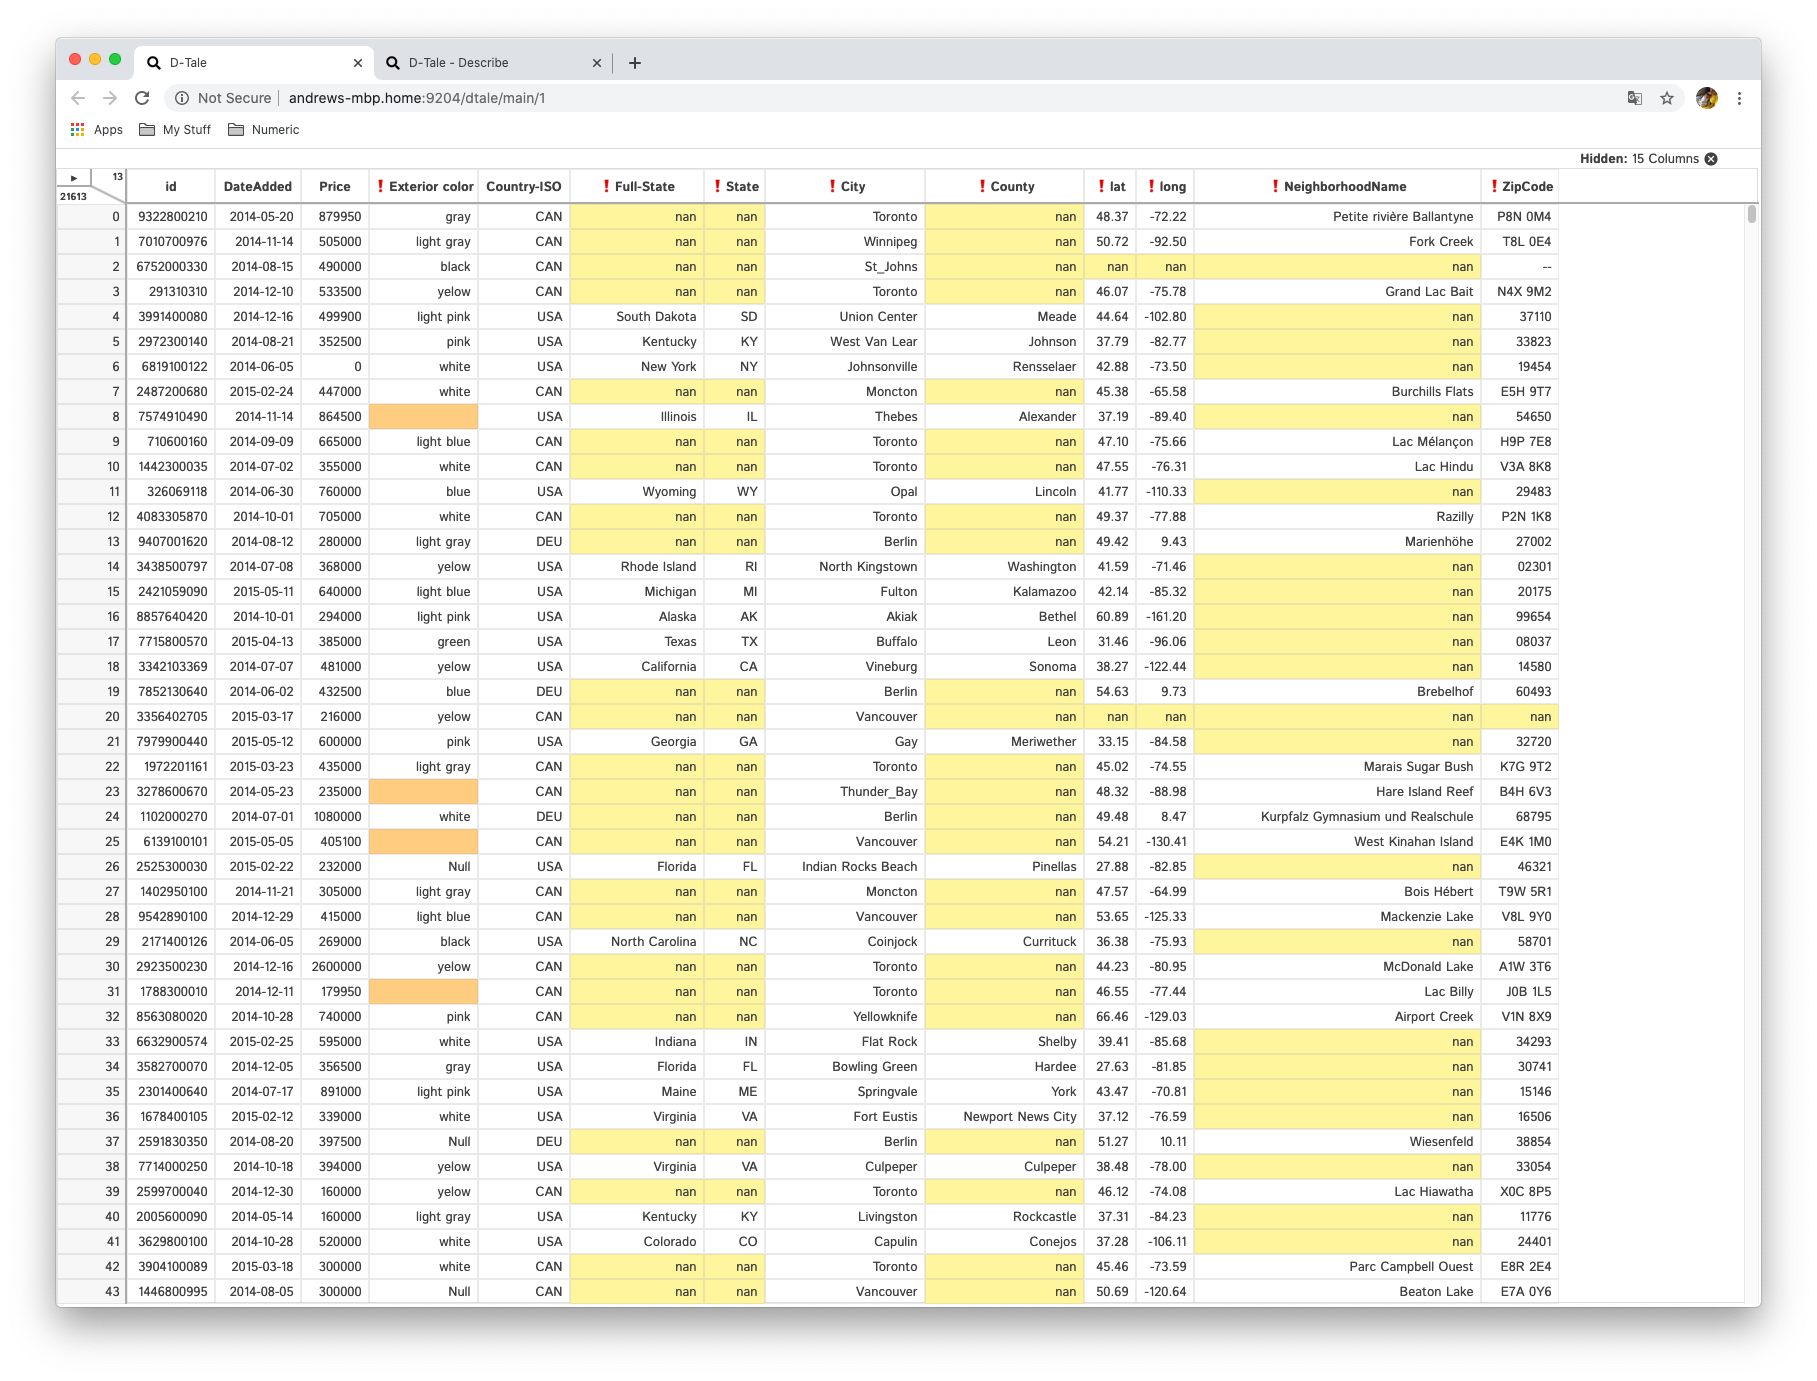
Highlight Missing
- Any cells which contain
nanvalues will be highlighted in yellow. - Any string column cells which are empty strings or strings consisting only of spaces will be highlighted in orange.
- ❗will be prepended to any column header which contains missing values.
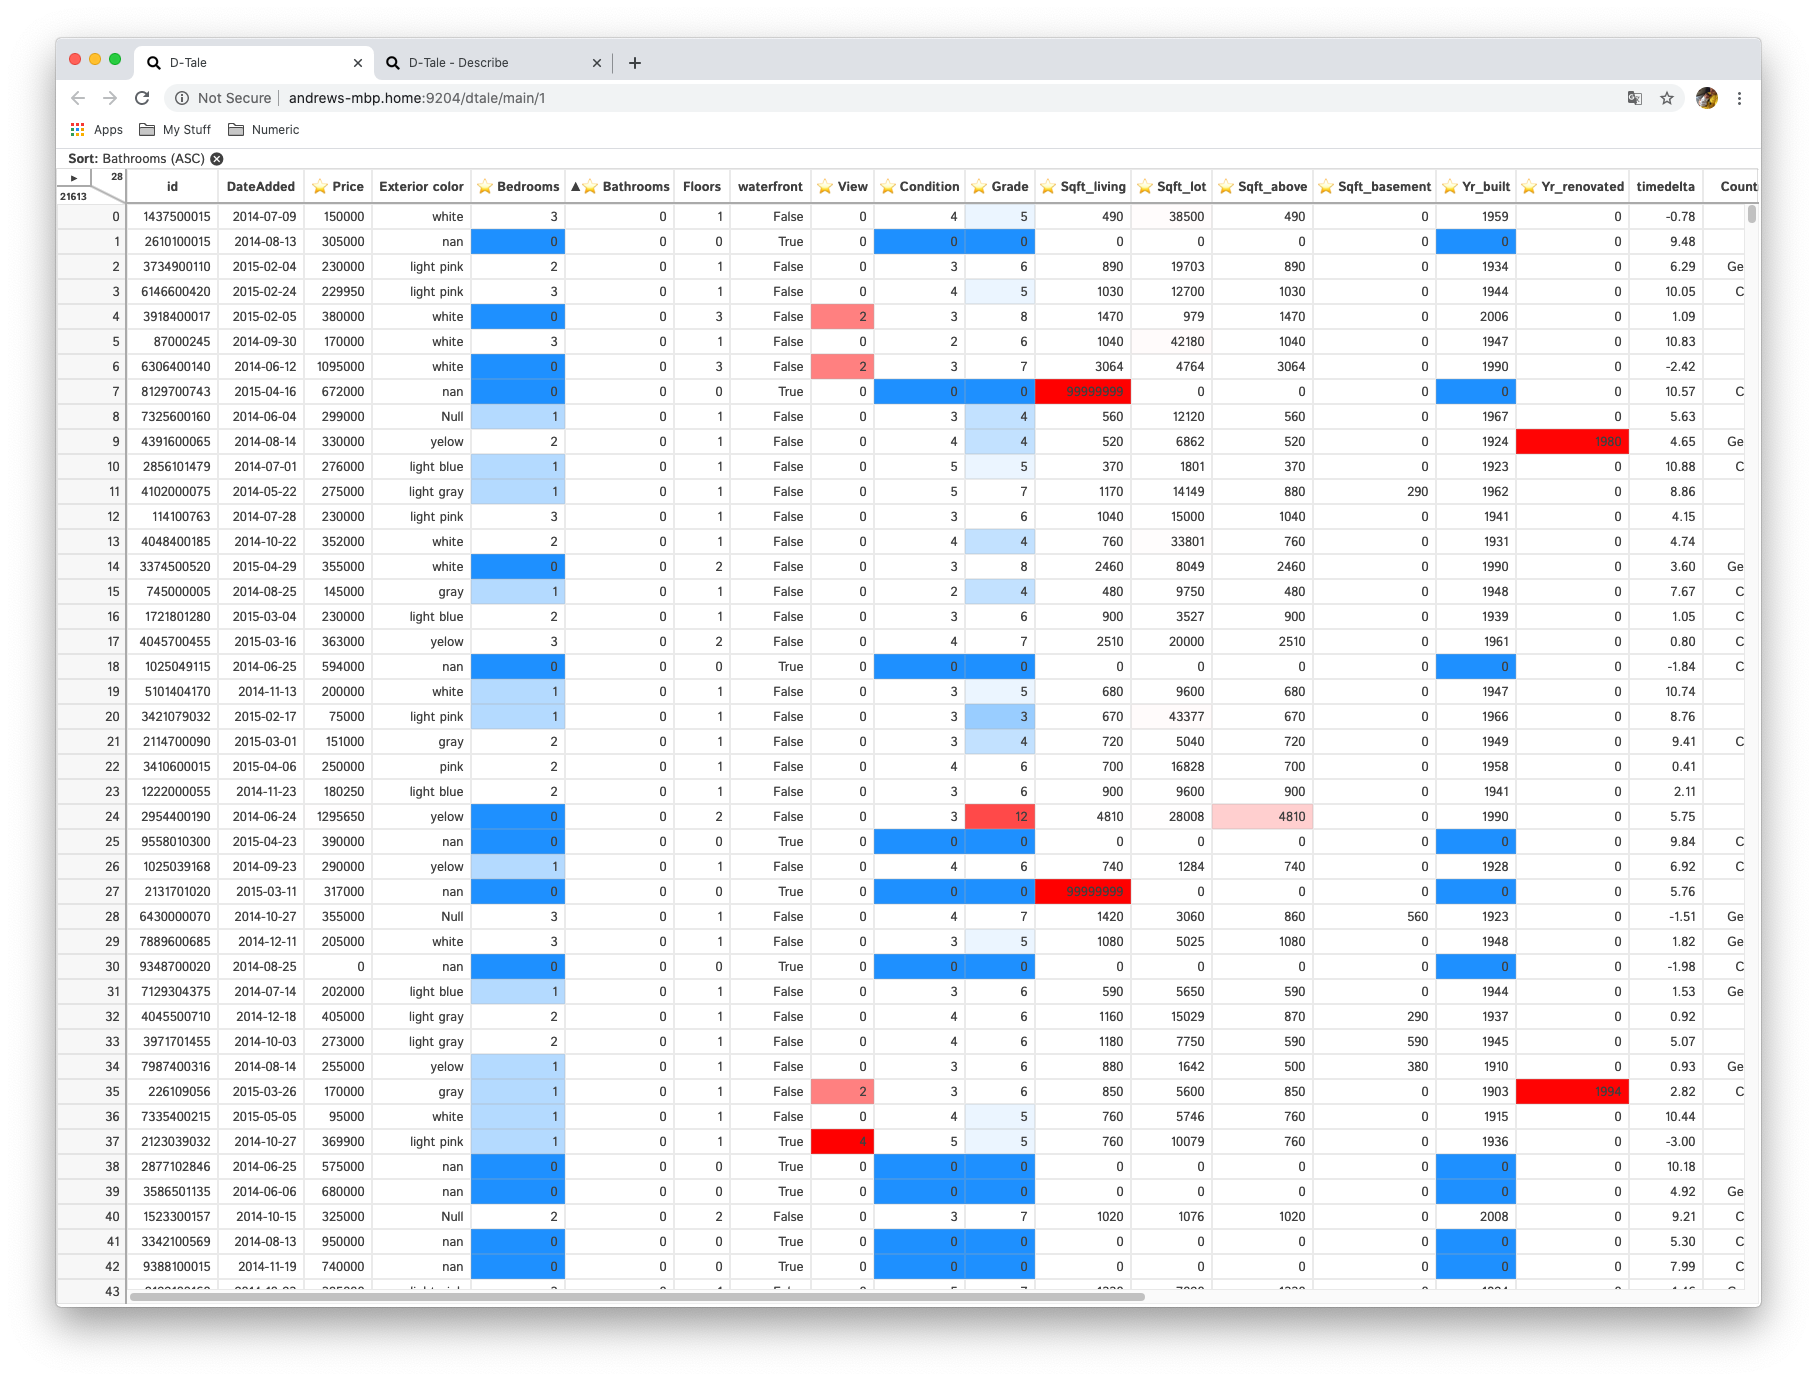
Highlight Outliers
Highlight any cells for numeric columns which surpass the upper or lower bounds of a custom outlier computation.
- Lower bounds outliers will be on a red scale, where the darker reds will be near the maximum value for the column.
- Upper bounds outliers will be on a blue scale, where the darker blues will be closer to the minimum value for the column.
- ⭐ will be prepended to any column header which contains outliers.
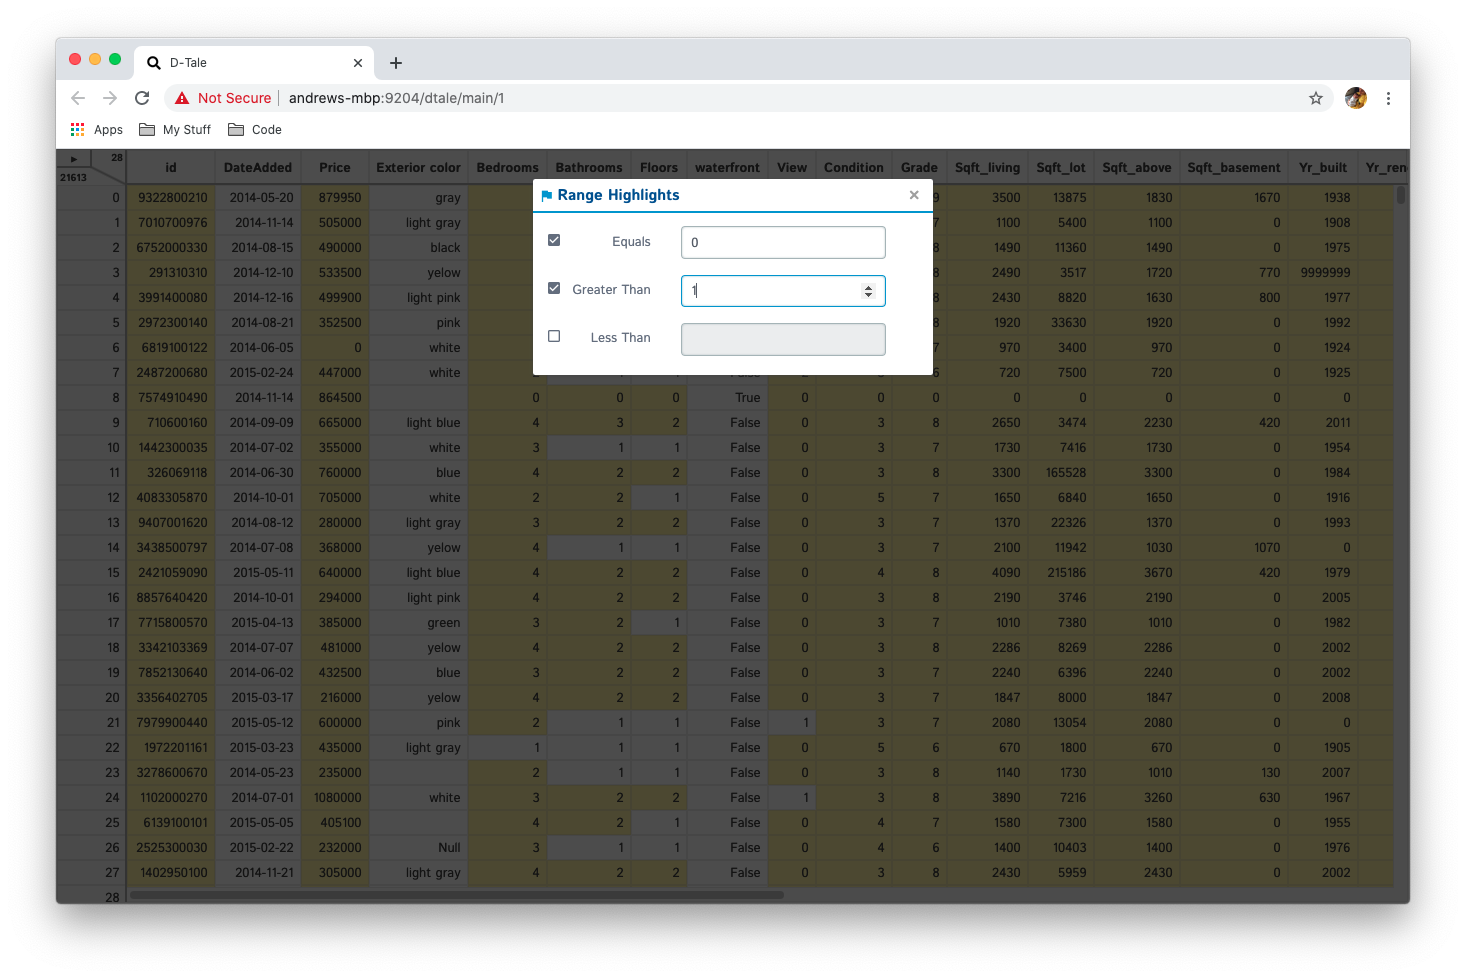
Highlight Range
Highlight any range of numeric cells based on three different criteria:
- equals
- greater than
- less than
You can activate as many of these criteria as you'd like nad they will be treated as an "or" expression. For example, (x == 0) or (x < -1) or (x > 1)
| Selections | Output |
|---|---|
 |  |
Low Variance Flag
Show flags on column headers where both these conditions are true:
- Count of unique values / column size < 10%
- Count of most common value / Count of second most common value > 20
Here's an example of what this will look like when you apply it:
|
Code Exports
Code Exports are small snippets of code representing the current state of the grid you're viewing including things like:
- columns built
- filtering
- sorting
Other code exports available are:
- Describe (Column Analysis)
- Correlations (grid, timeseries chart & scatter chart)
- Charts built using the Chart Builder
| Type | Code Export |
|---|---|
| Main Grid | 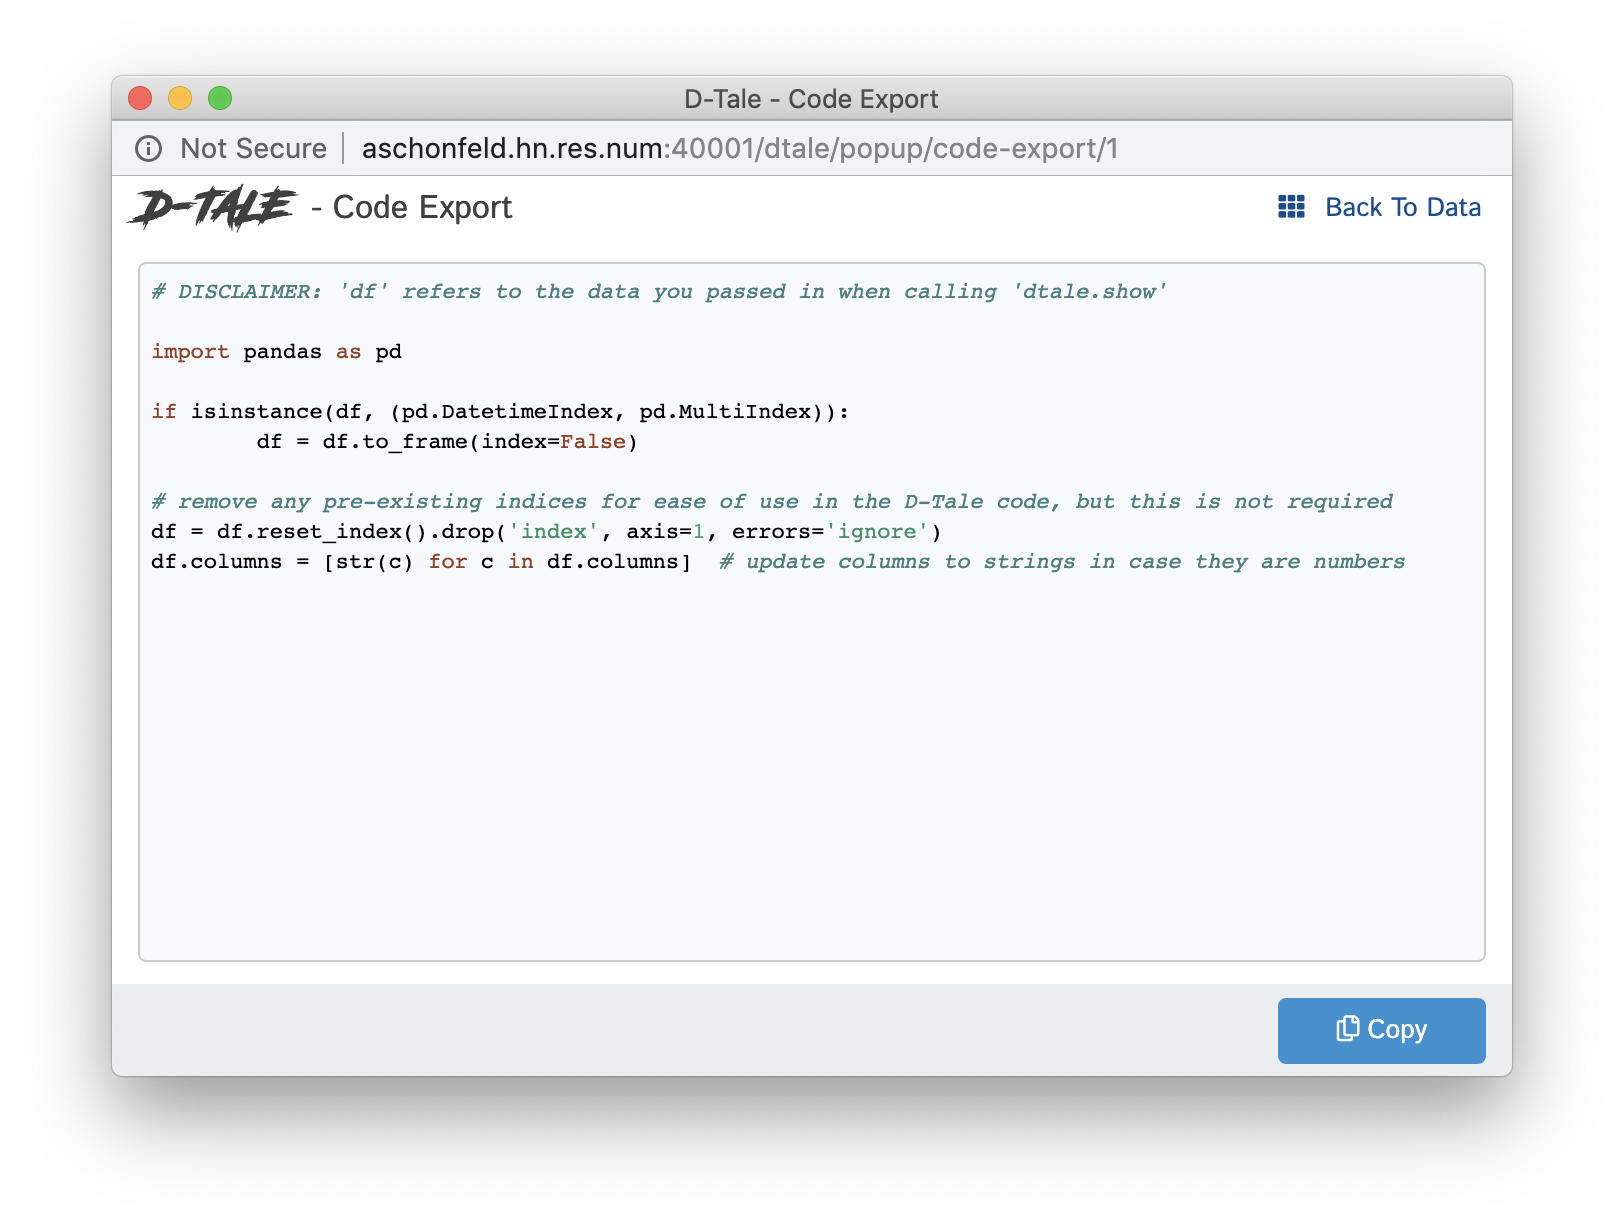 |
| Histogram | 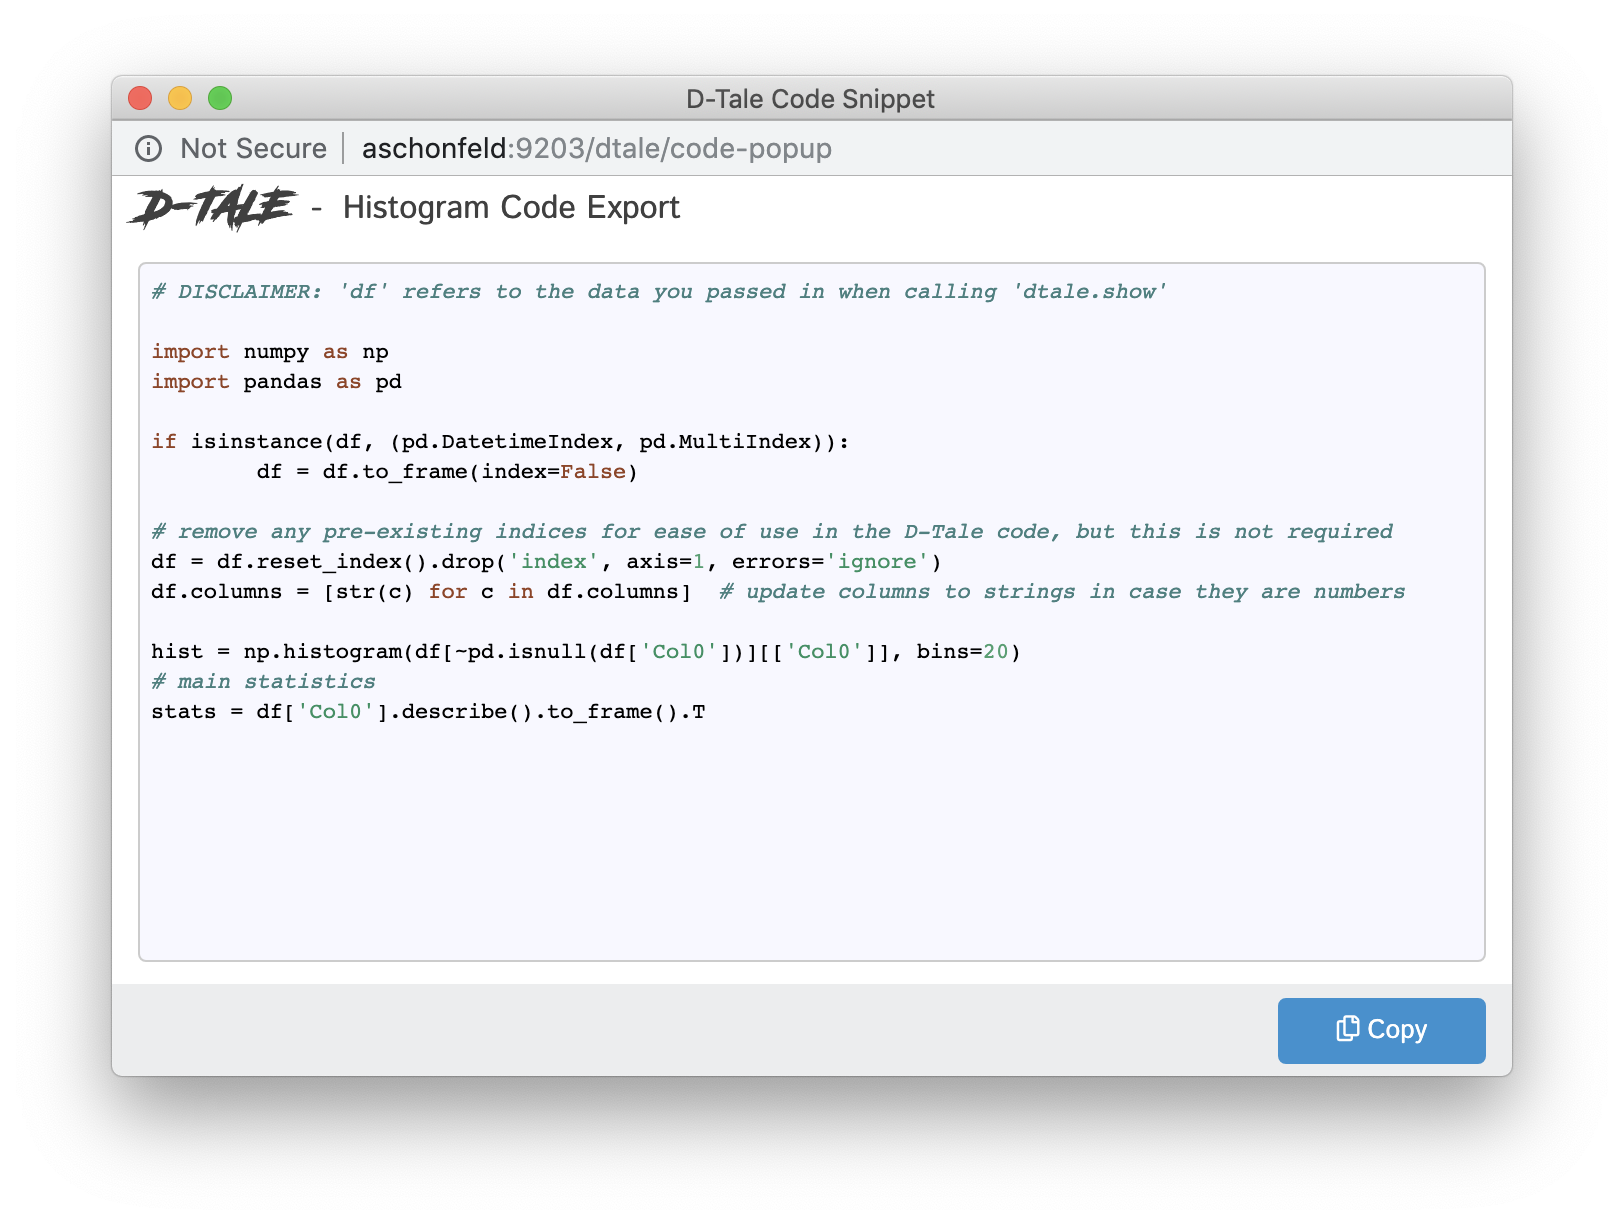 |
| Describe | 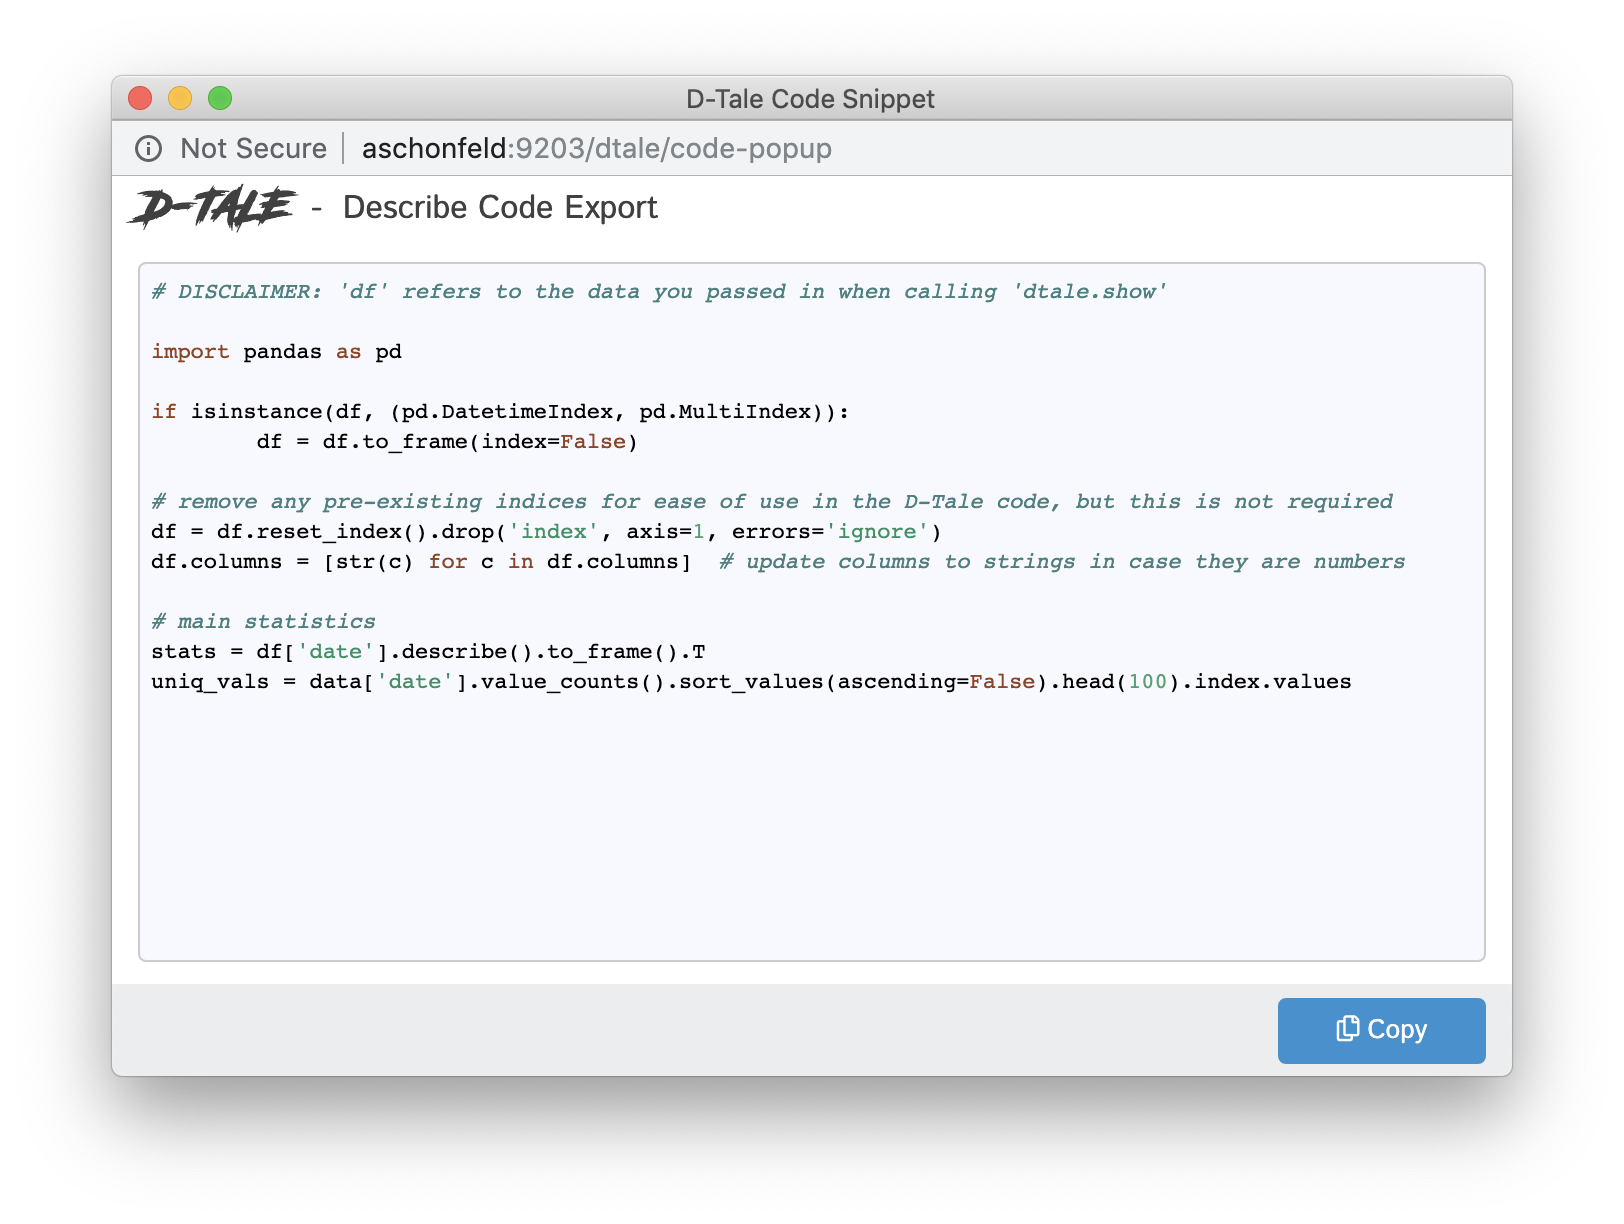 |
| Correlation Grid | |
| Correlation Timeseries |  |
| Correlation Scatter | 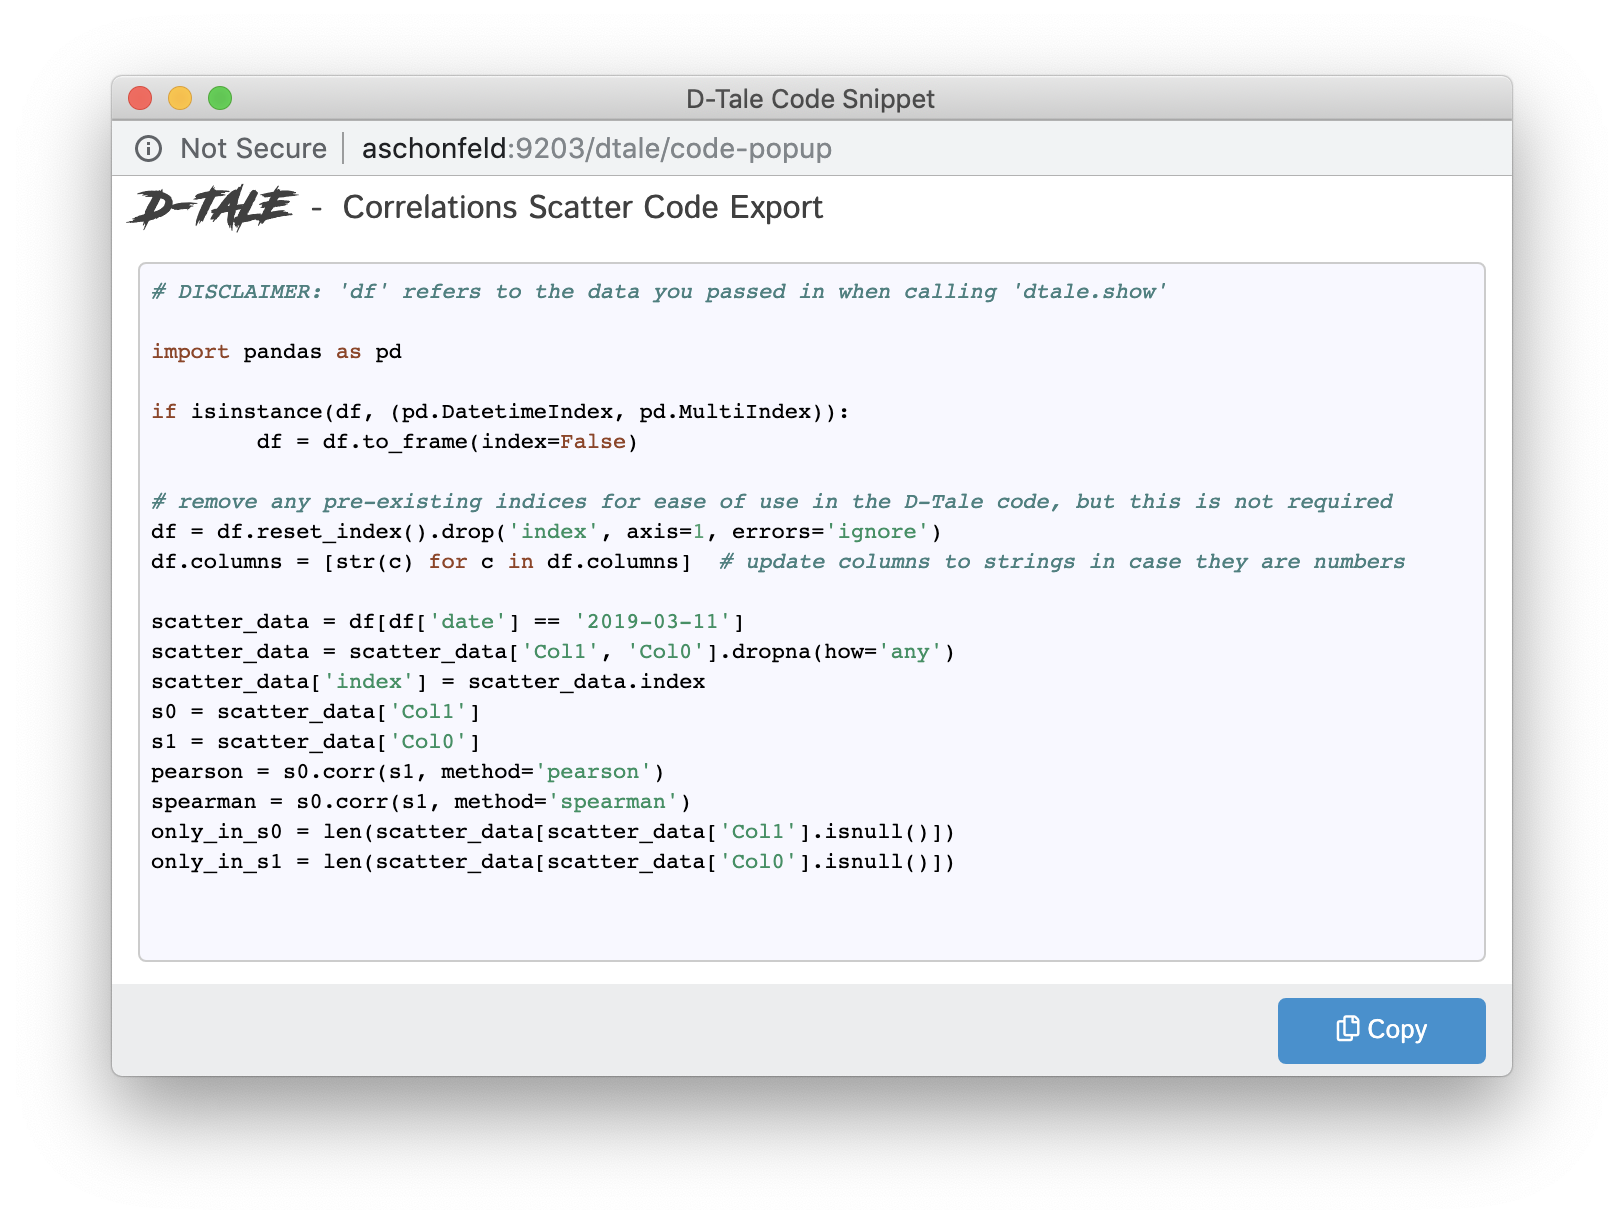 |
| Charts | 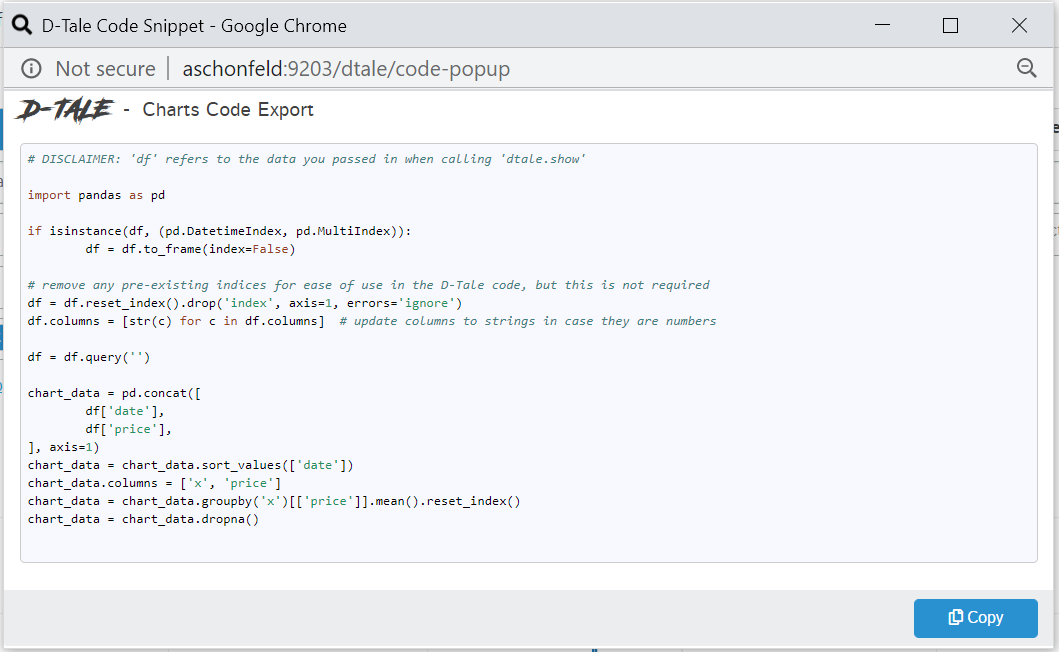 |
Export CSV
Export your current data to either a CSV or TSV file:
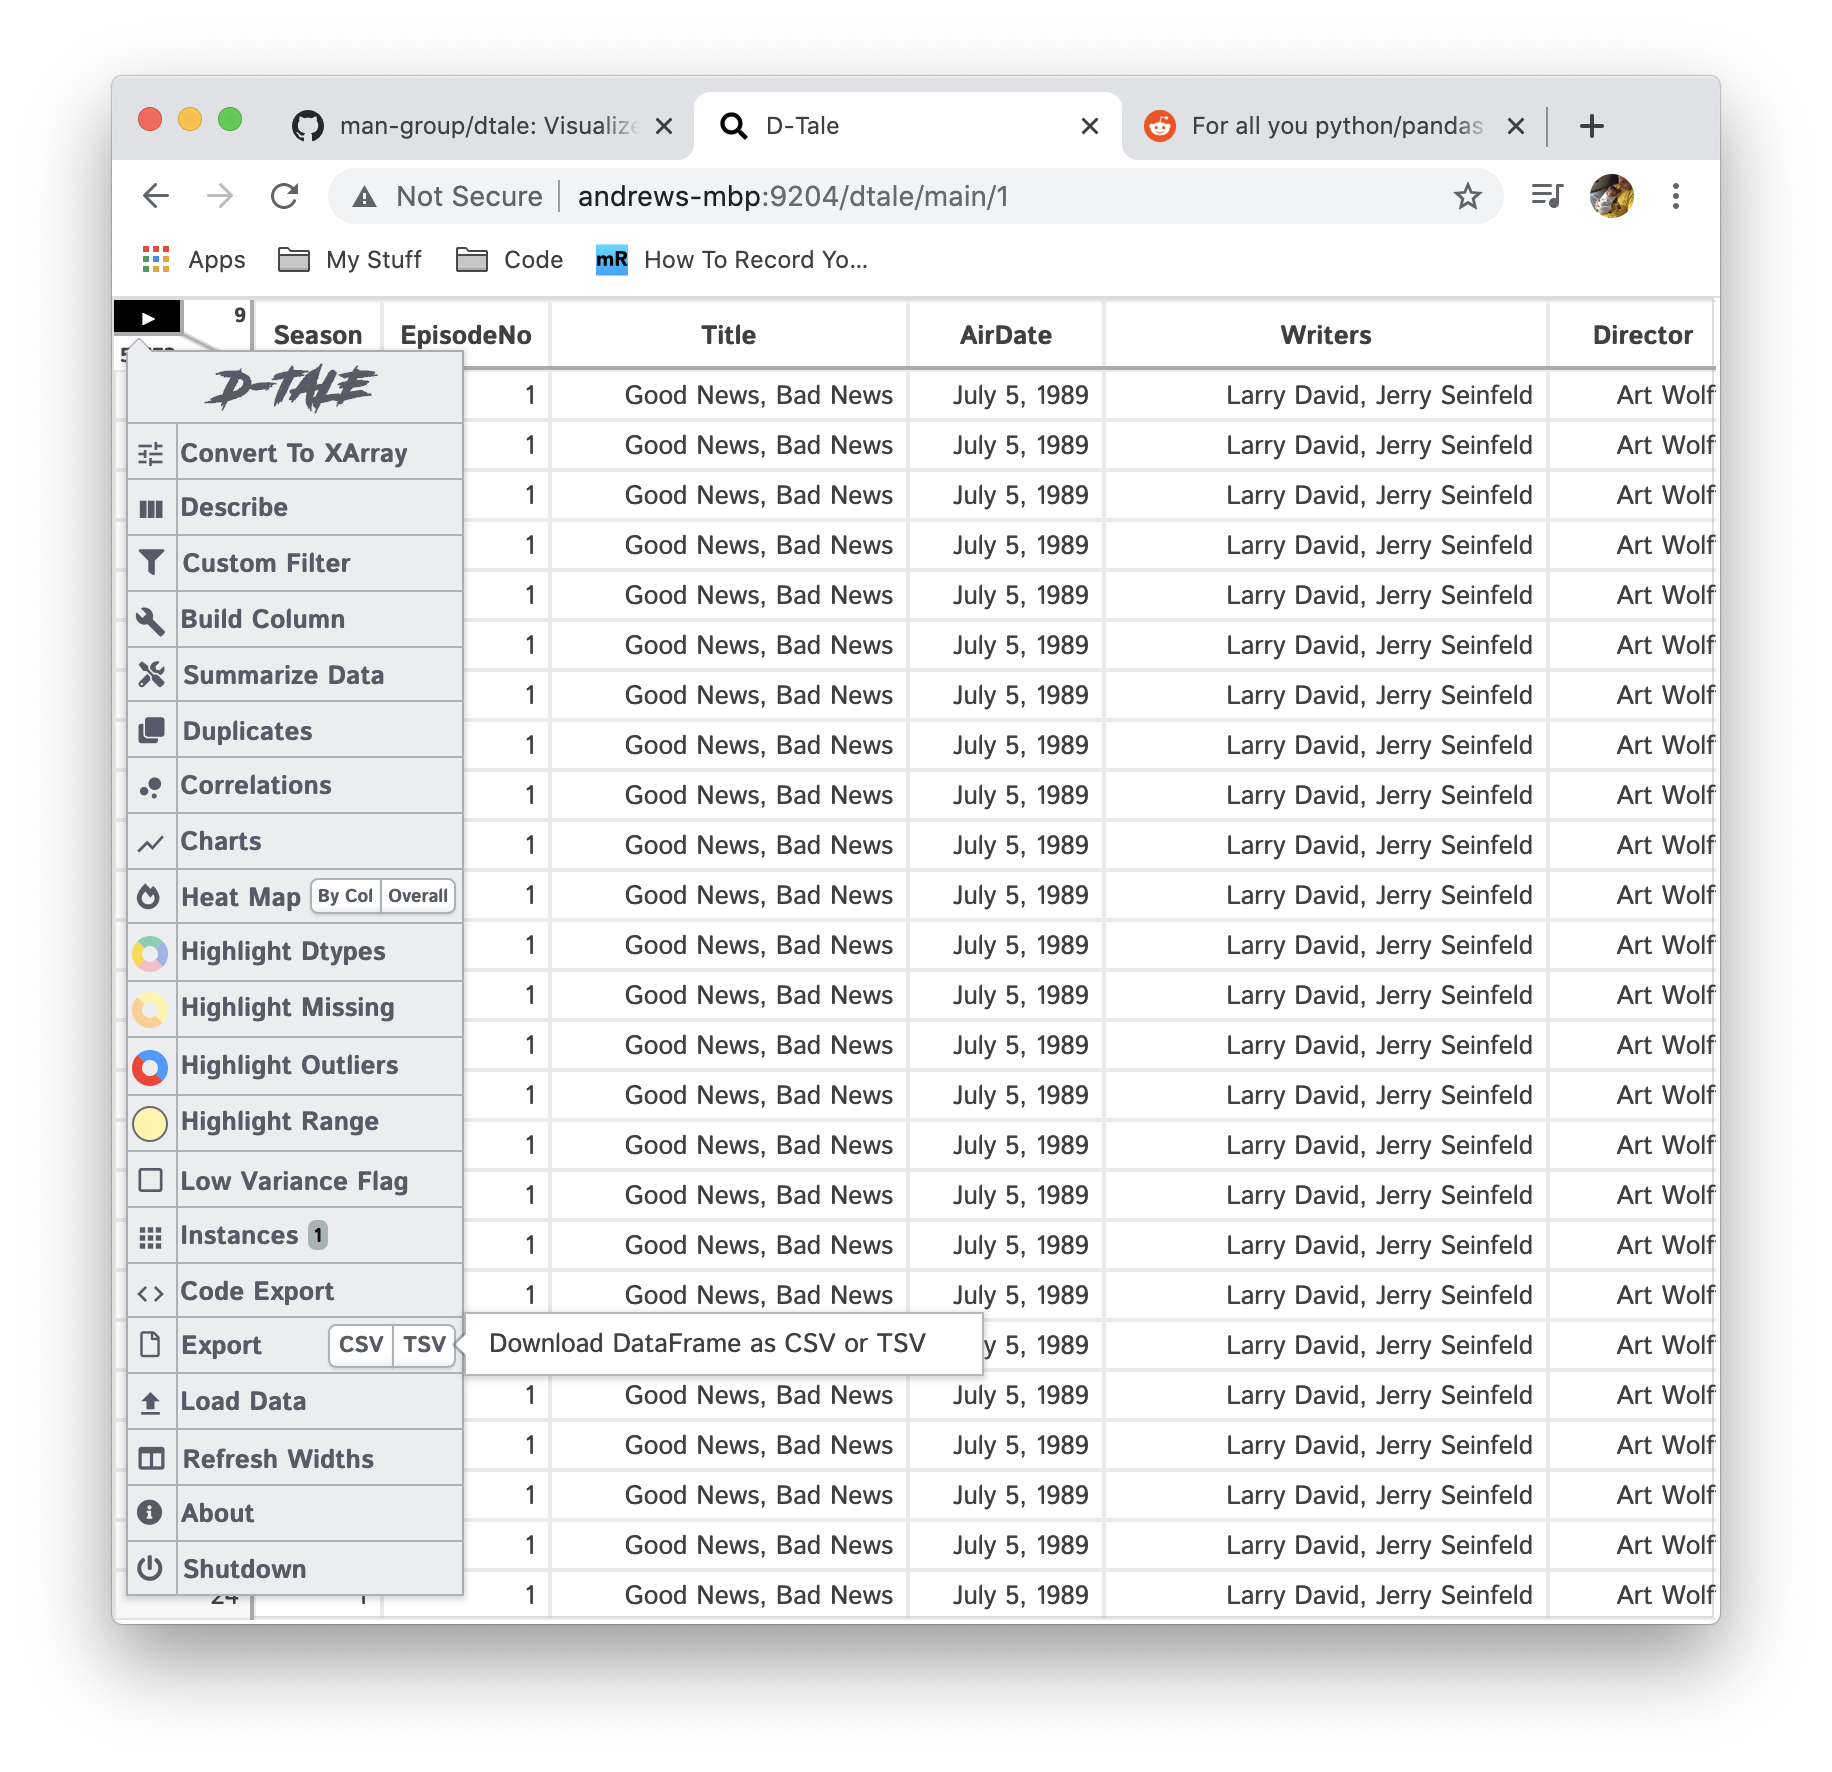
Load Data & Sample Datasets
So either when starting D-Tale with no pre-loaded data or after you've already loaded some data you now have the ability to load data or choose from some sample datasets directly from the GUI:
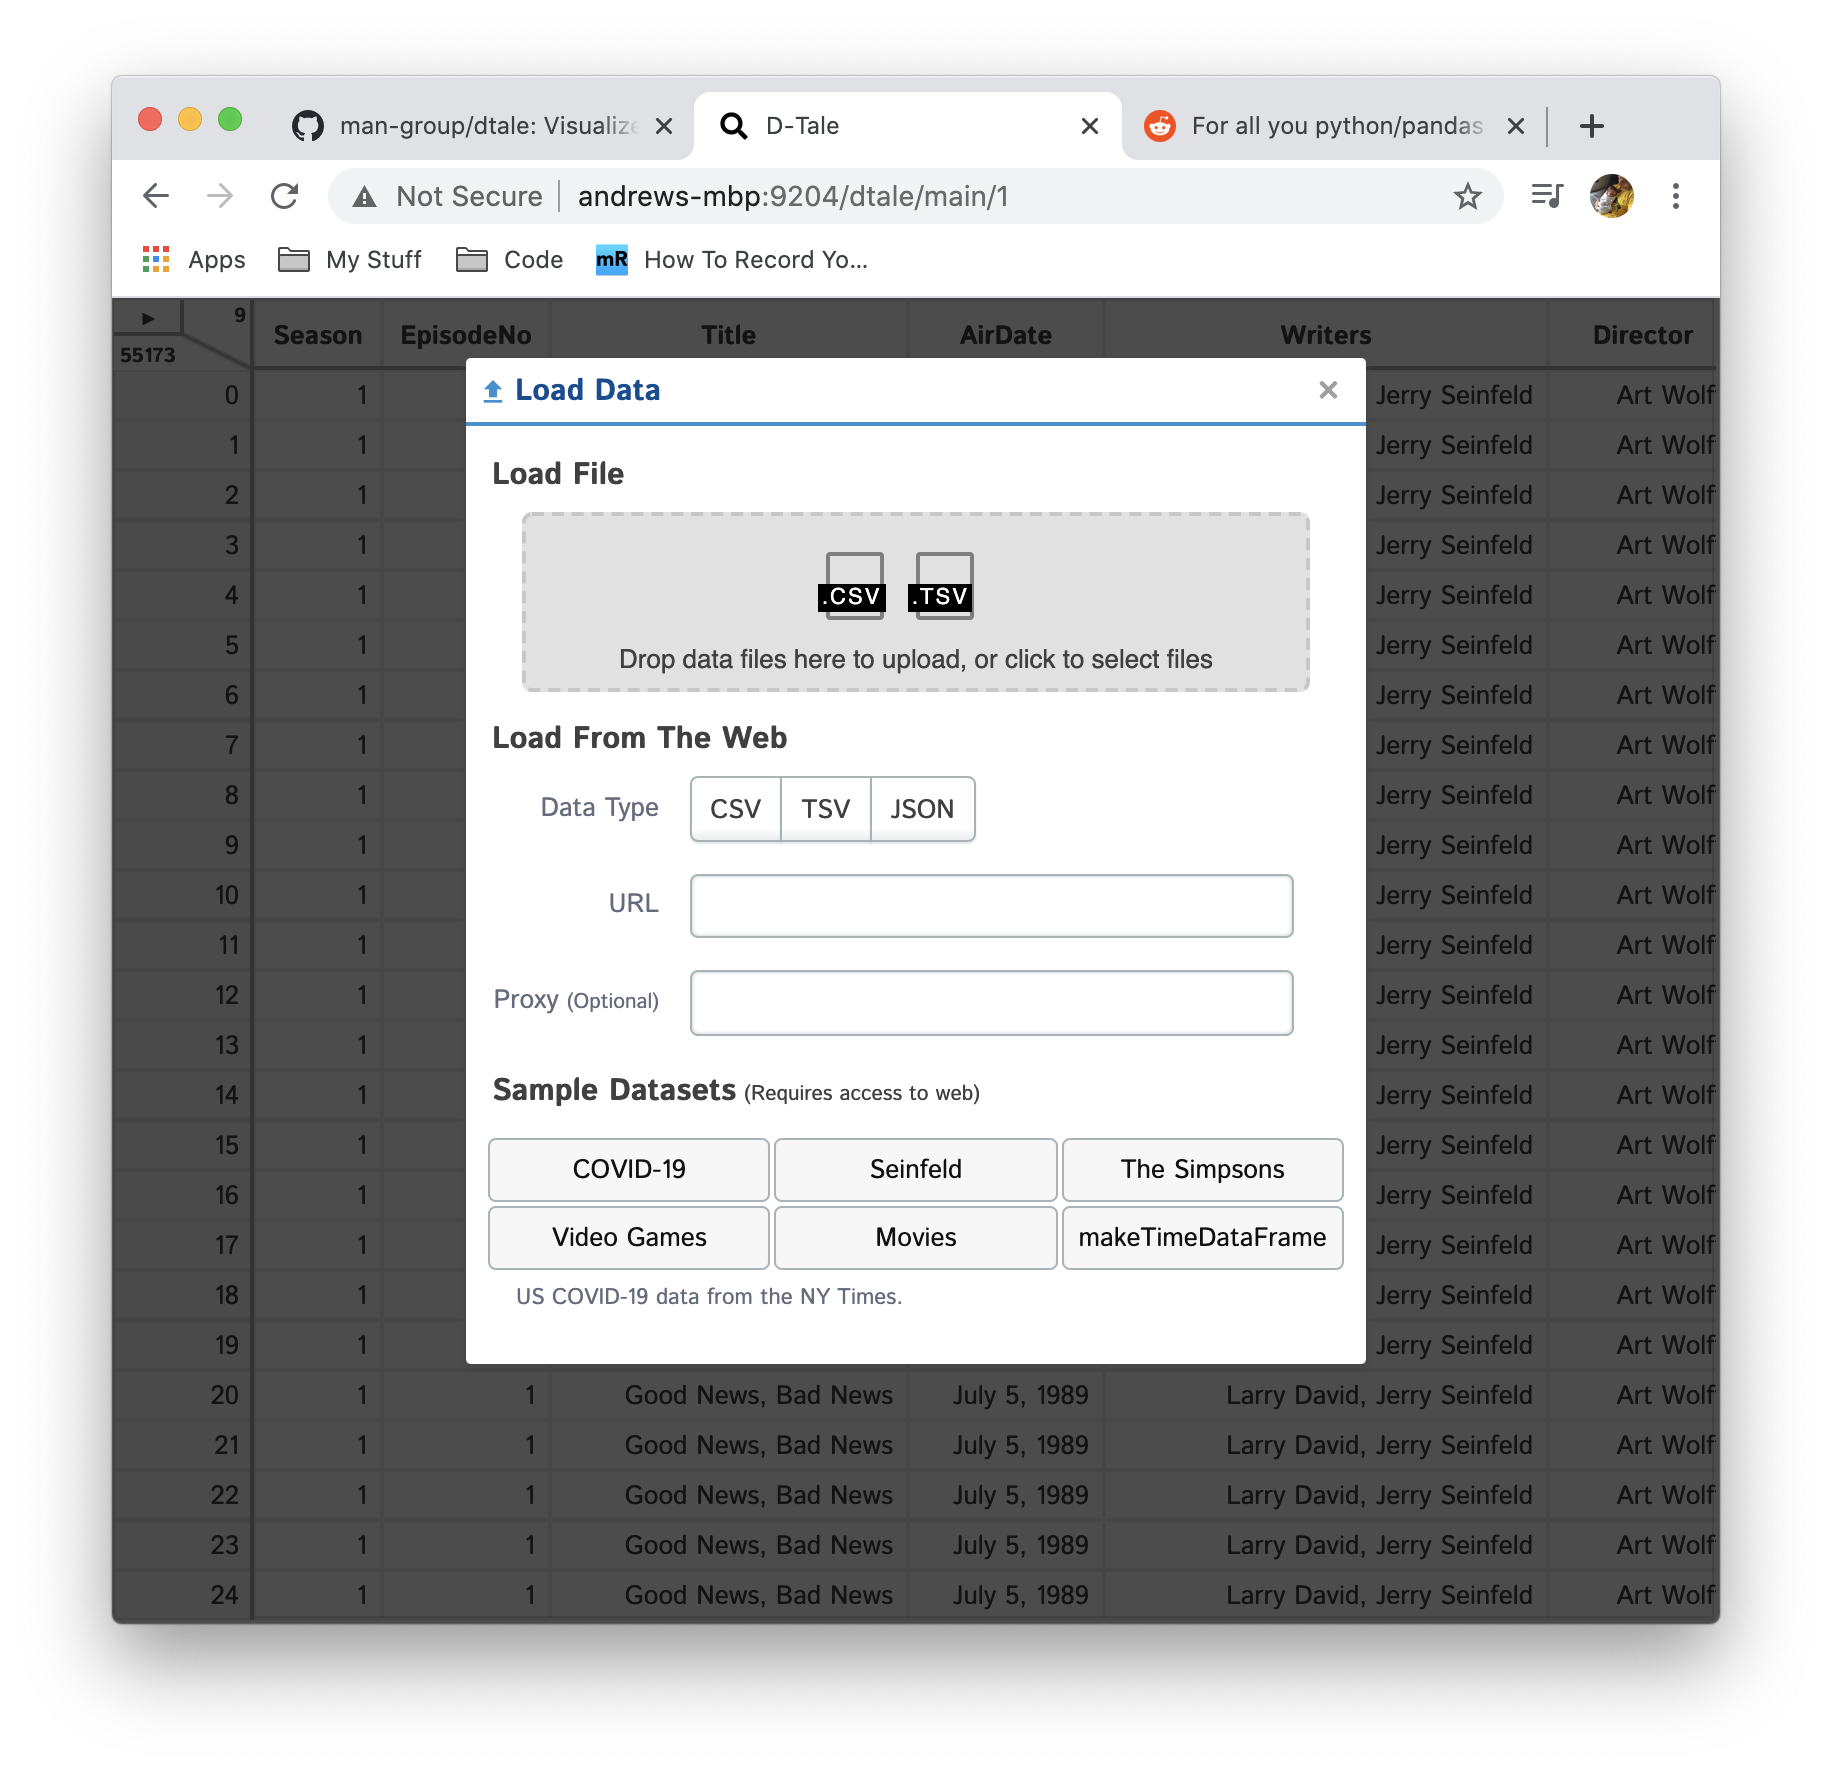
Here's the options at you disposal:
- Load a CSV/TSV file by dragging a file to the dropzone in the top or select a file by clicking the dropzone
- Load a CSV/TSV or JSON directly from the web by entering a URL (also throw in a proxy if you are using one)
- Choose from one of our sample datasets:
- US COVID-19 data from NY Times (updated daily)
- Script breakdowns of popular shows Seinfeld & The Simpsons
- Movie dataset containing release date, director, actors, box office, reviews...
- Video games and their sales
- pandas.util.testing.makeTimeDataFrame
Starting with version 3.9.0 web uploads will be turned off by default. Web uploads are vulnerable to blind server side request forgery, please only use in trusted environments.
You can turn this feature on by doing one of the following:
- add
enable_web_uploads=Trueto yourdtale.showcall - add
enable_web_uploads = Falseto the [app] section of your dtale.ini config file (more info) - run this code before calling dtale.show:
import dtale.global_state as global_state
global_state.set_app_settings(dict(enable_web_uploads=True))
Instances
This will give you information about other D-Tale instances are running under your current Python process.
For example, if you ran the following script:
import pandas as pd
import dtale

dtale.show(pd.DataFrame([dict(foo=1, bar=2, biz=3, baz=4, snoopy_D_O_double_gizzle=5)]))
dtale.show(pd.DataFrame([
    dict(a=1, b=2, c=3, d=4),
    dict(a=2, b=3, c=4, d=5),
    dict(a=3, b=4, c=5, d=6),
    dict(a=4, b=5, c=6, d=7)
]))
dtale.show(pd.DataFrame([range(6), range(6), range(6), range(6), range(6), range(6)]), name="foo")
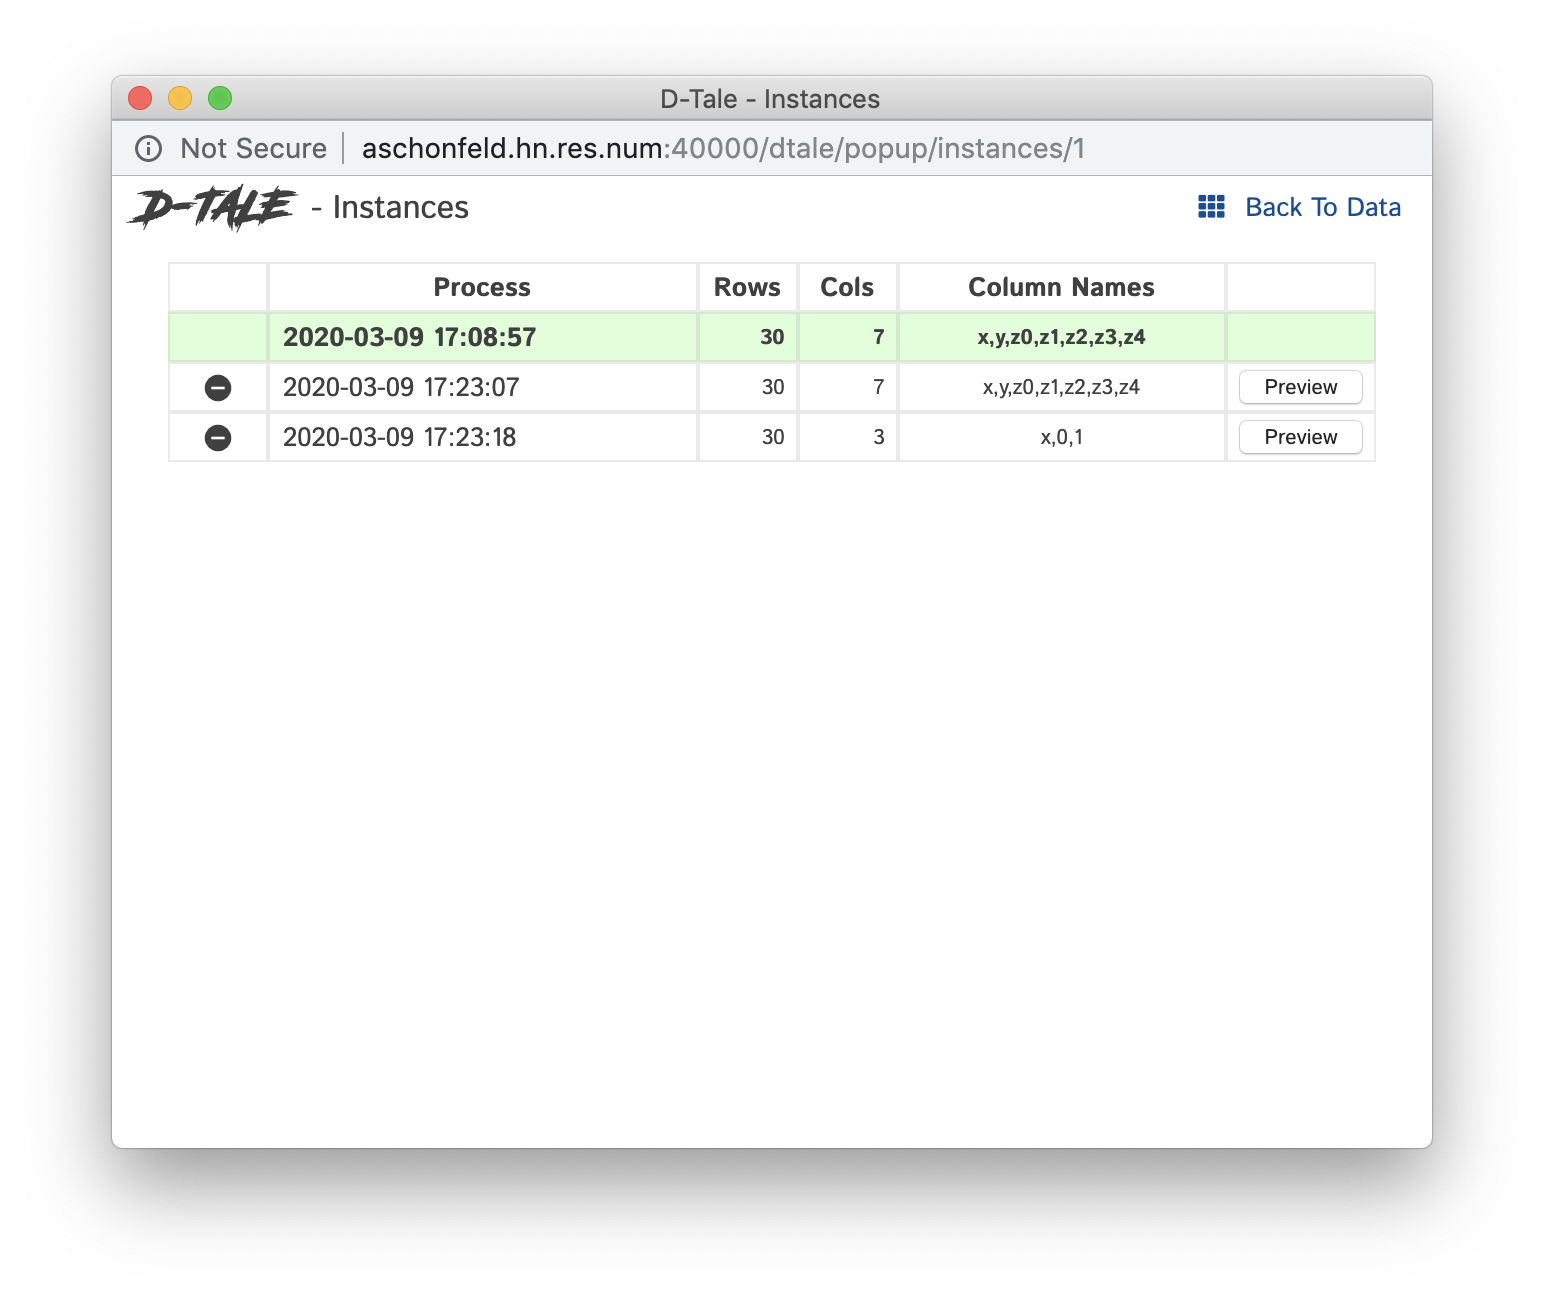
This will make the Instances button available in all 3 of these D-Tale instances. Clicking that button while in the first instance invoked above will give you this popup:
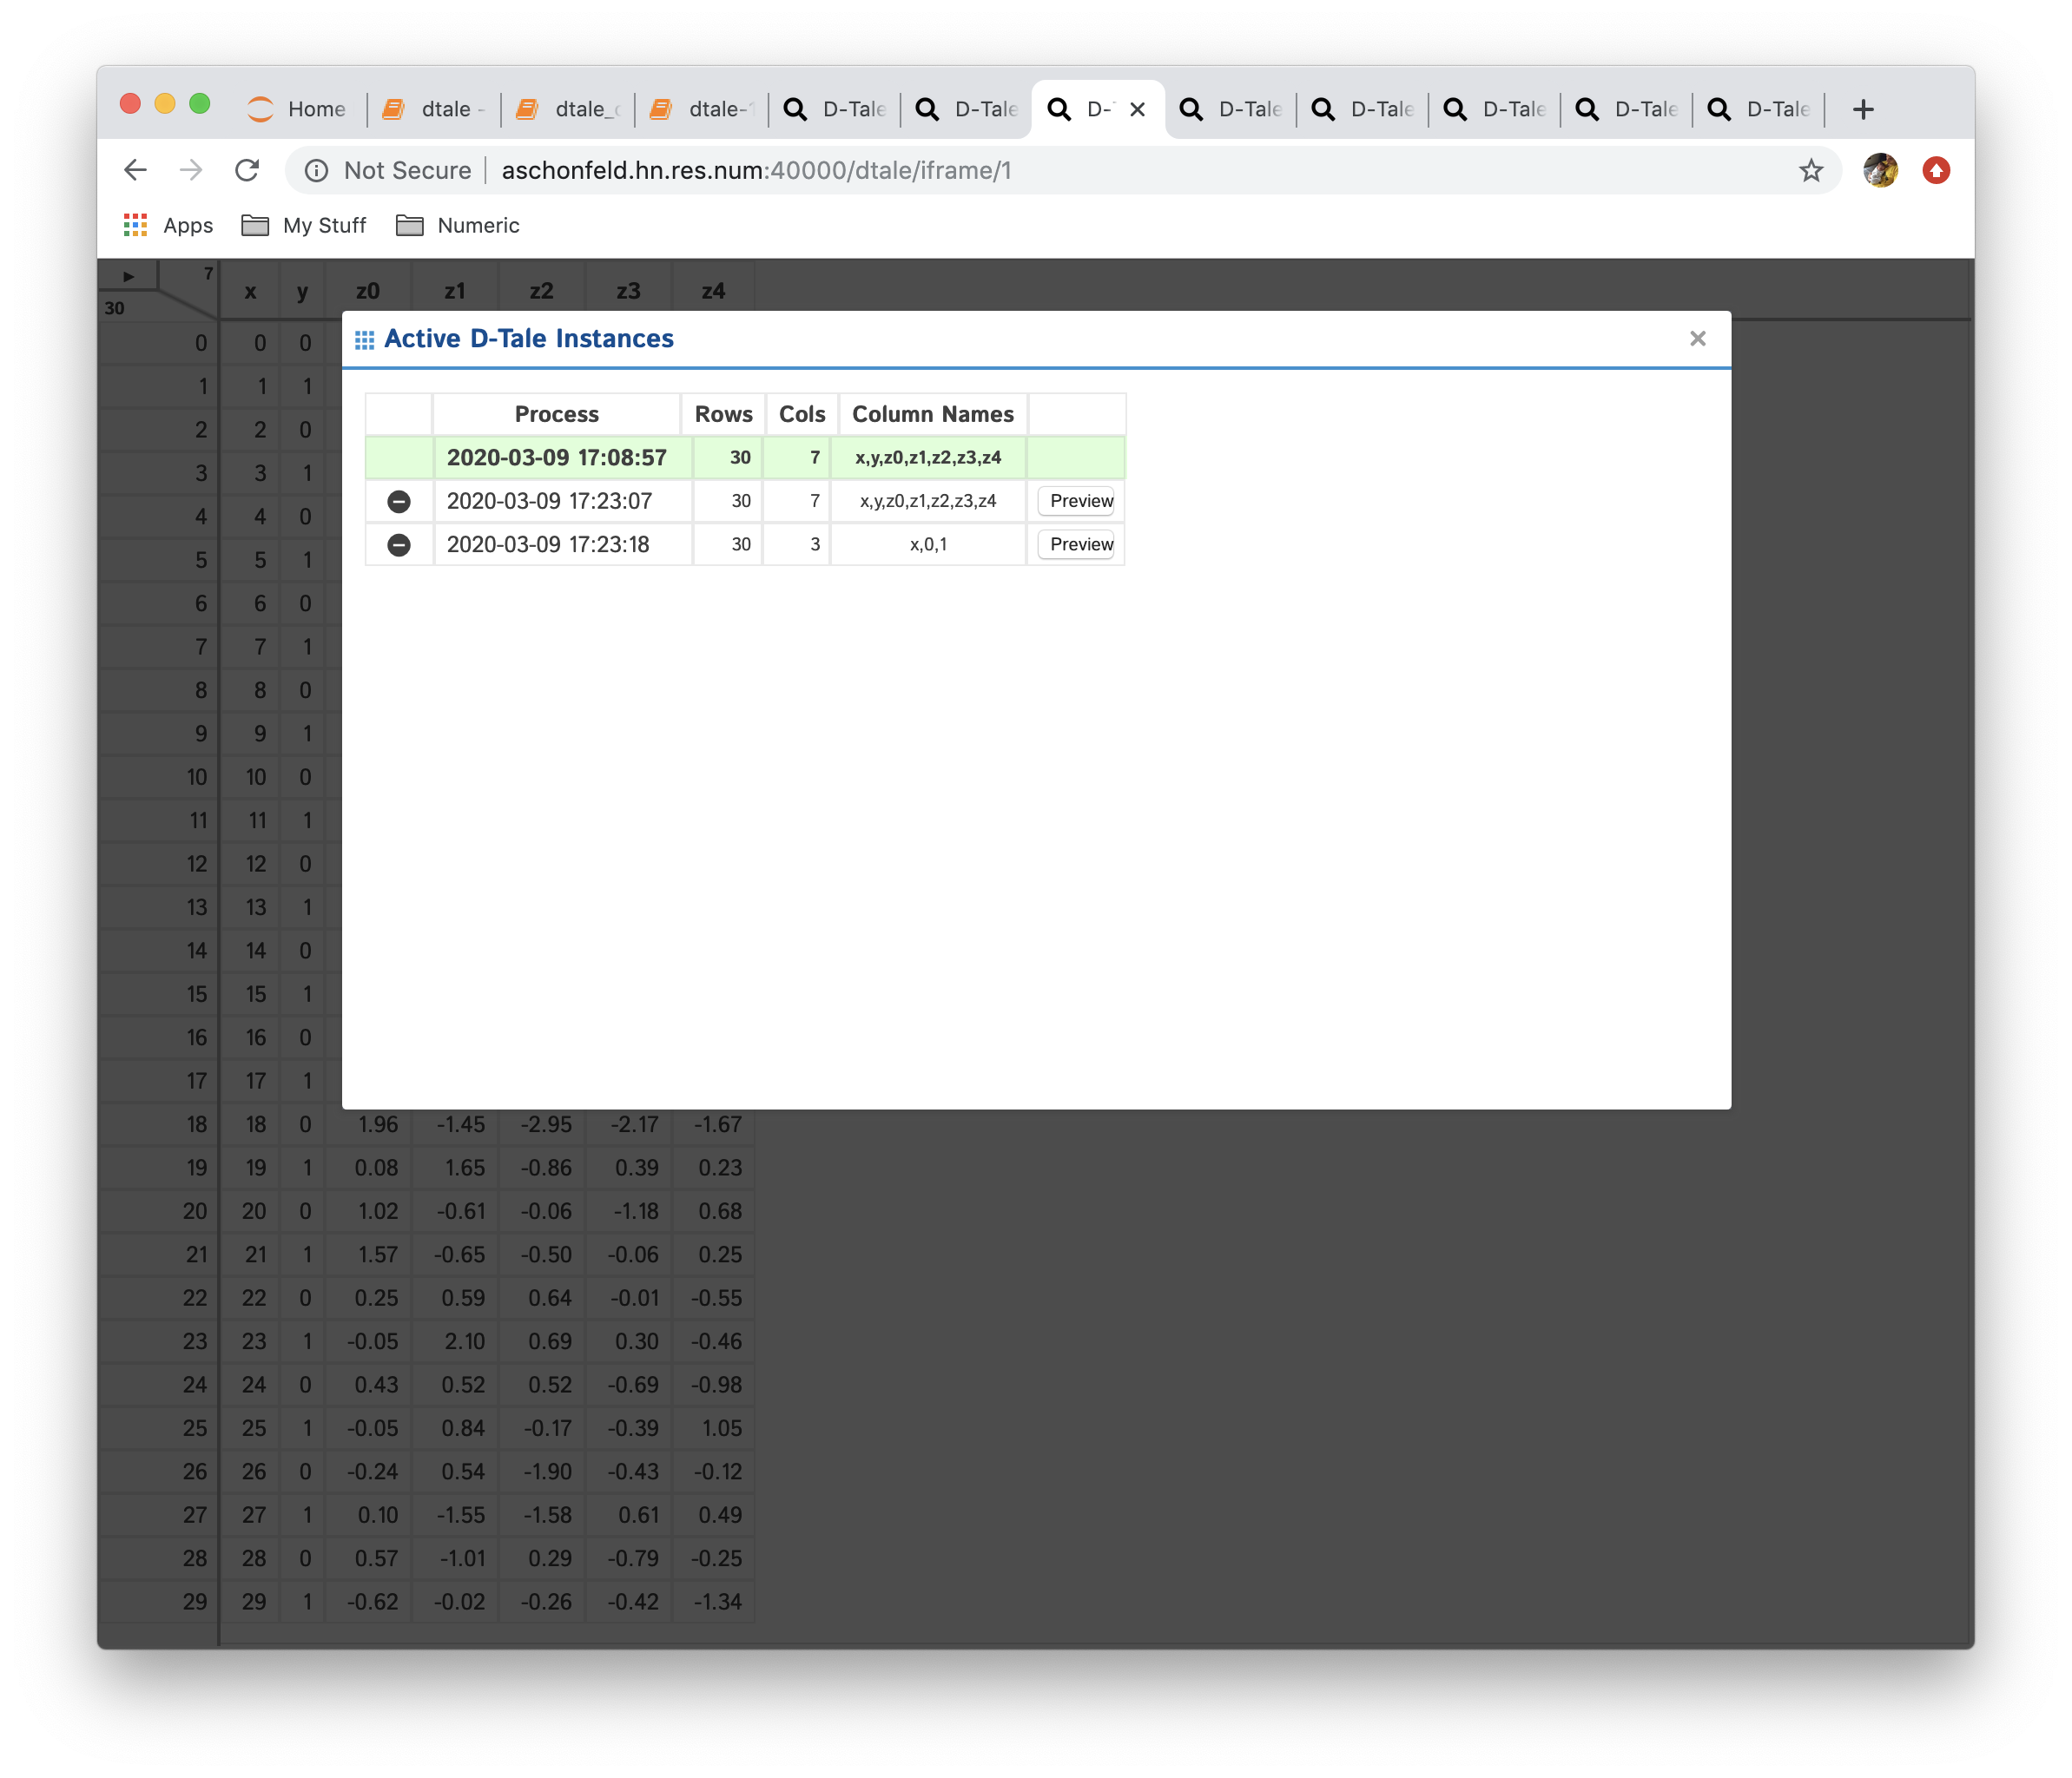
The grid above contains the following information:
- Process: timestamp when the process was started along with the name (if specified in
dtale.show()) - Rows: number of rows
- Columns: number of columns
- Column Names: comma-separated string of column names (only first 30 characters, hover for full listing)
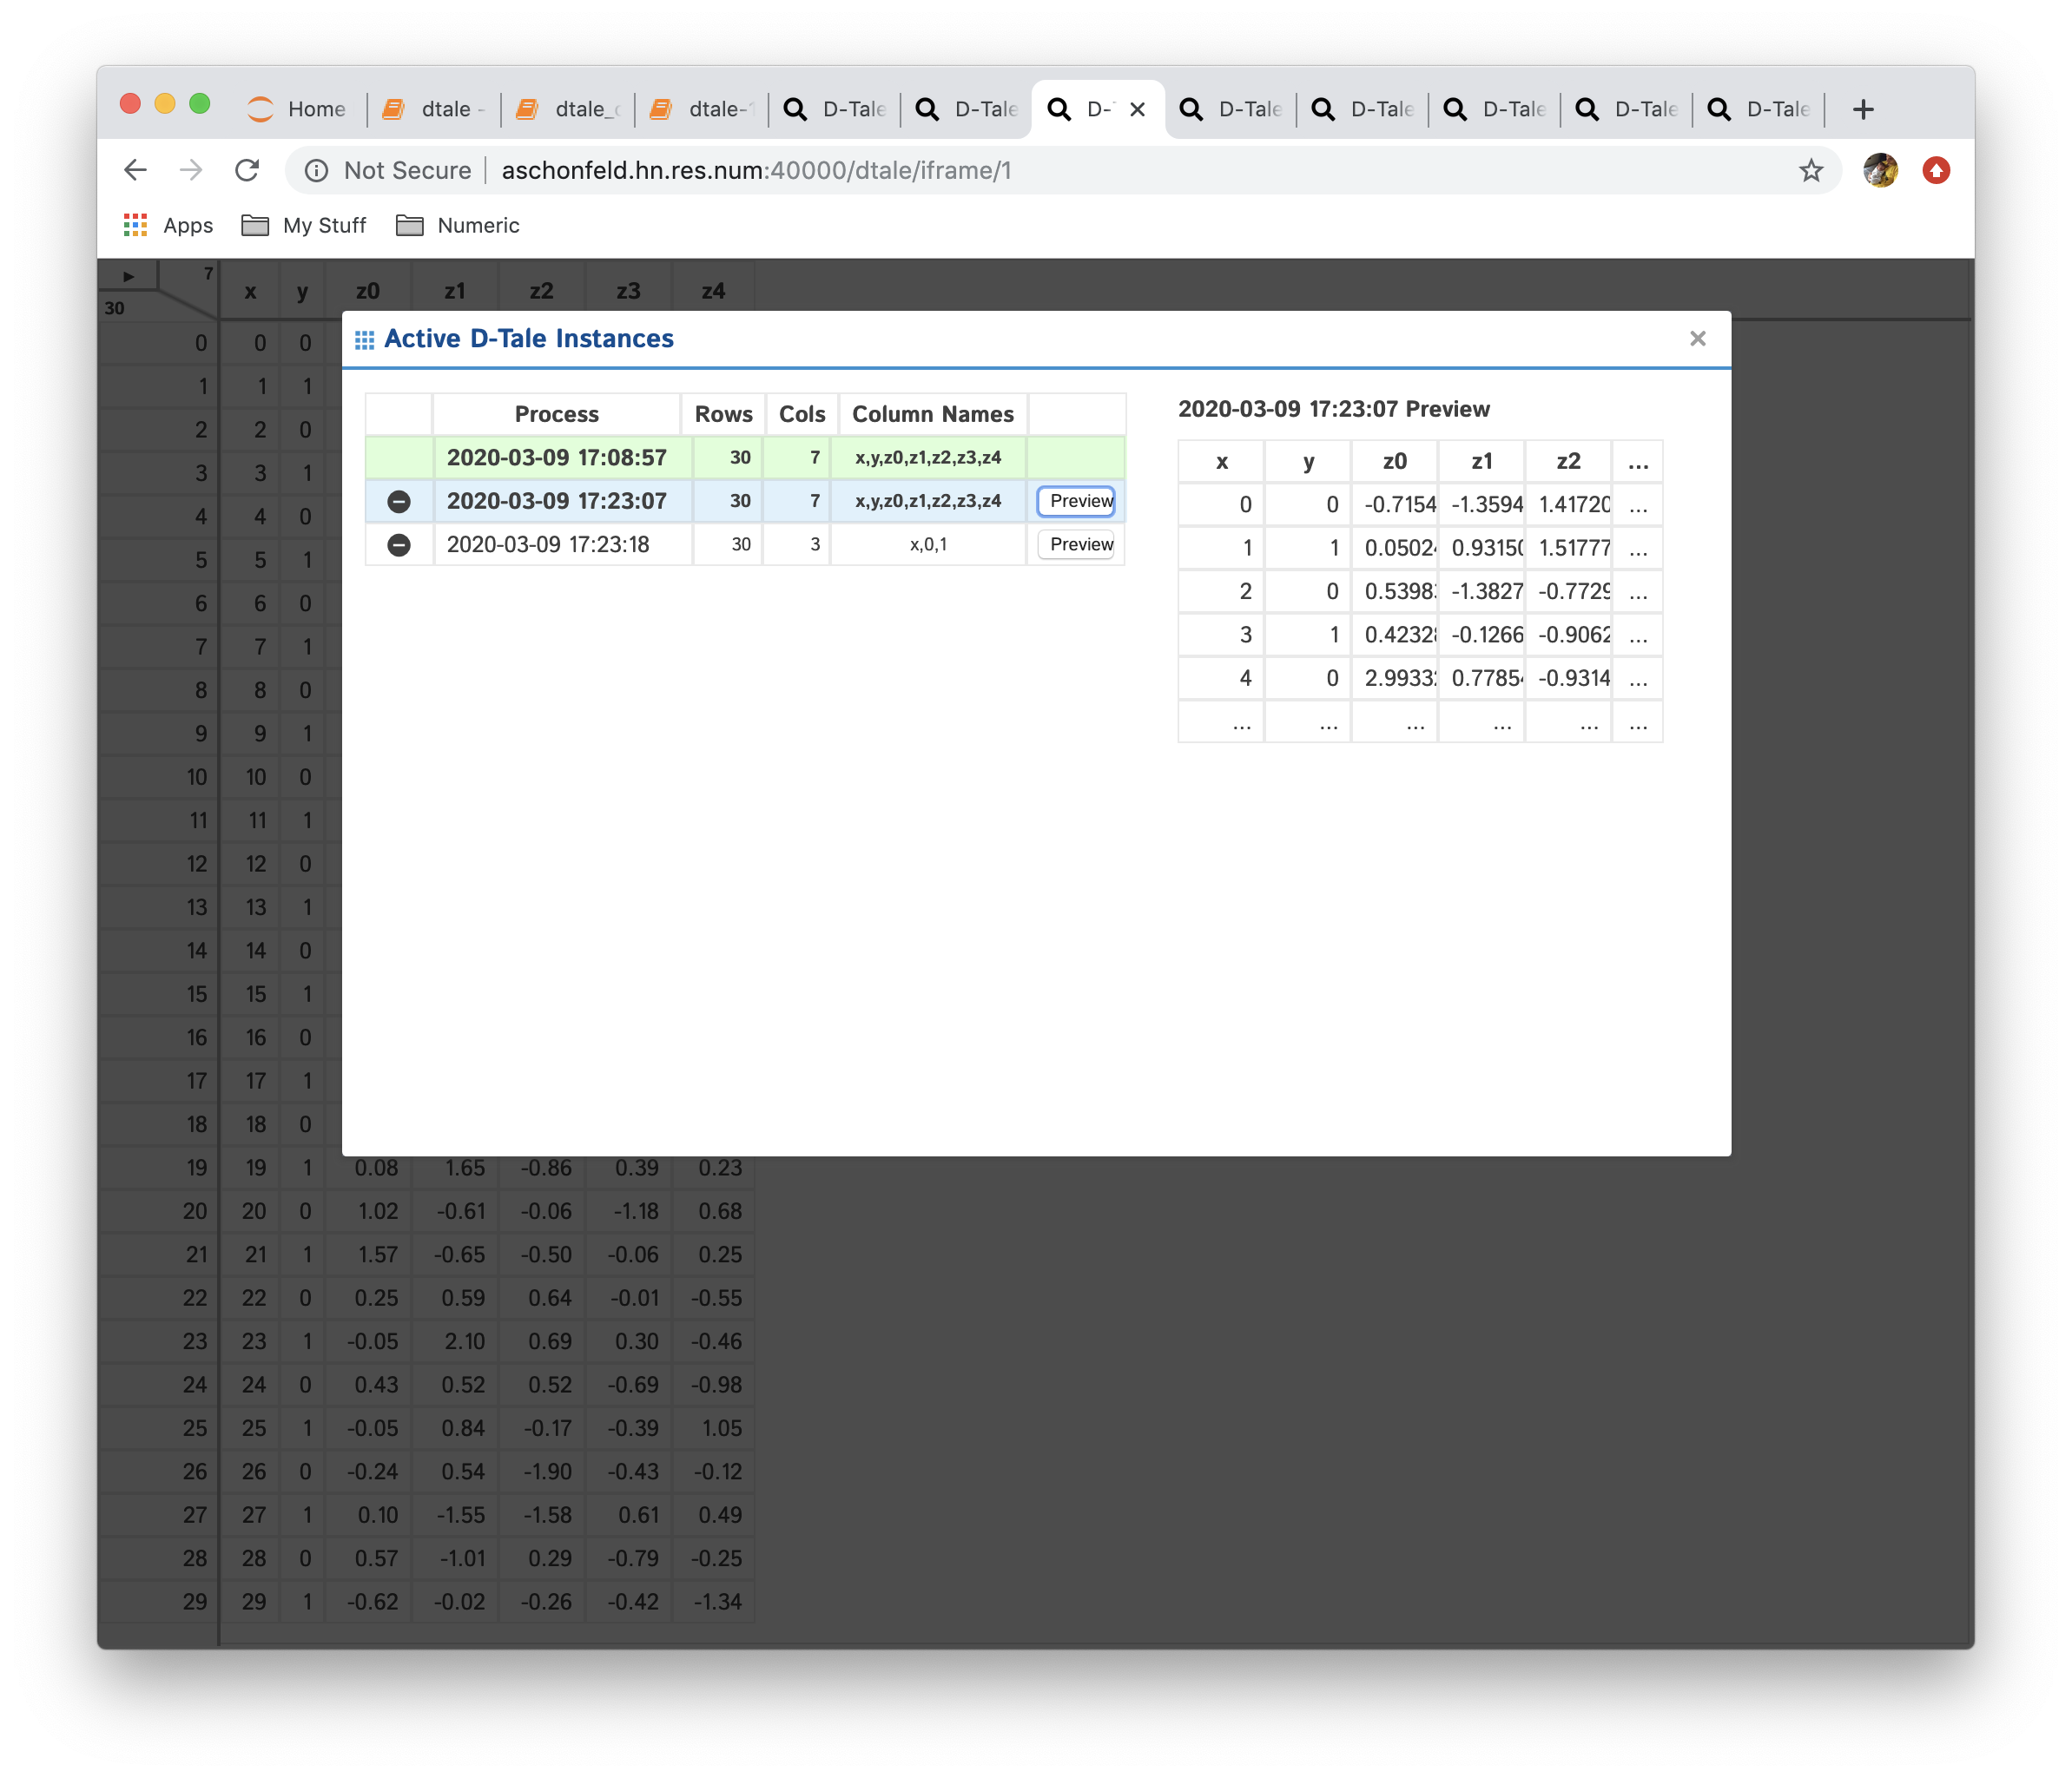
- Preview: this button is available any of the non-current instances. Clicking this will bring up left-most 5X5 grid information for that instance
- The row highlighted in green signifys the current D-Tale instance
- Any other row can be clicked to switch to that D-Tale instance
Here is an example of clicking the "Preview" button:
About
This will give you information about what version of D-Tale you're running as well as if its out of date to whats on PyPi.
| Up To Date | Out Of Date |
|---|---|
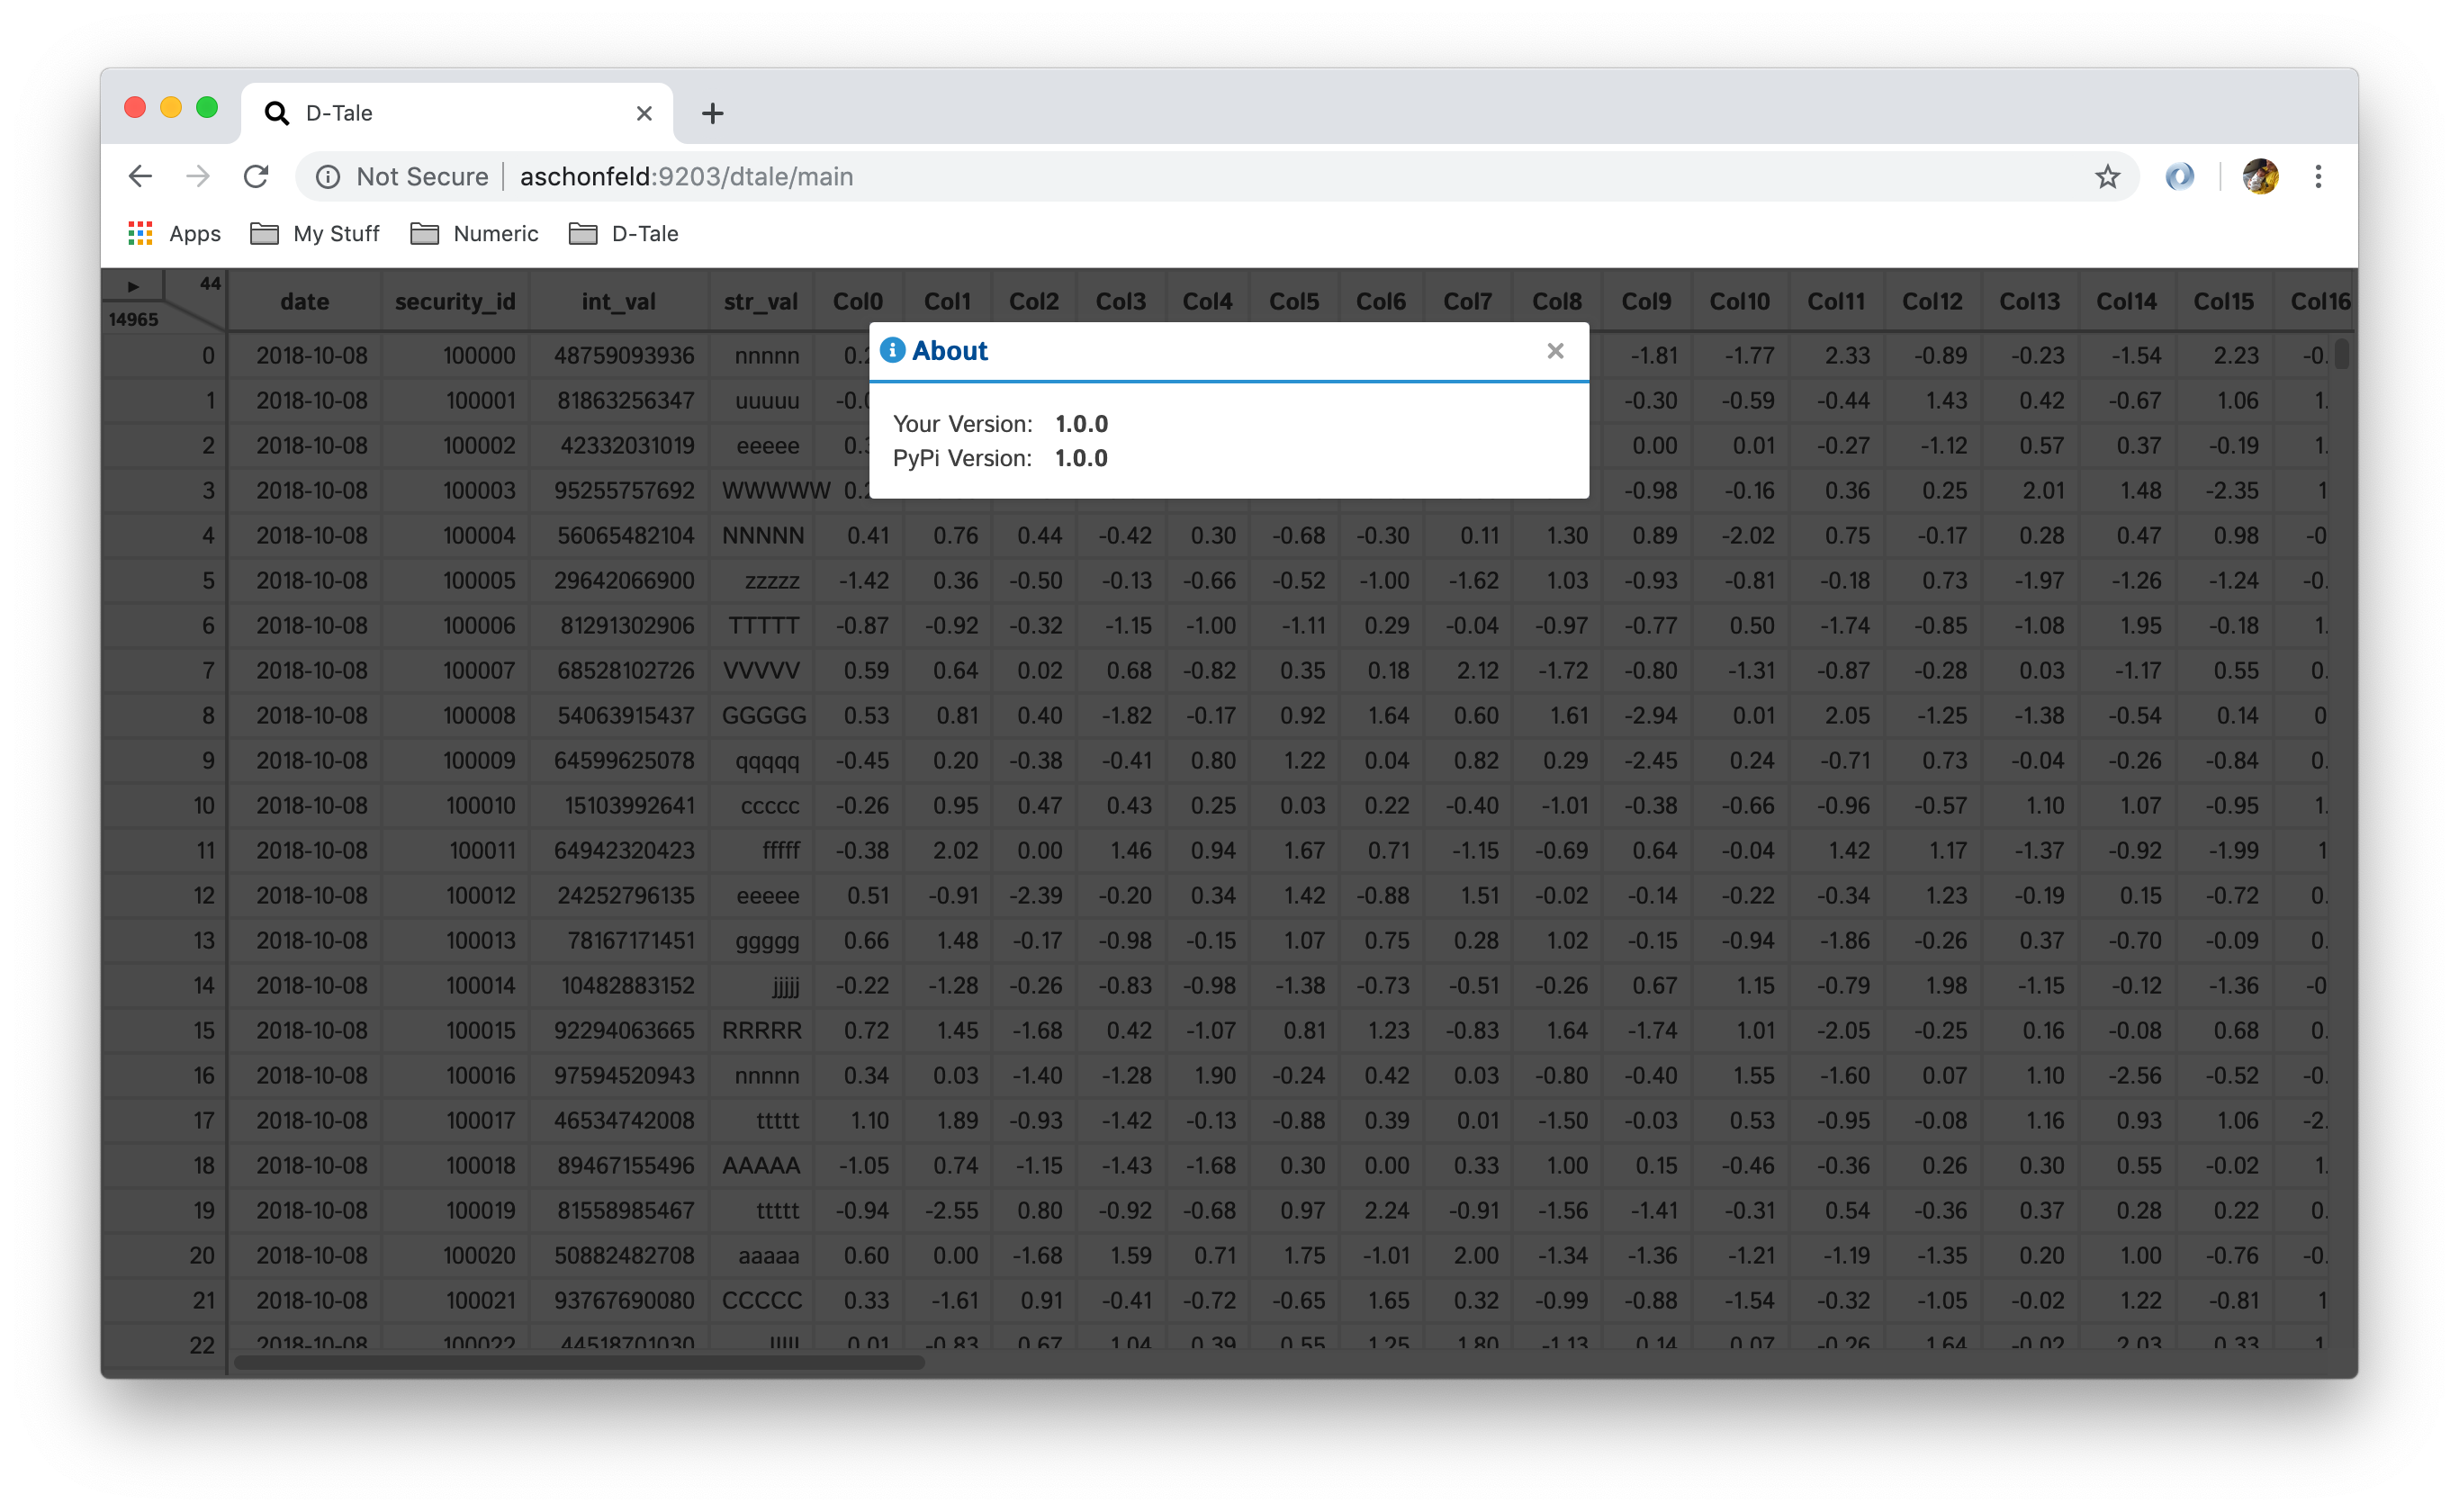 | 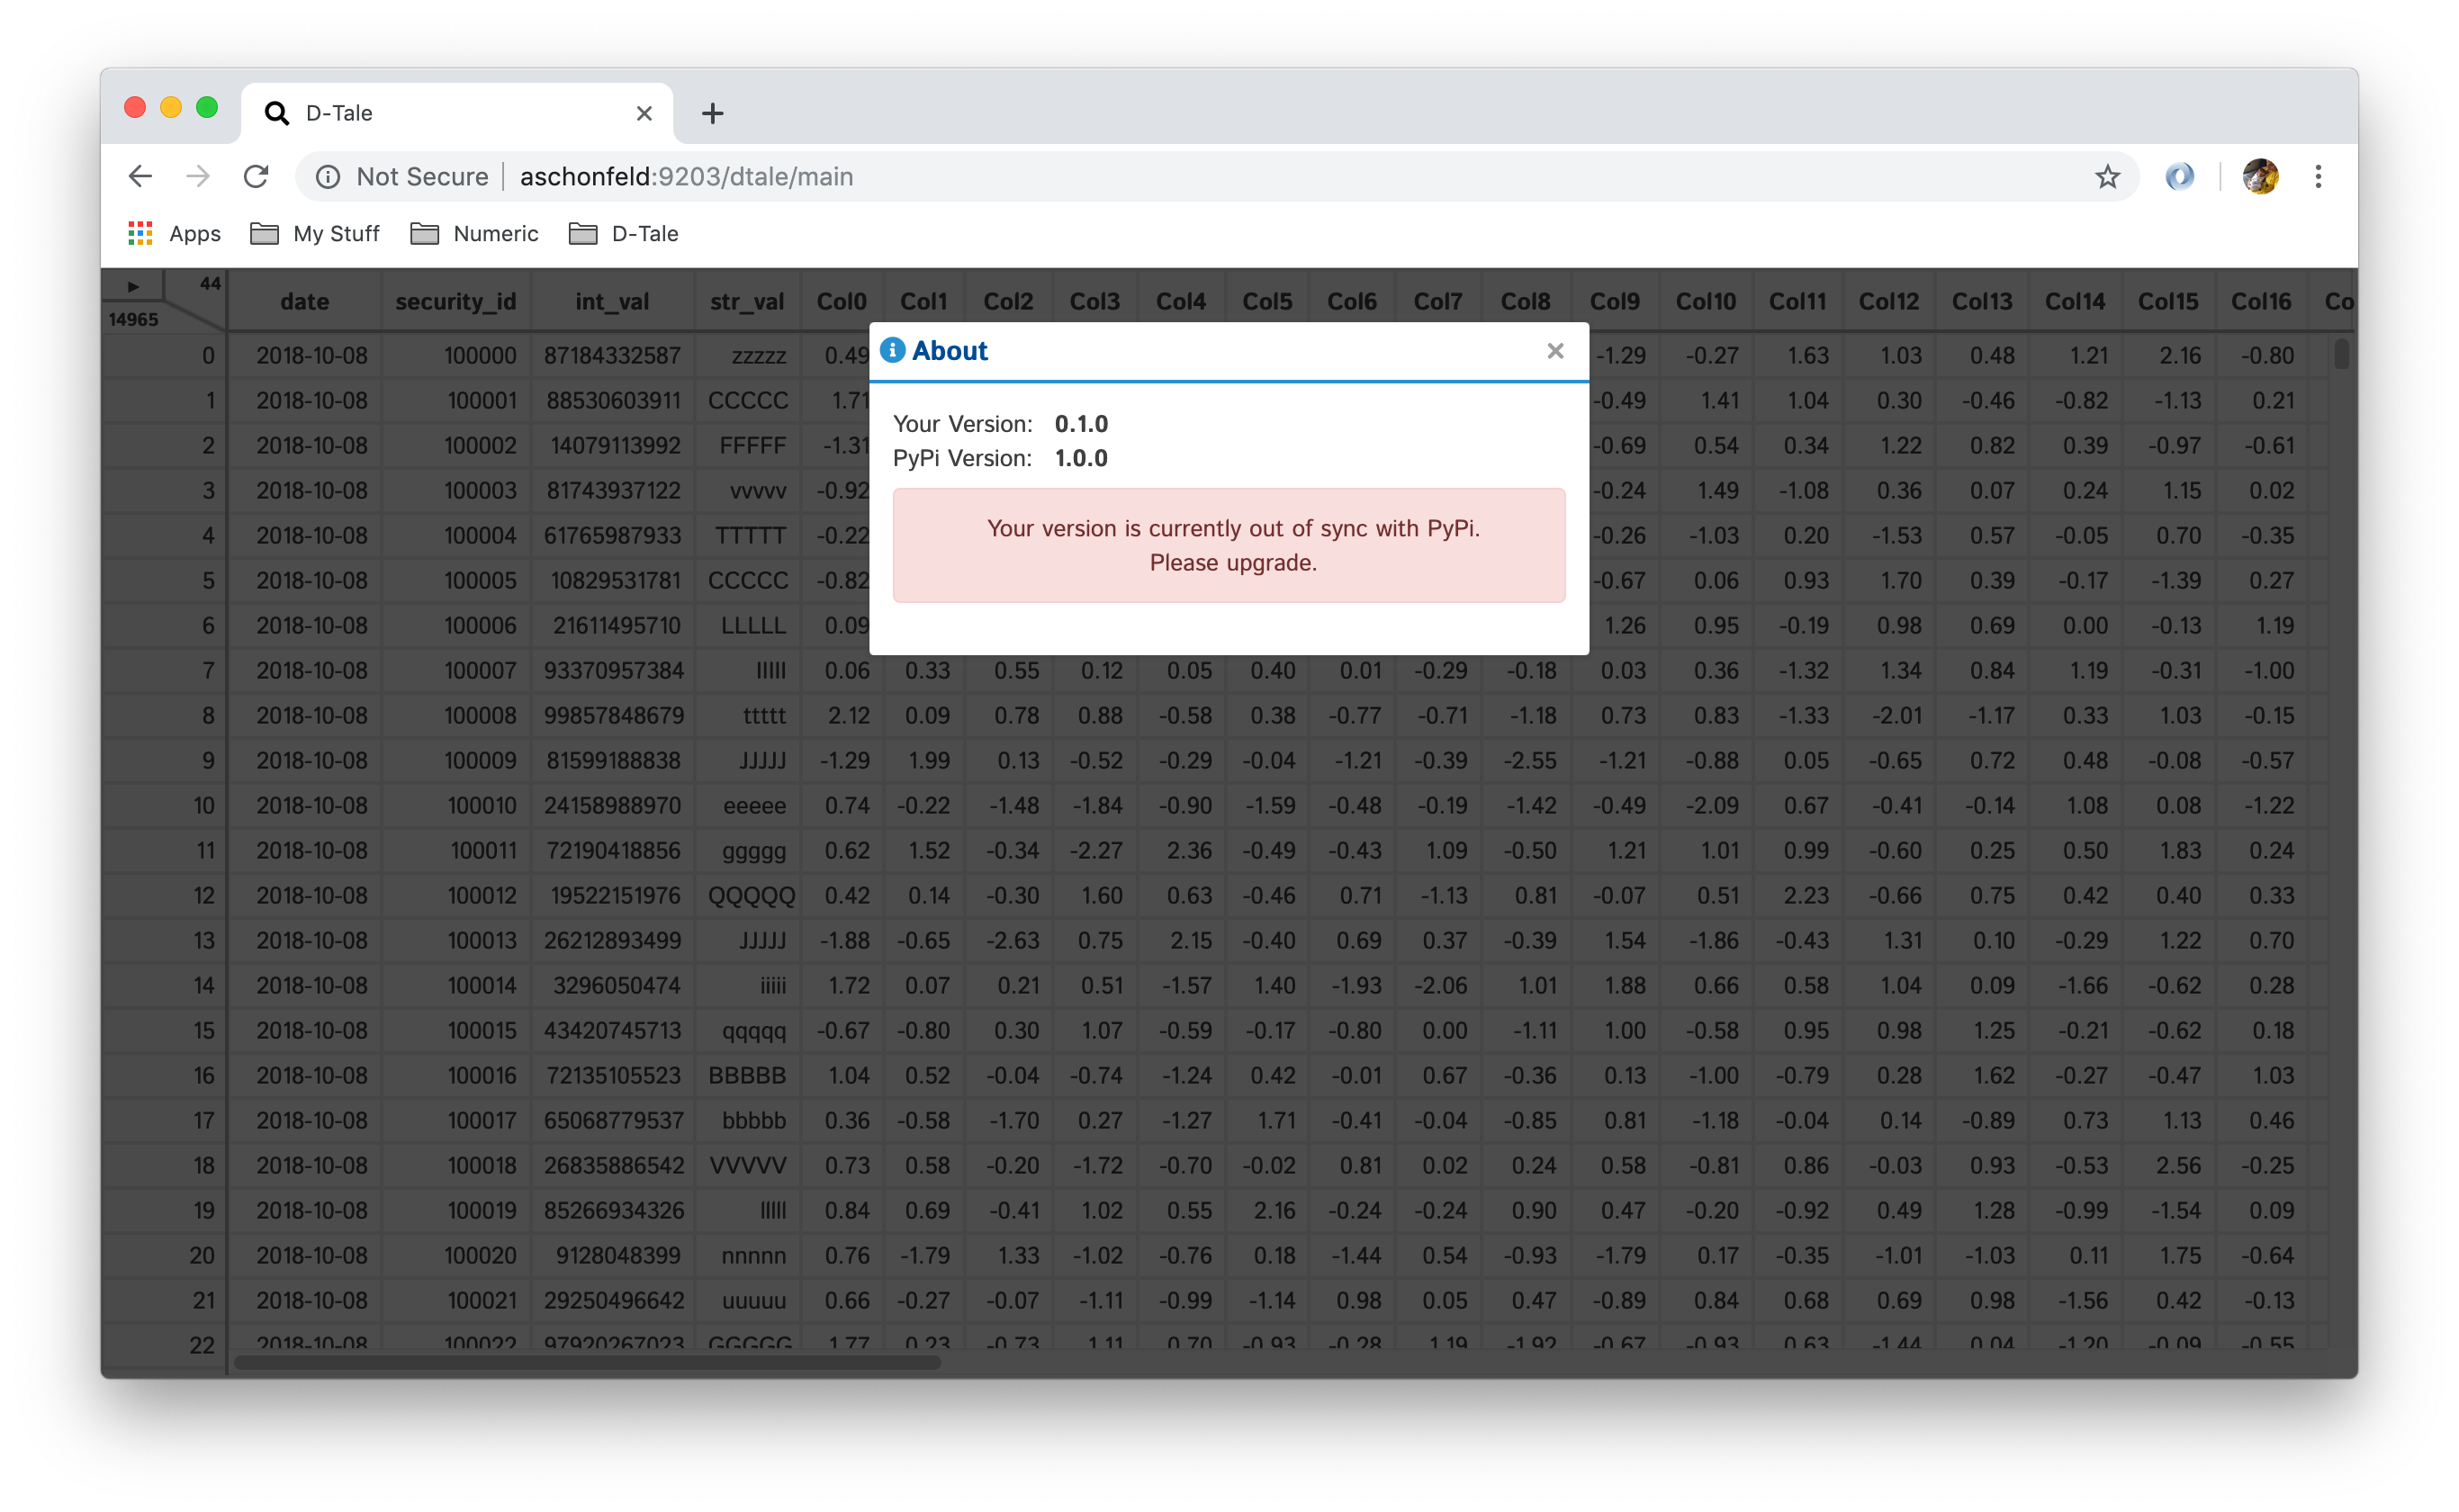 |
Refresh Widths
Mostly a fail-safe in the event that your columns are no longer lining up. Click this and should fix that
Theme
Toggle between light & dark themes for your viewing pleasure (only affects grid, not popups or charts).
| Light | Dark |
|---|---|
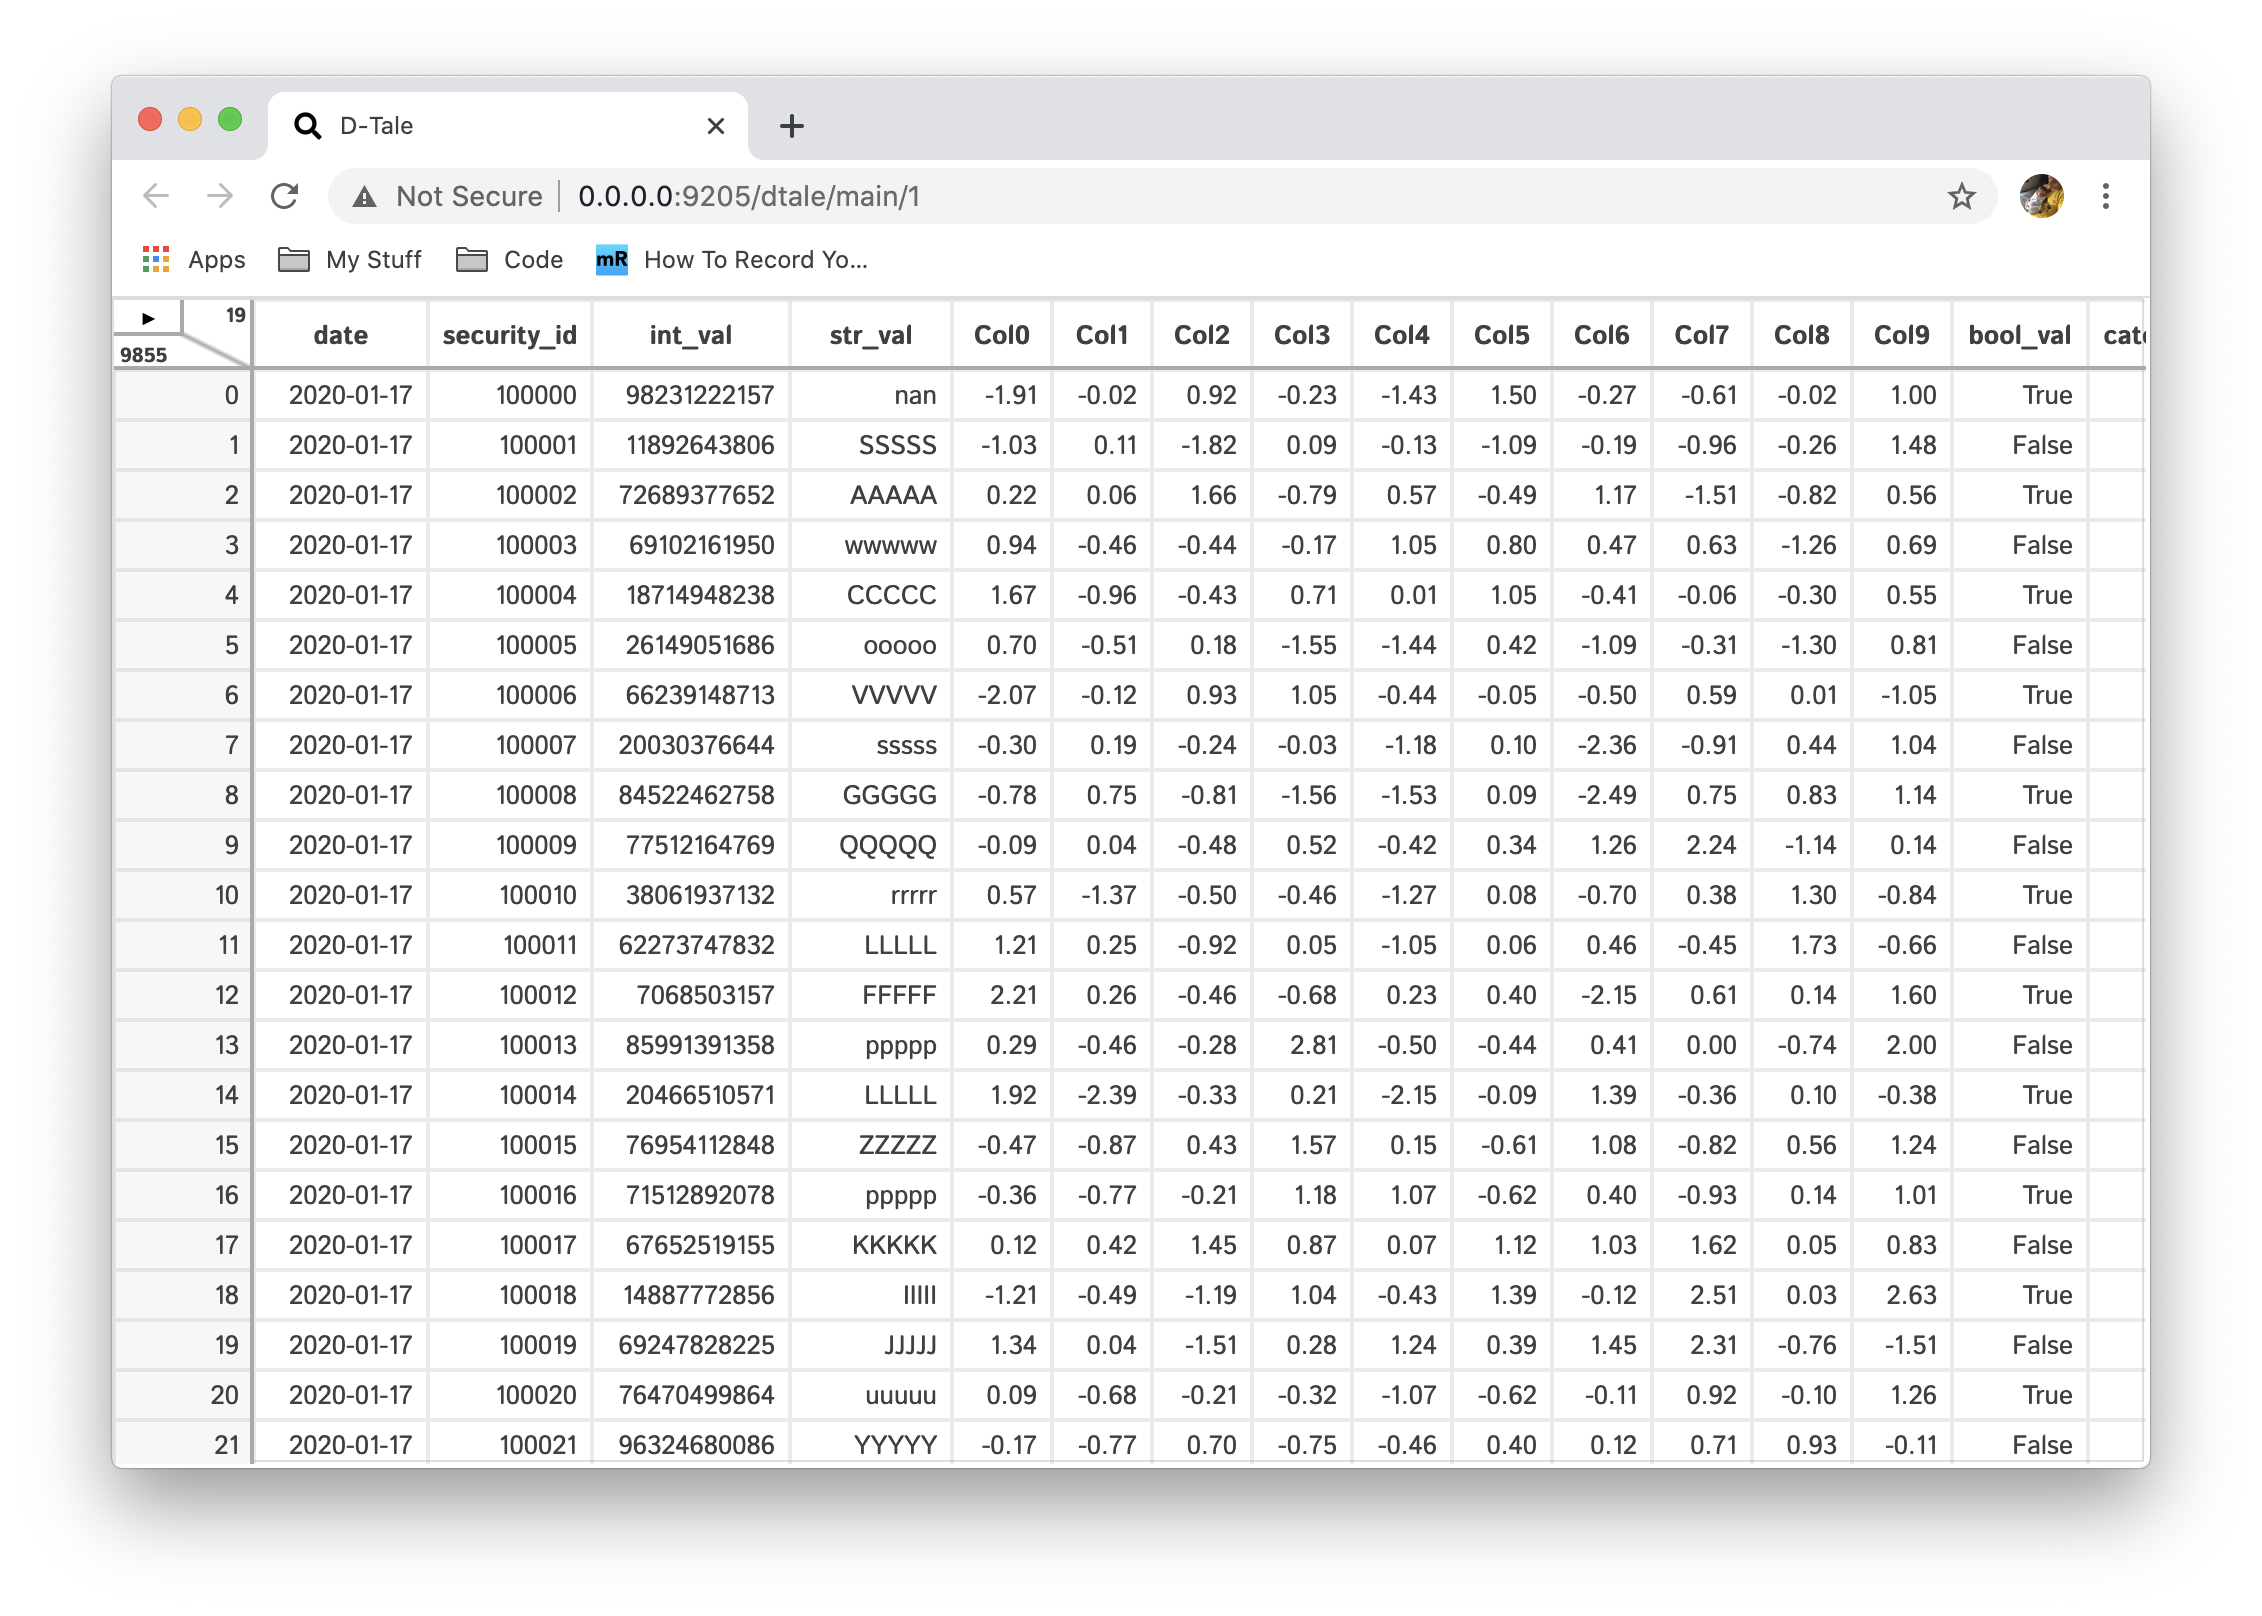 | 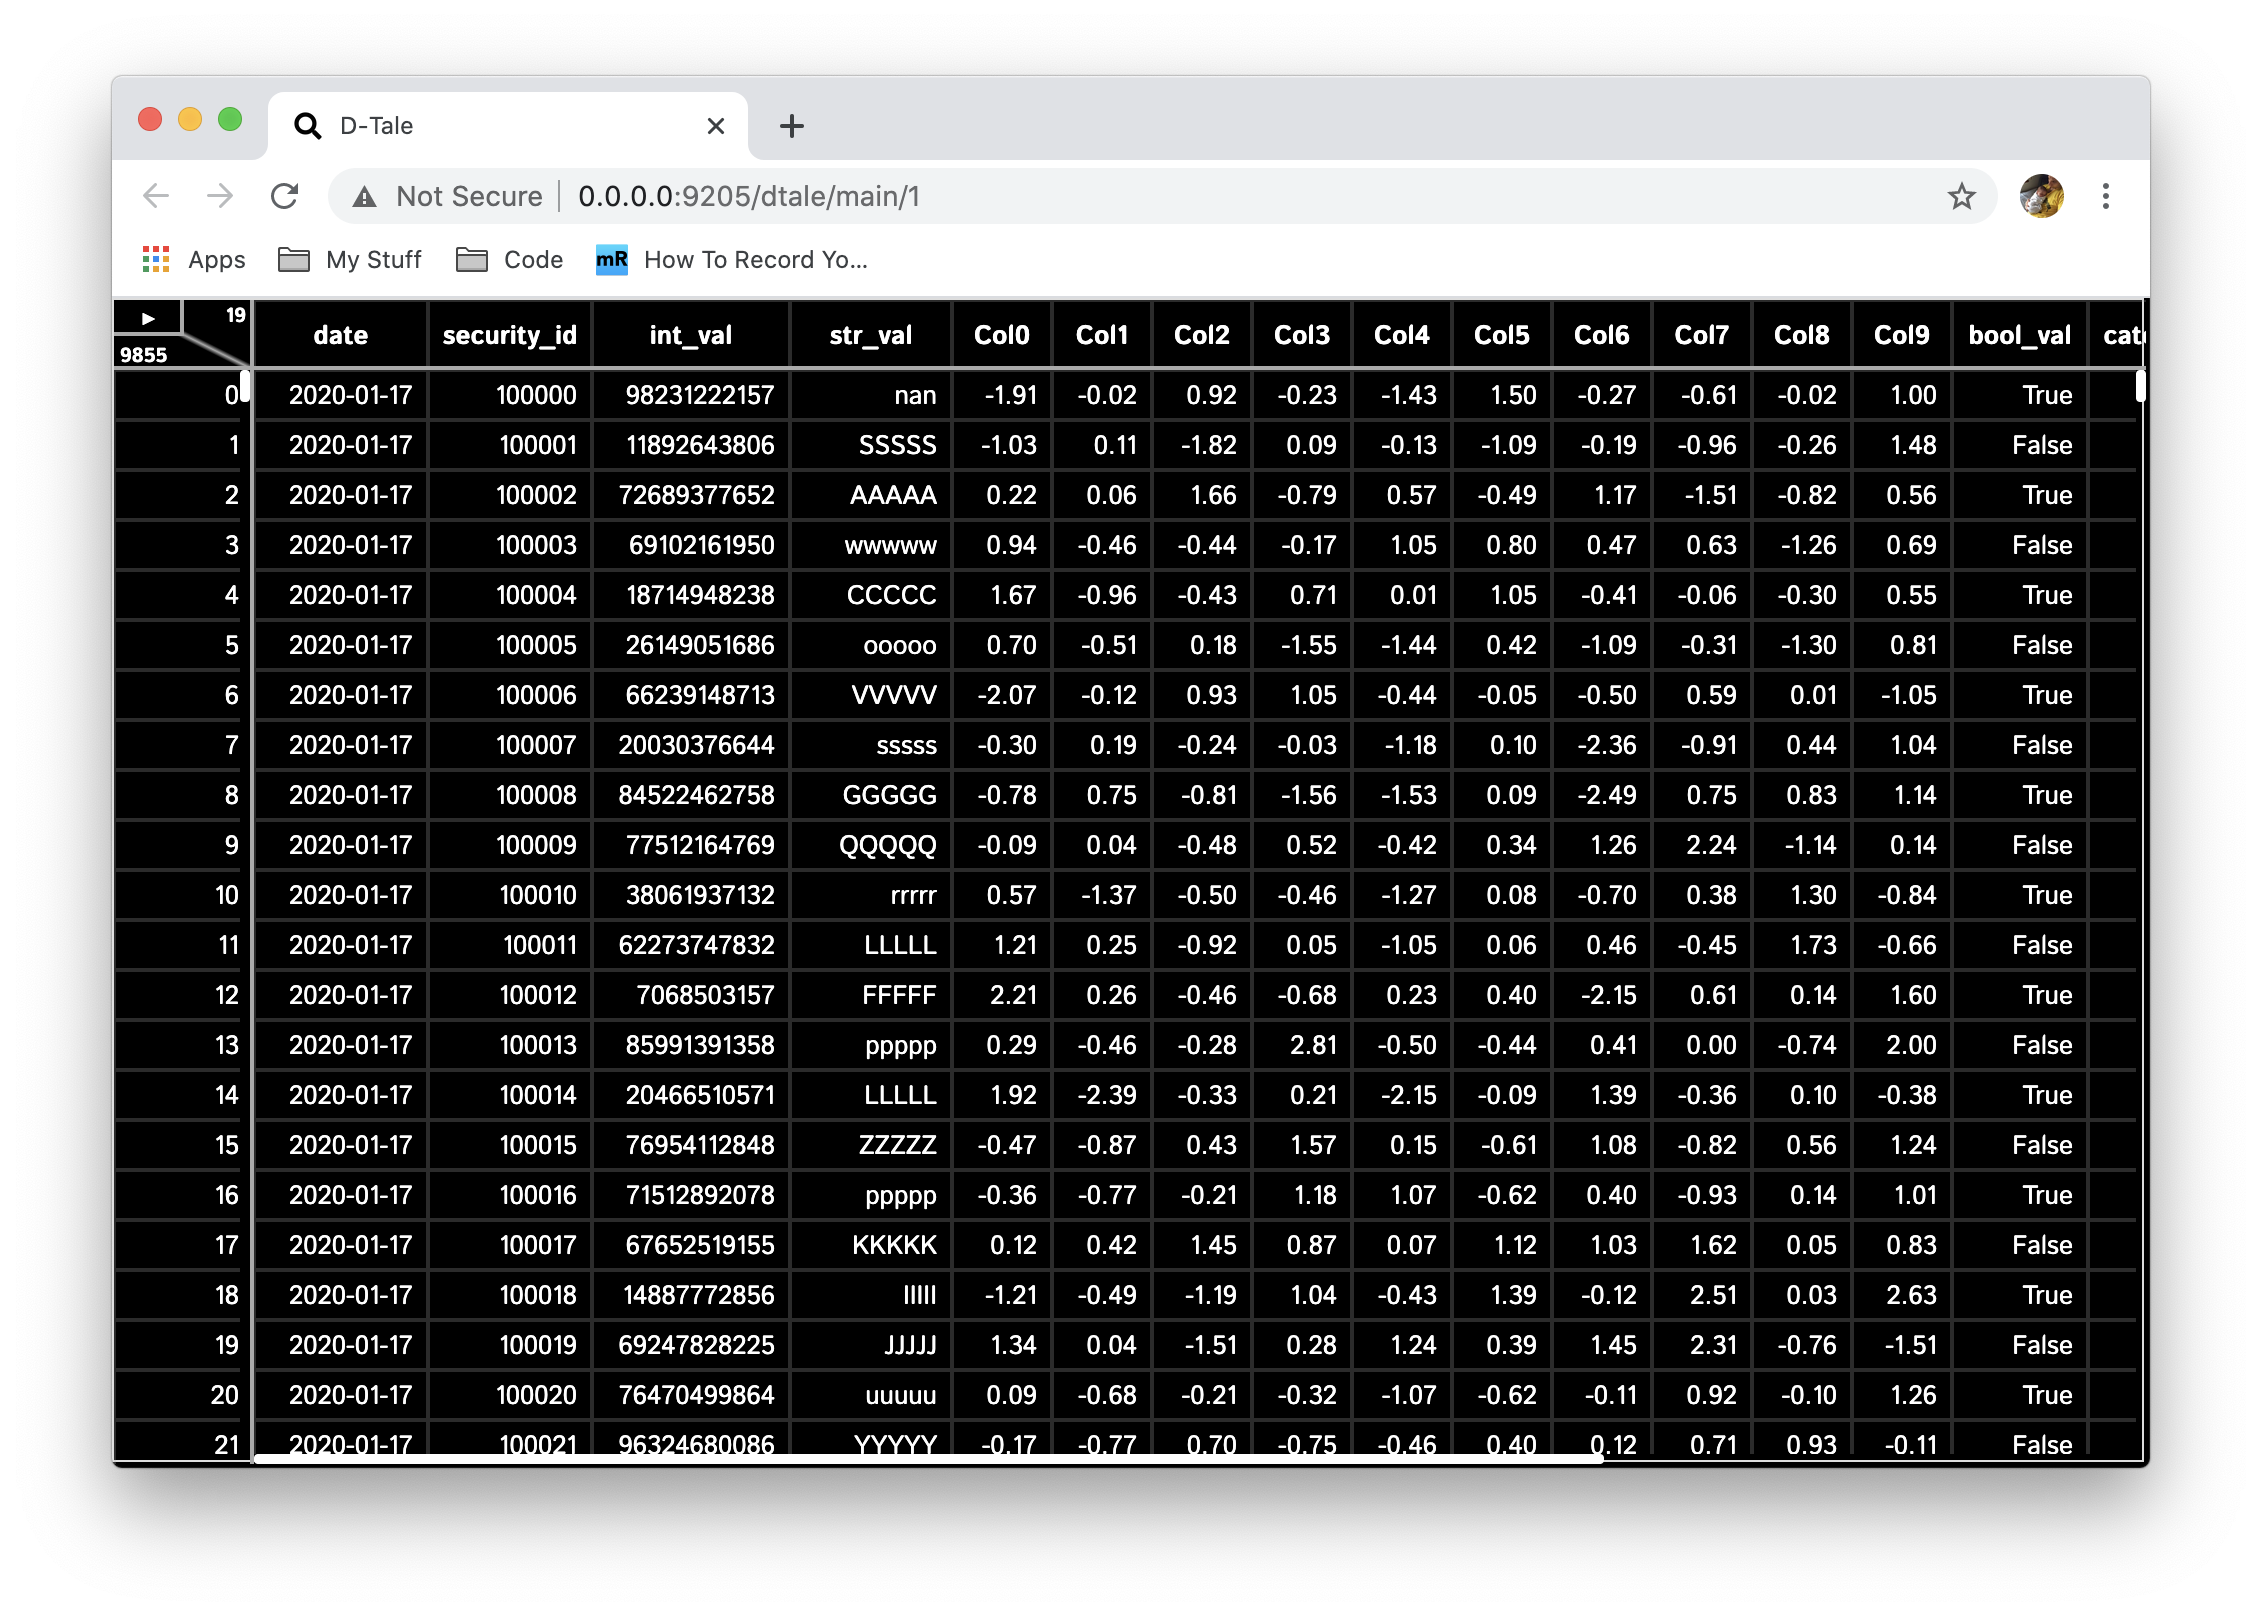 |
Reload Data
Force a reload of the data from the server for the current rows being viewing in the grid by clicking this button. This can be helpful when viewing the grid from within another application like jupyter or nested within another website.
Unpin/Pin Menu
If you would like to keep your menu pinned to the side of your grid all times rather than always having to click the triaangle in the upper left-hand corner simply click this button. It is persisted back to the server so that it can be applied to all piece of data you've loaded into your session and beyond refreshes.
Language
I am happy to announce that D-Tale now supports both English & Chinese (there is still more of the translation to be completed but the infrastructure is there). And we are happy to add support for any other languages. Please see instruction on how, here.
Shutdown
Pretty self-explanatory, kills your D-Tale session (there is also an auto-kill process that will kill your D-Tale after an hour of inactivity)
Column Menu Functions
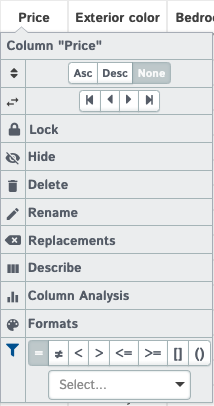
Filtering
These interactive filters come in 3 different types: String, Numeric & Date. Note that you will still have the ability to apply custom filters from the "Filter" popup on the main menu, but it will get applied in addition to any column filters.
| Type | Filter | Data Types | Features |
|---|---|---|---|
| String | 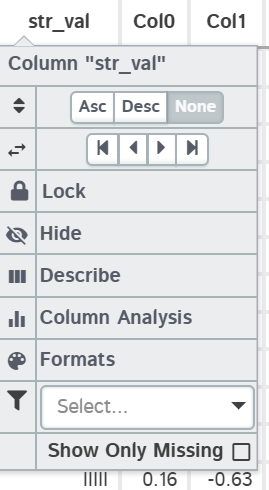 | strings & booleans | The ability to select multiple values based on what exists in the column. Notice the "Show Missing Only" toggle, this will only show up if your column has nan values |
| Date | 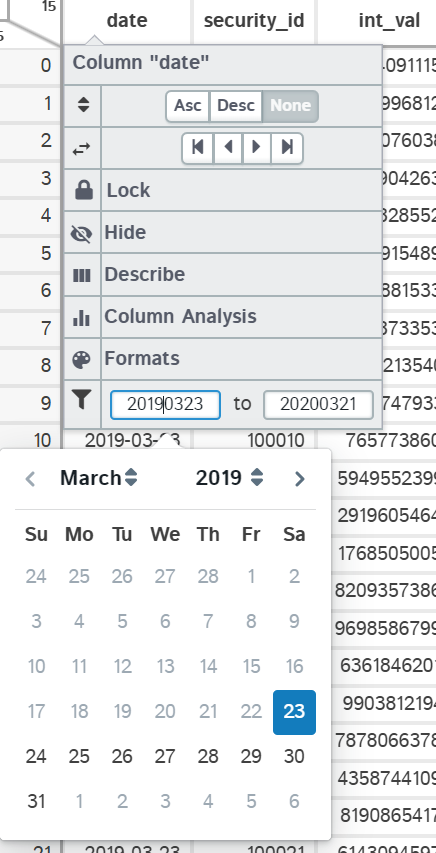 | dates | Specify a range of dates to filter on based on start & end inputs |
| Numeric | 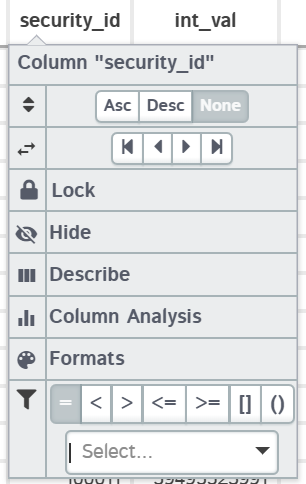 | ints & floats | For integers the "=" will be similar to strings where you can select multiple values based on what exists in the column. You also have access to other operands: <,>,<=,>=,() - "Range exclusve", [] - "Range inclusive". |
Moving Columns
All column movements are saved on the server so refreshing your browser won't lose them :ok_hand:
Hiding Columns
All column movements are saved on the server so refreshing your browser won't lose them :ok_hand:
Delete
As simple as it sounds, click this button to delete this column from your dataframe.
Rename
Update the name of any column in your dataframe to a name that is not currently in use by your dataframe.

Replacements
This feature allows users to replace content on their column directly or for safer purposes in a brand new column. Here are the options you have:
| Type | Data Types | Description | Menu |
|---|---|---|---|
| Value(s) | all | Replace specific values in a column with raw values, output from another column or an aggregation on your column | 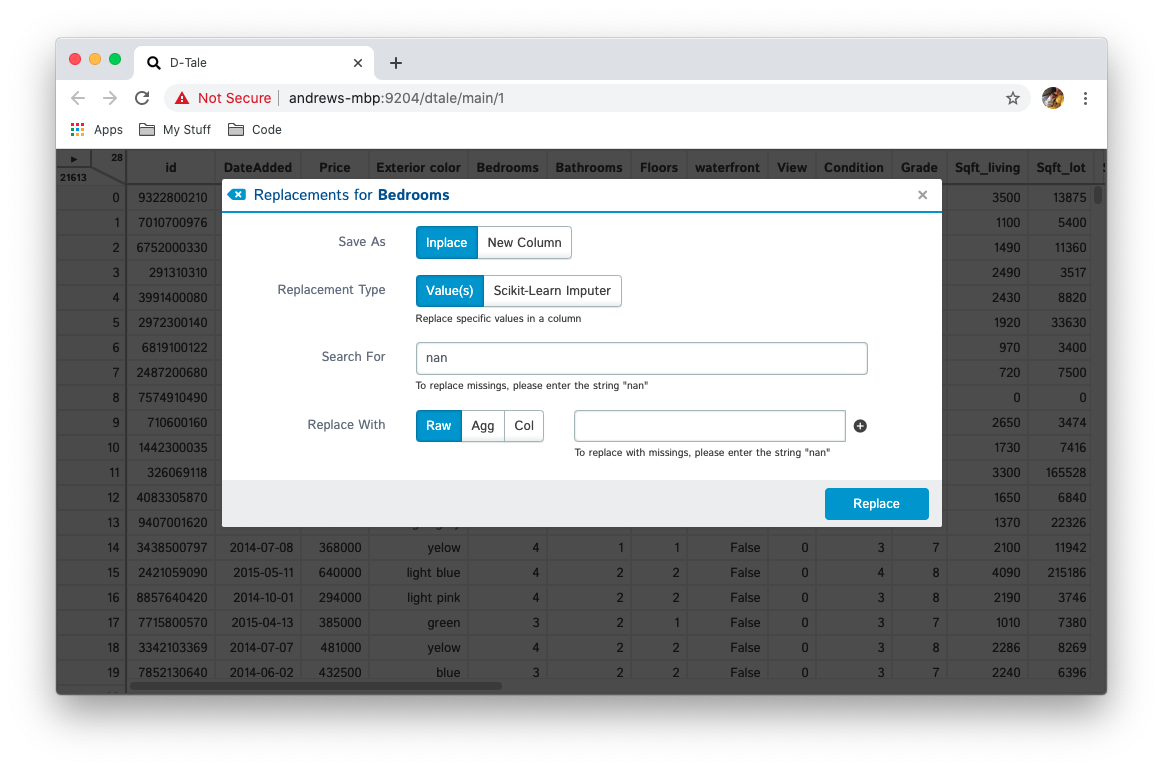 |
| Spaces Only | strings | Replace string values consisting only of spaces with raw values | 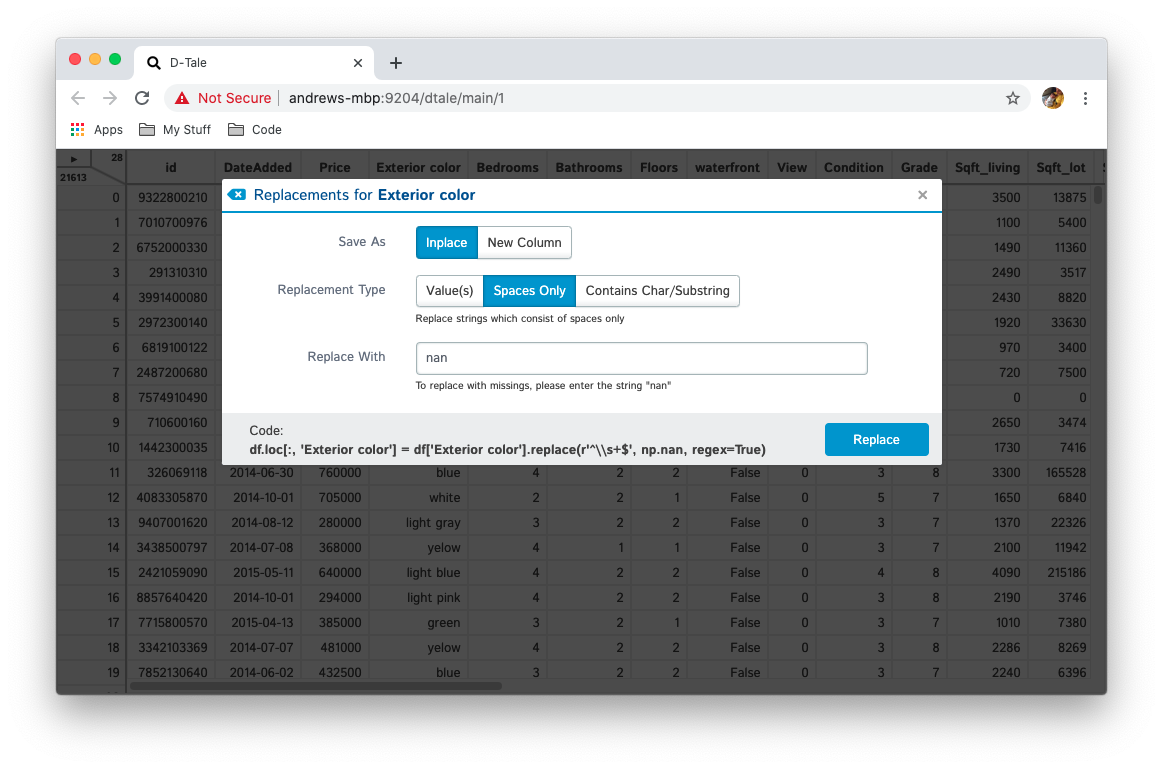 |
| Contains Char/Substring | strings | Replace string values containing a specific character or substring |  |
| Scikit-Learn Imputer | numeric | Replace missing values with the output of using different Scikit-Learn imputers like iterative, knn & simple | 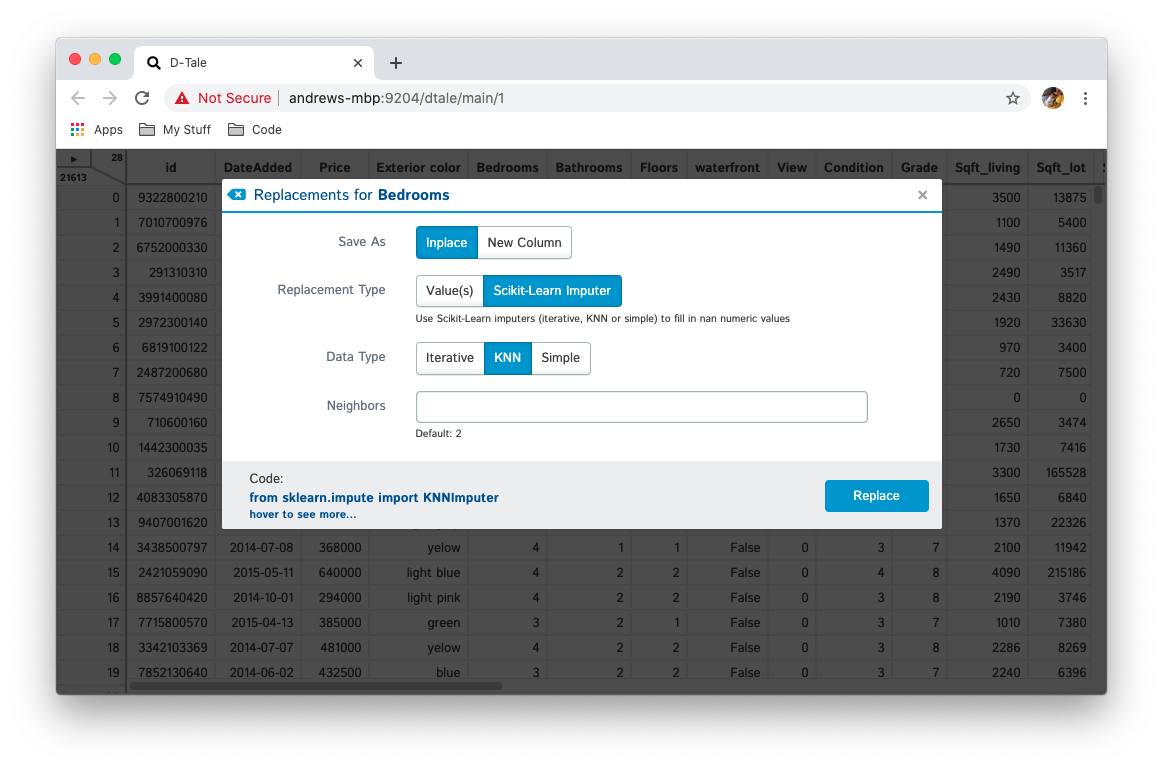 |
Here's a quick demo: 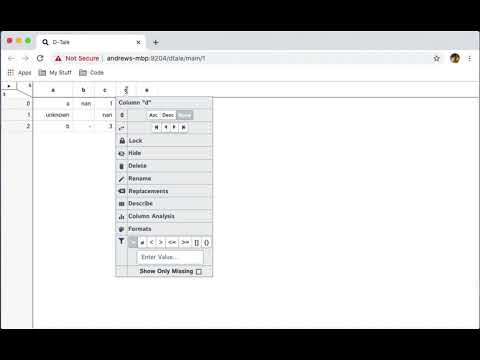
Lock
Adds your column to "locked" columns
- "locked" means that if you scroll horizontally these columns will stay pinned to the right-hand side
- this is handy when you want to keep track of which date or security_id you're looking at
- by default, any index columns on the data passed to D-Tale will be locked
Unlock
Removed column from "locked" columns
Sorting
Applies/removes sorting (Ascending/Descending/Clear) to the column selected
Important: as you add sorts they sort added will be added to the end of the multi-sort. For example:
| Action | Sort |
|---|---|
| click "a" | |
| sort asc | a (asc) |
| click "b" | a (asc) |
| sort desc | a (asc), b(desc) |
| click "a" | a (asc), b(desc) |
| sort None | b(desc) |
| sort desc | b(desc), a(desc) |
| click "X" on sort display |
Formats
Apply simple formats to numeric values in your grid
| Type | Editing | Result |
|---|---|---|
| Numeric |  | 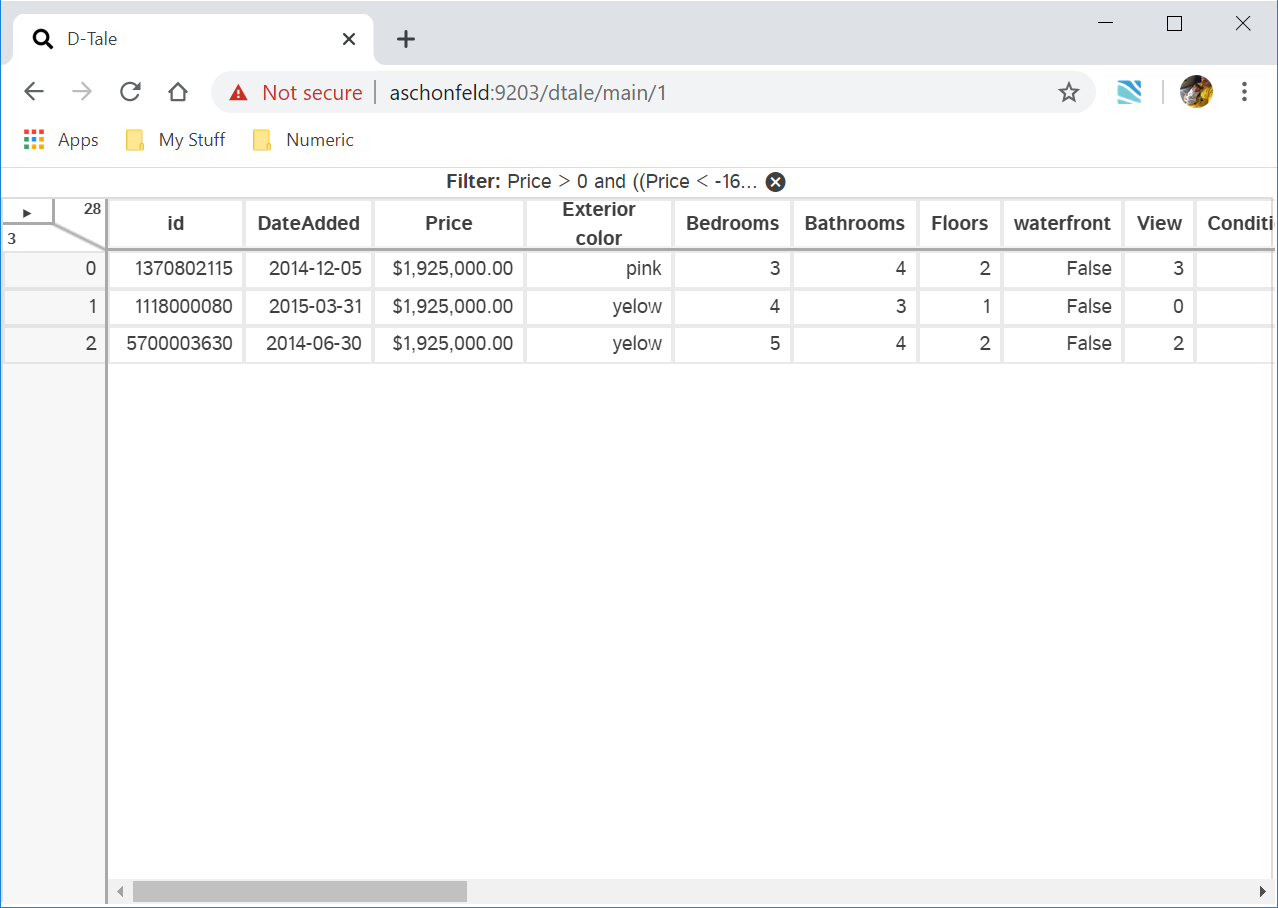 |
| Date | 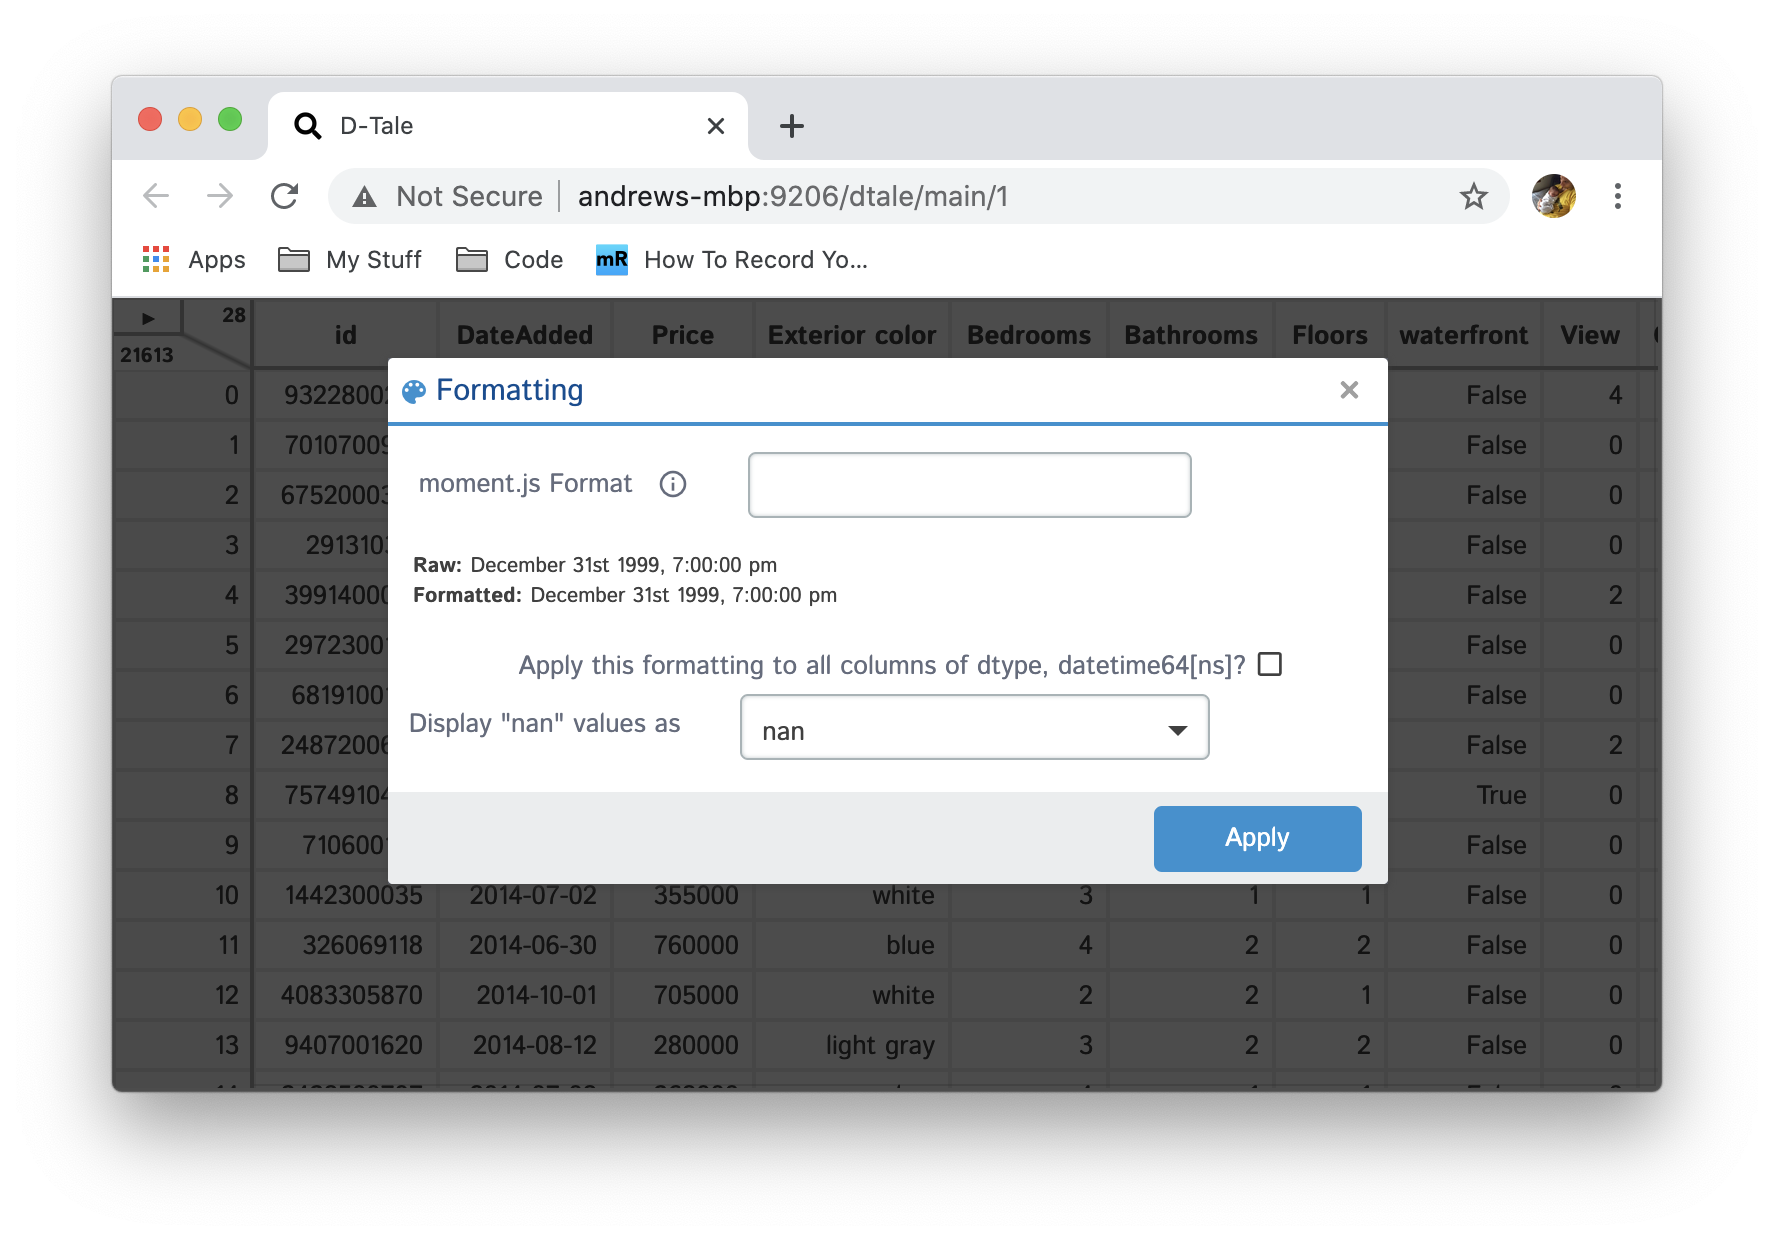 | 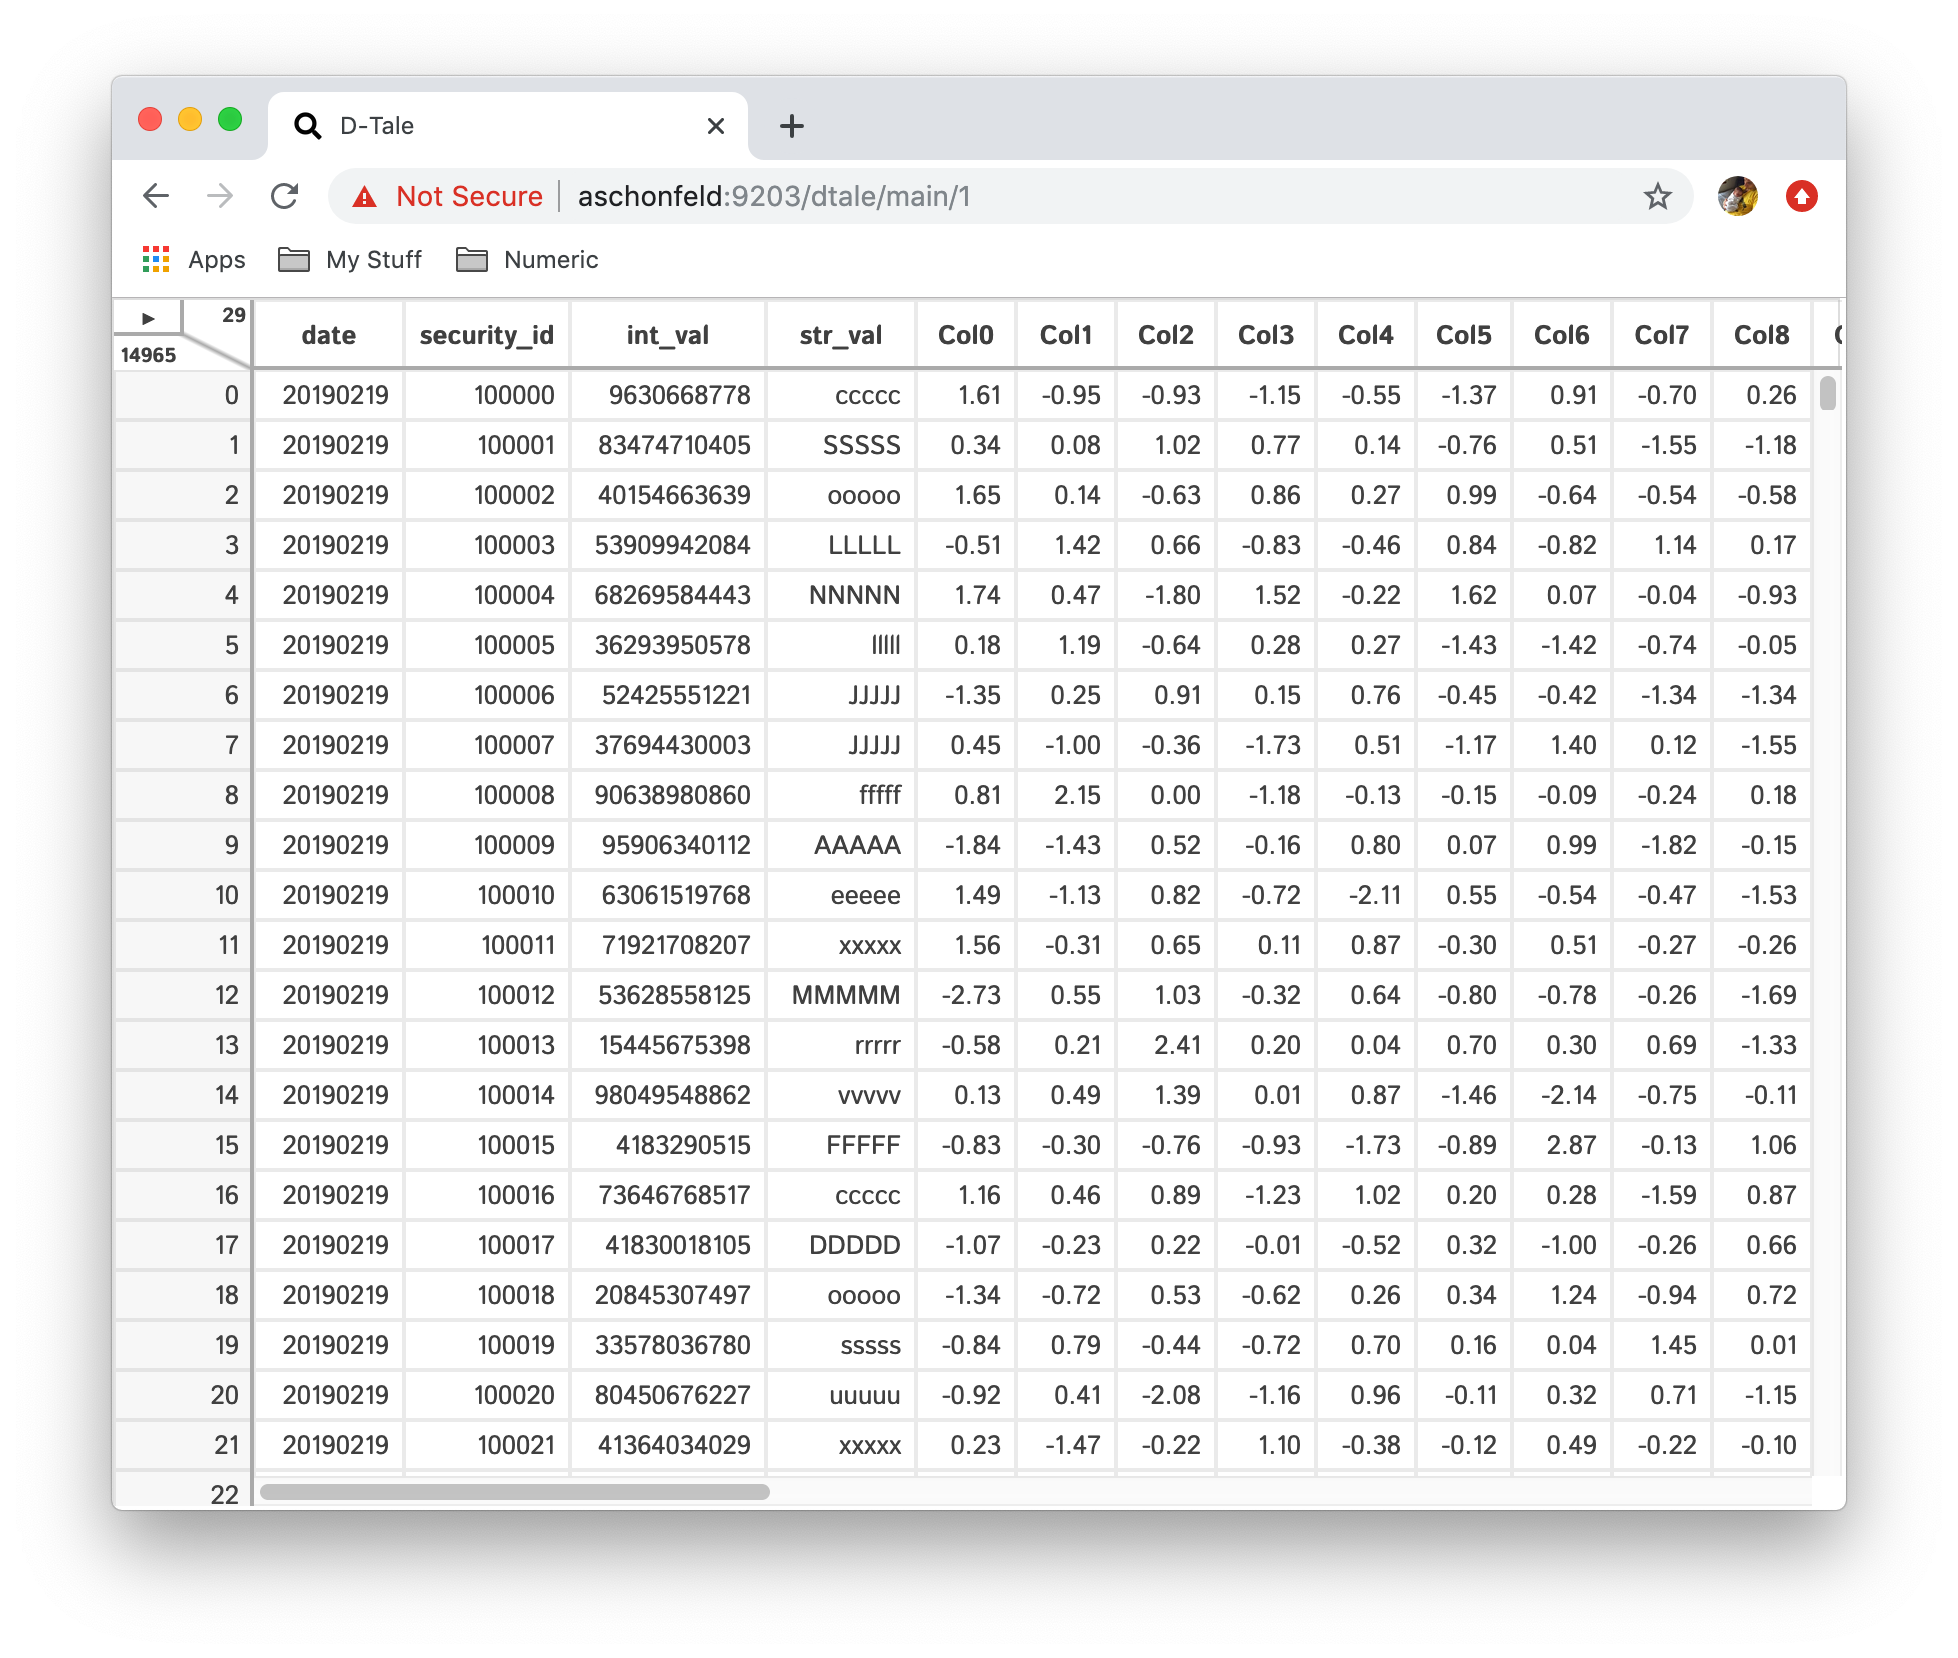 |
| String | 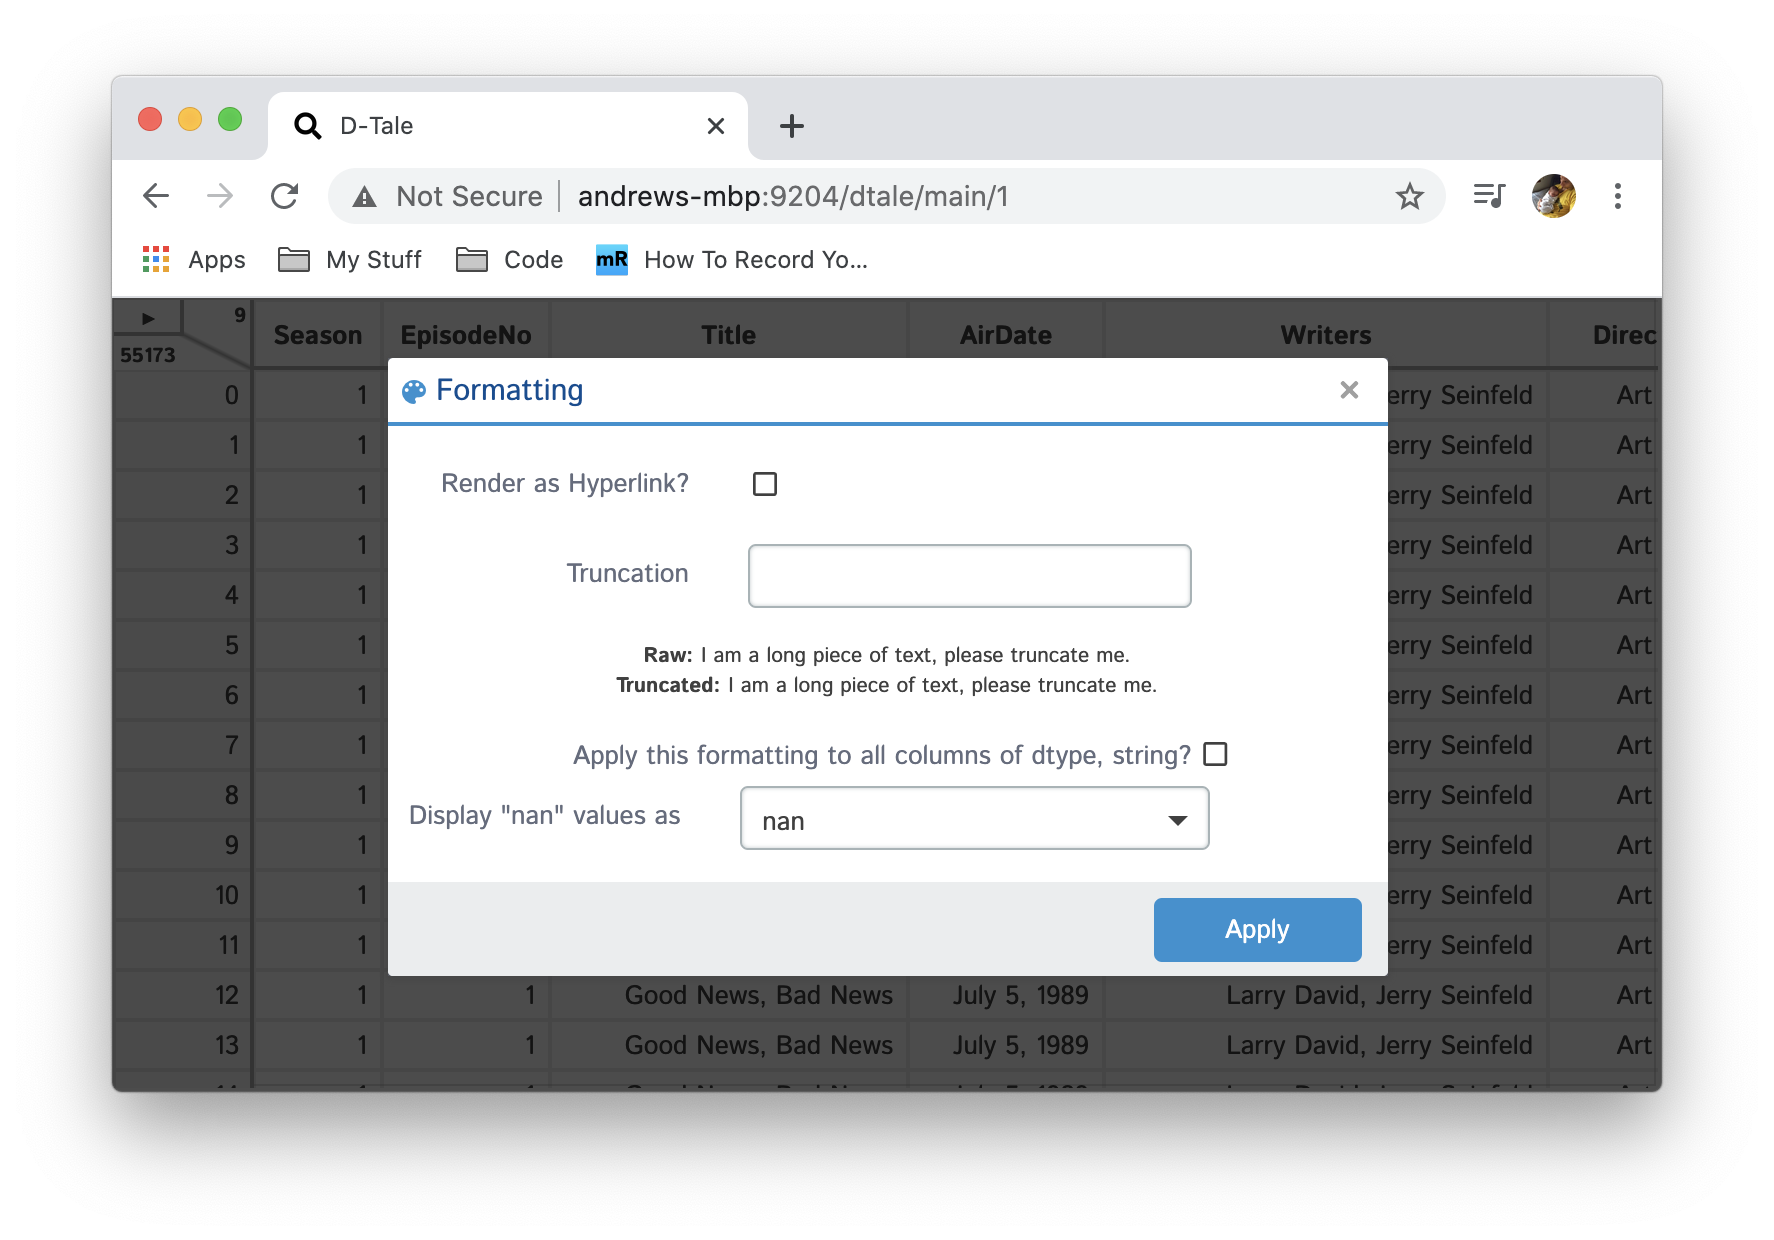 | 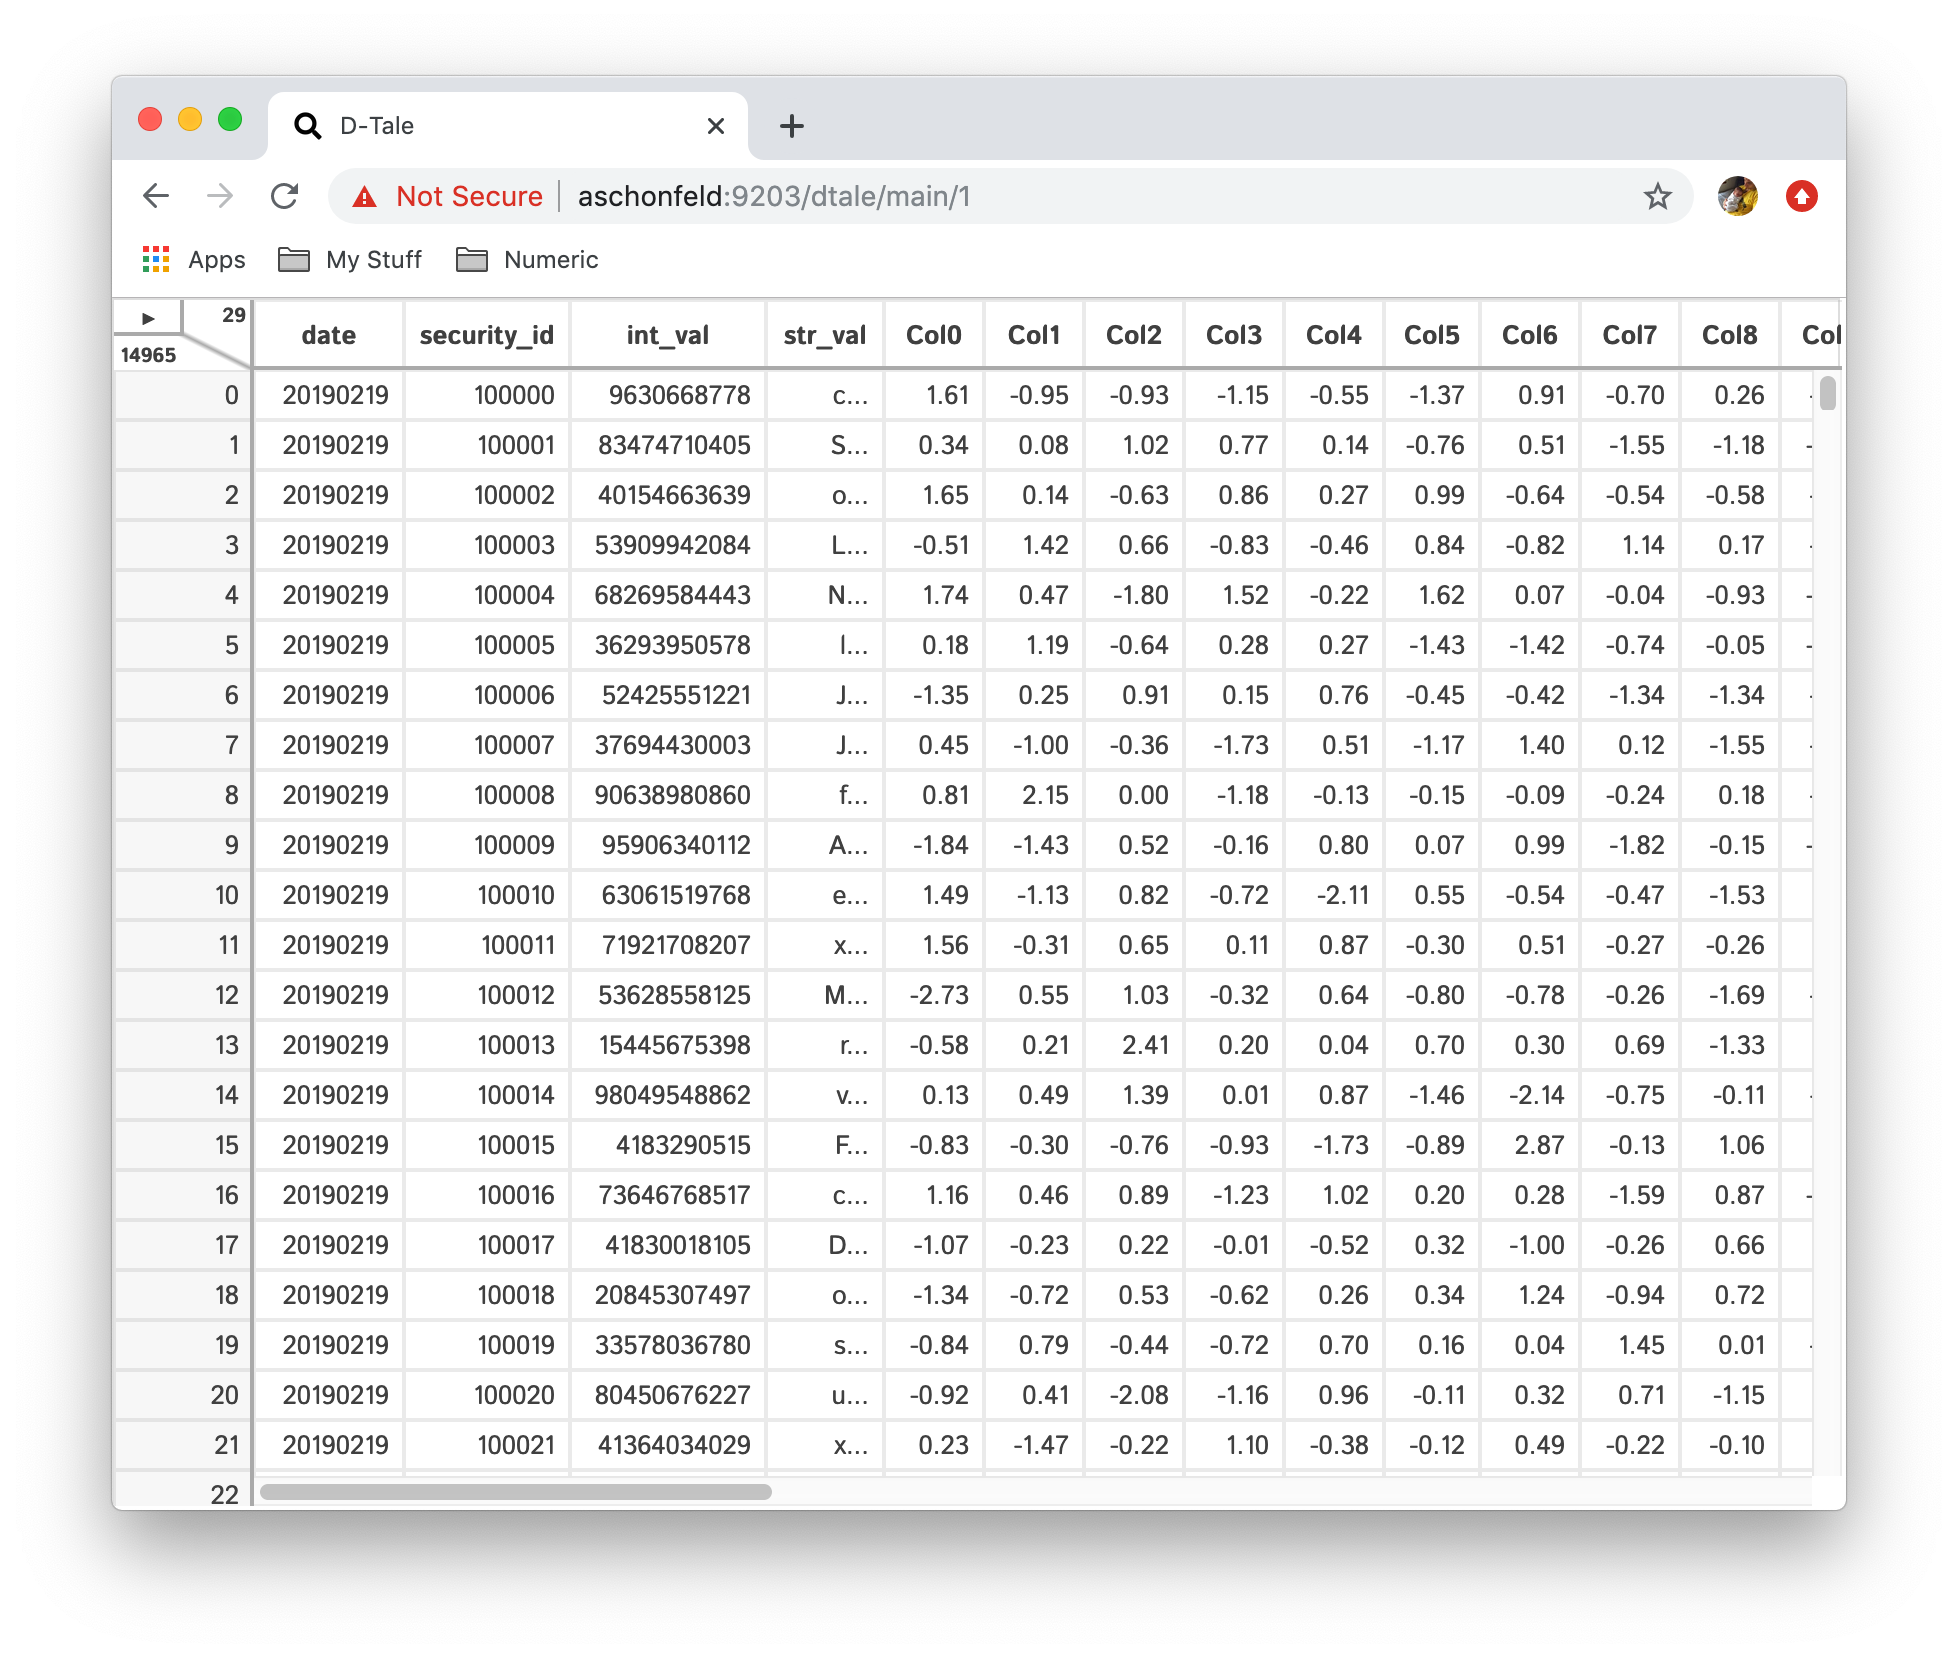 |
For all data types you have the ability to change what string is ued for display.
For numbers here's a grid of all the formats available with -123456.789 as input:
| Format | Output |
|---|---|
| Precision (6) | -123456.789000 |
| Thousands Sep | -123,456.789 |
| Abbreviate | -123k |
| Exponent | -1e+5 |
| BPS | -1234567890BPS |
| Red Negatives | <span style="color: red;">-123457</span> |
For strings you can apply the follwoing formats:
- Truncation: truncate long strings to a certain number of characters and replace with an allipses "..." and see the whole value on hover.
- Hyperlinks: If your column is comprised of URL strings you can make them hyperlinks which will open a new tab
Describe (Column Analysis)
Based on the data type of a column different charts will be shown. This side panel can be closed using the 'X' button in the upper right or by pressing the ESC key.
| Chart | Data Types | Sample |
|---|---|---|
| Box Plot | Float, Int, Date | 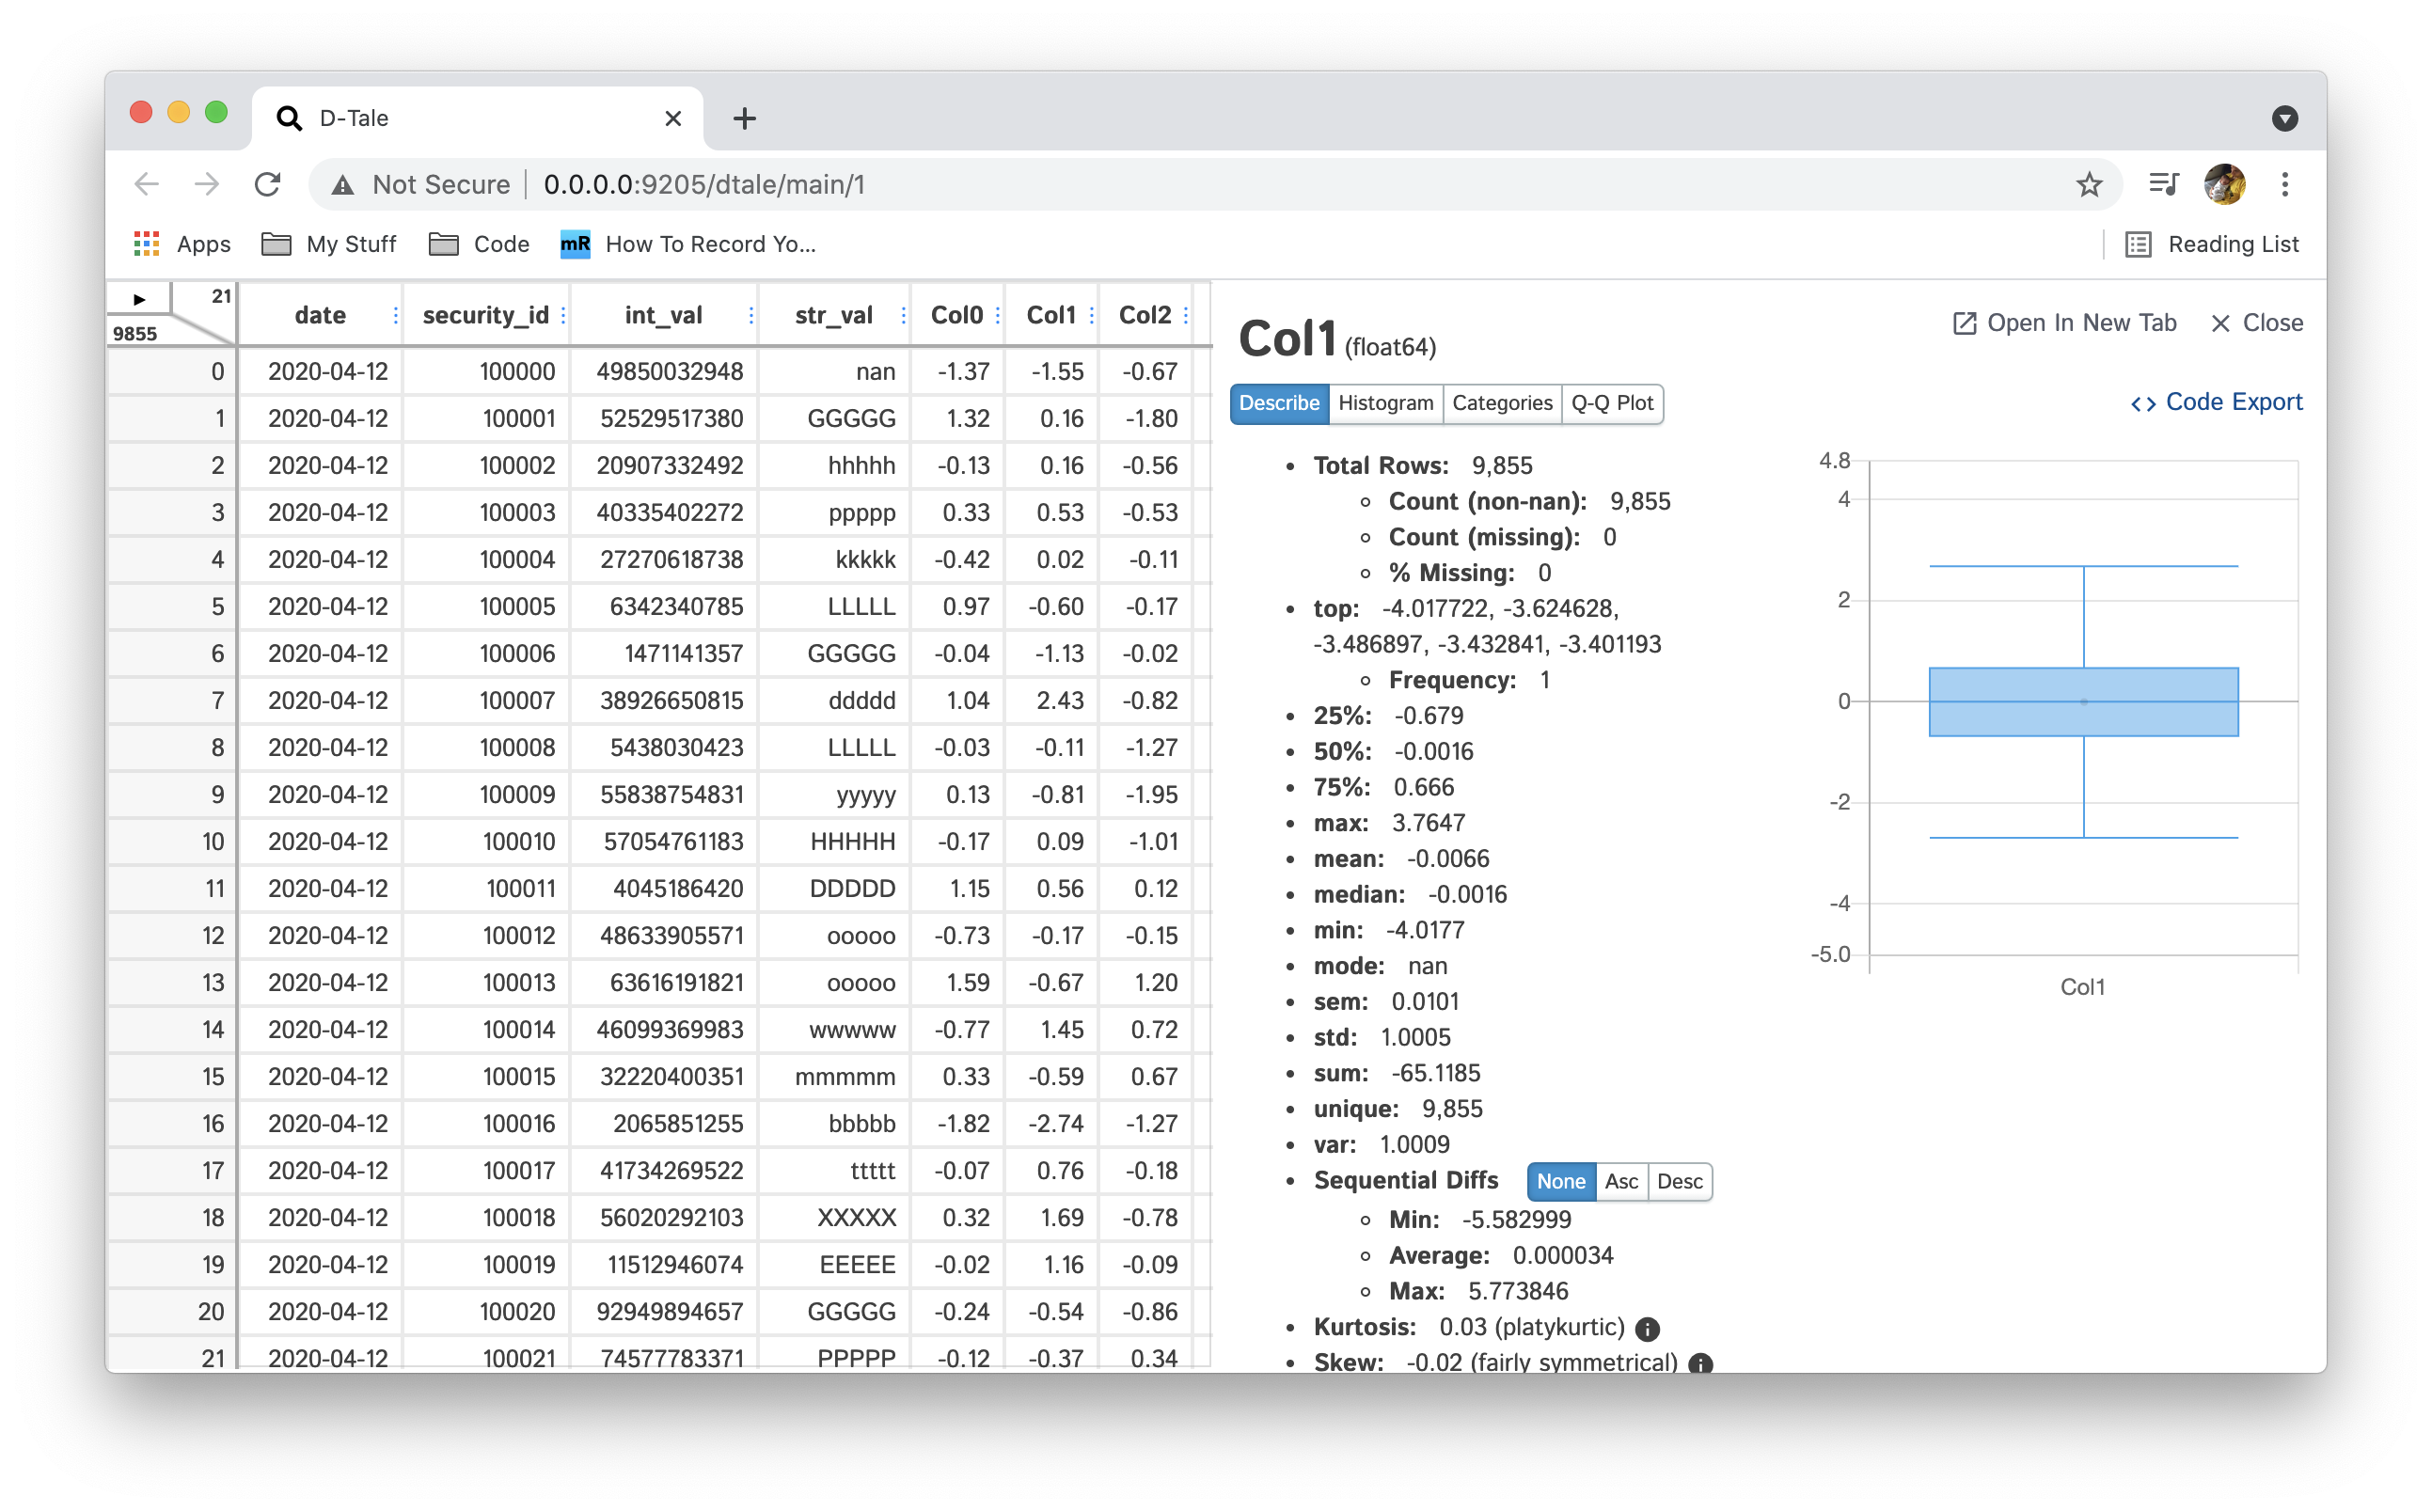 |
| Histogram | Float, Int | 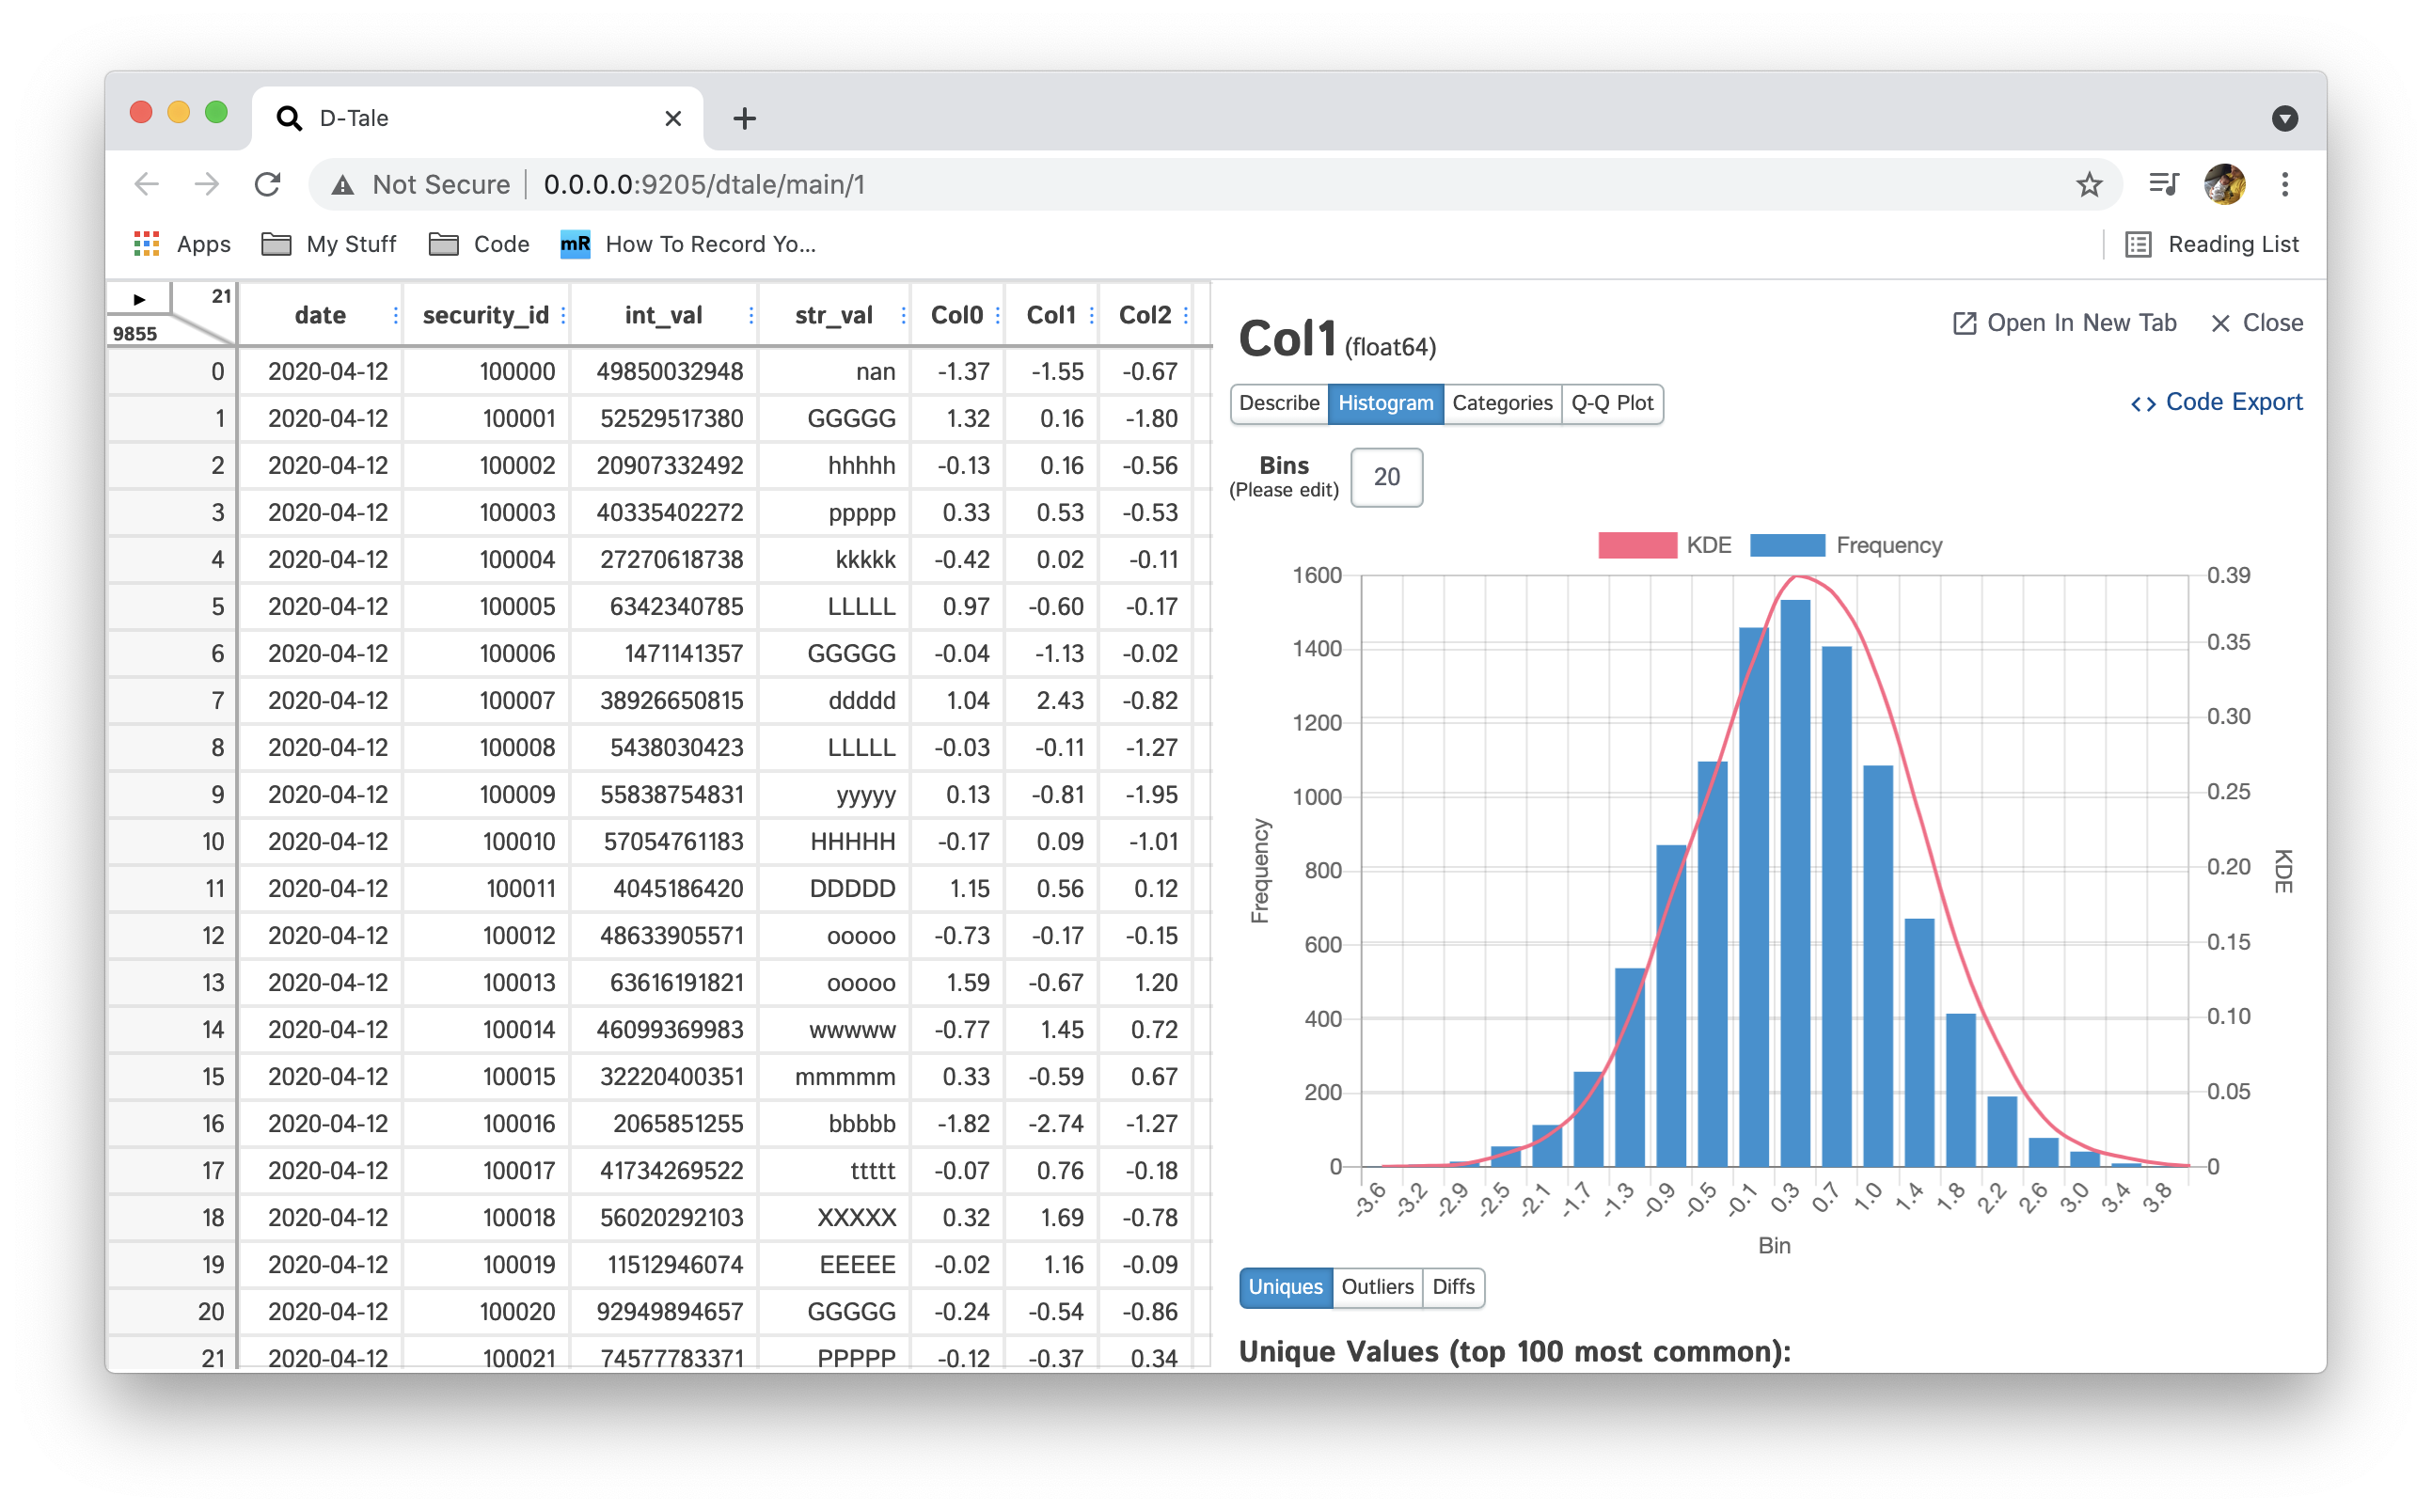 |
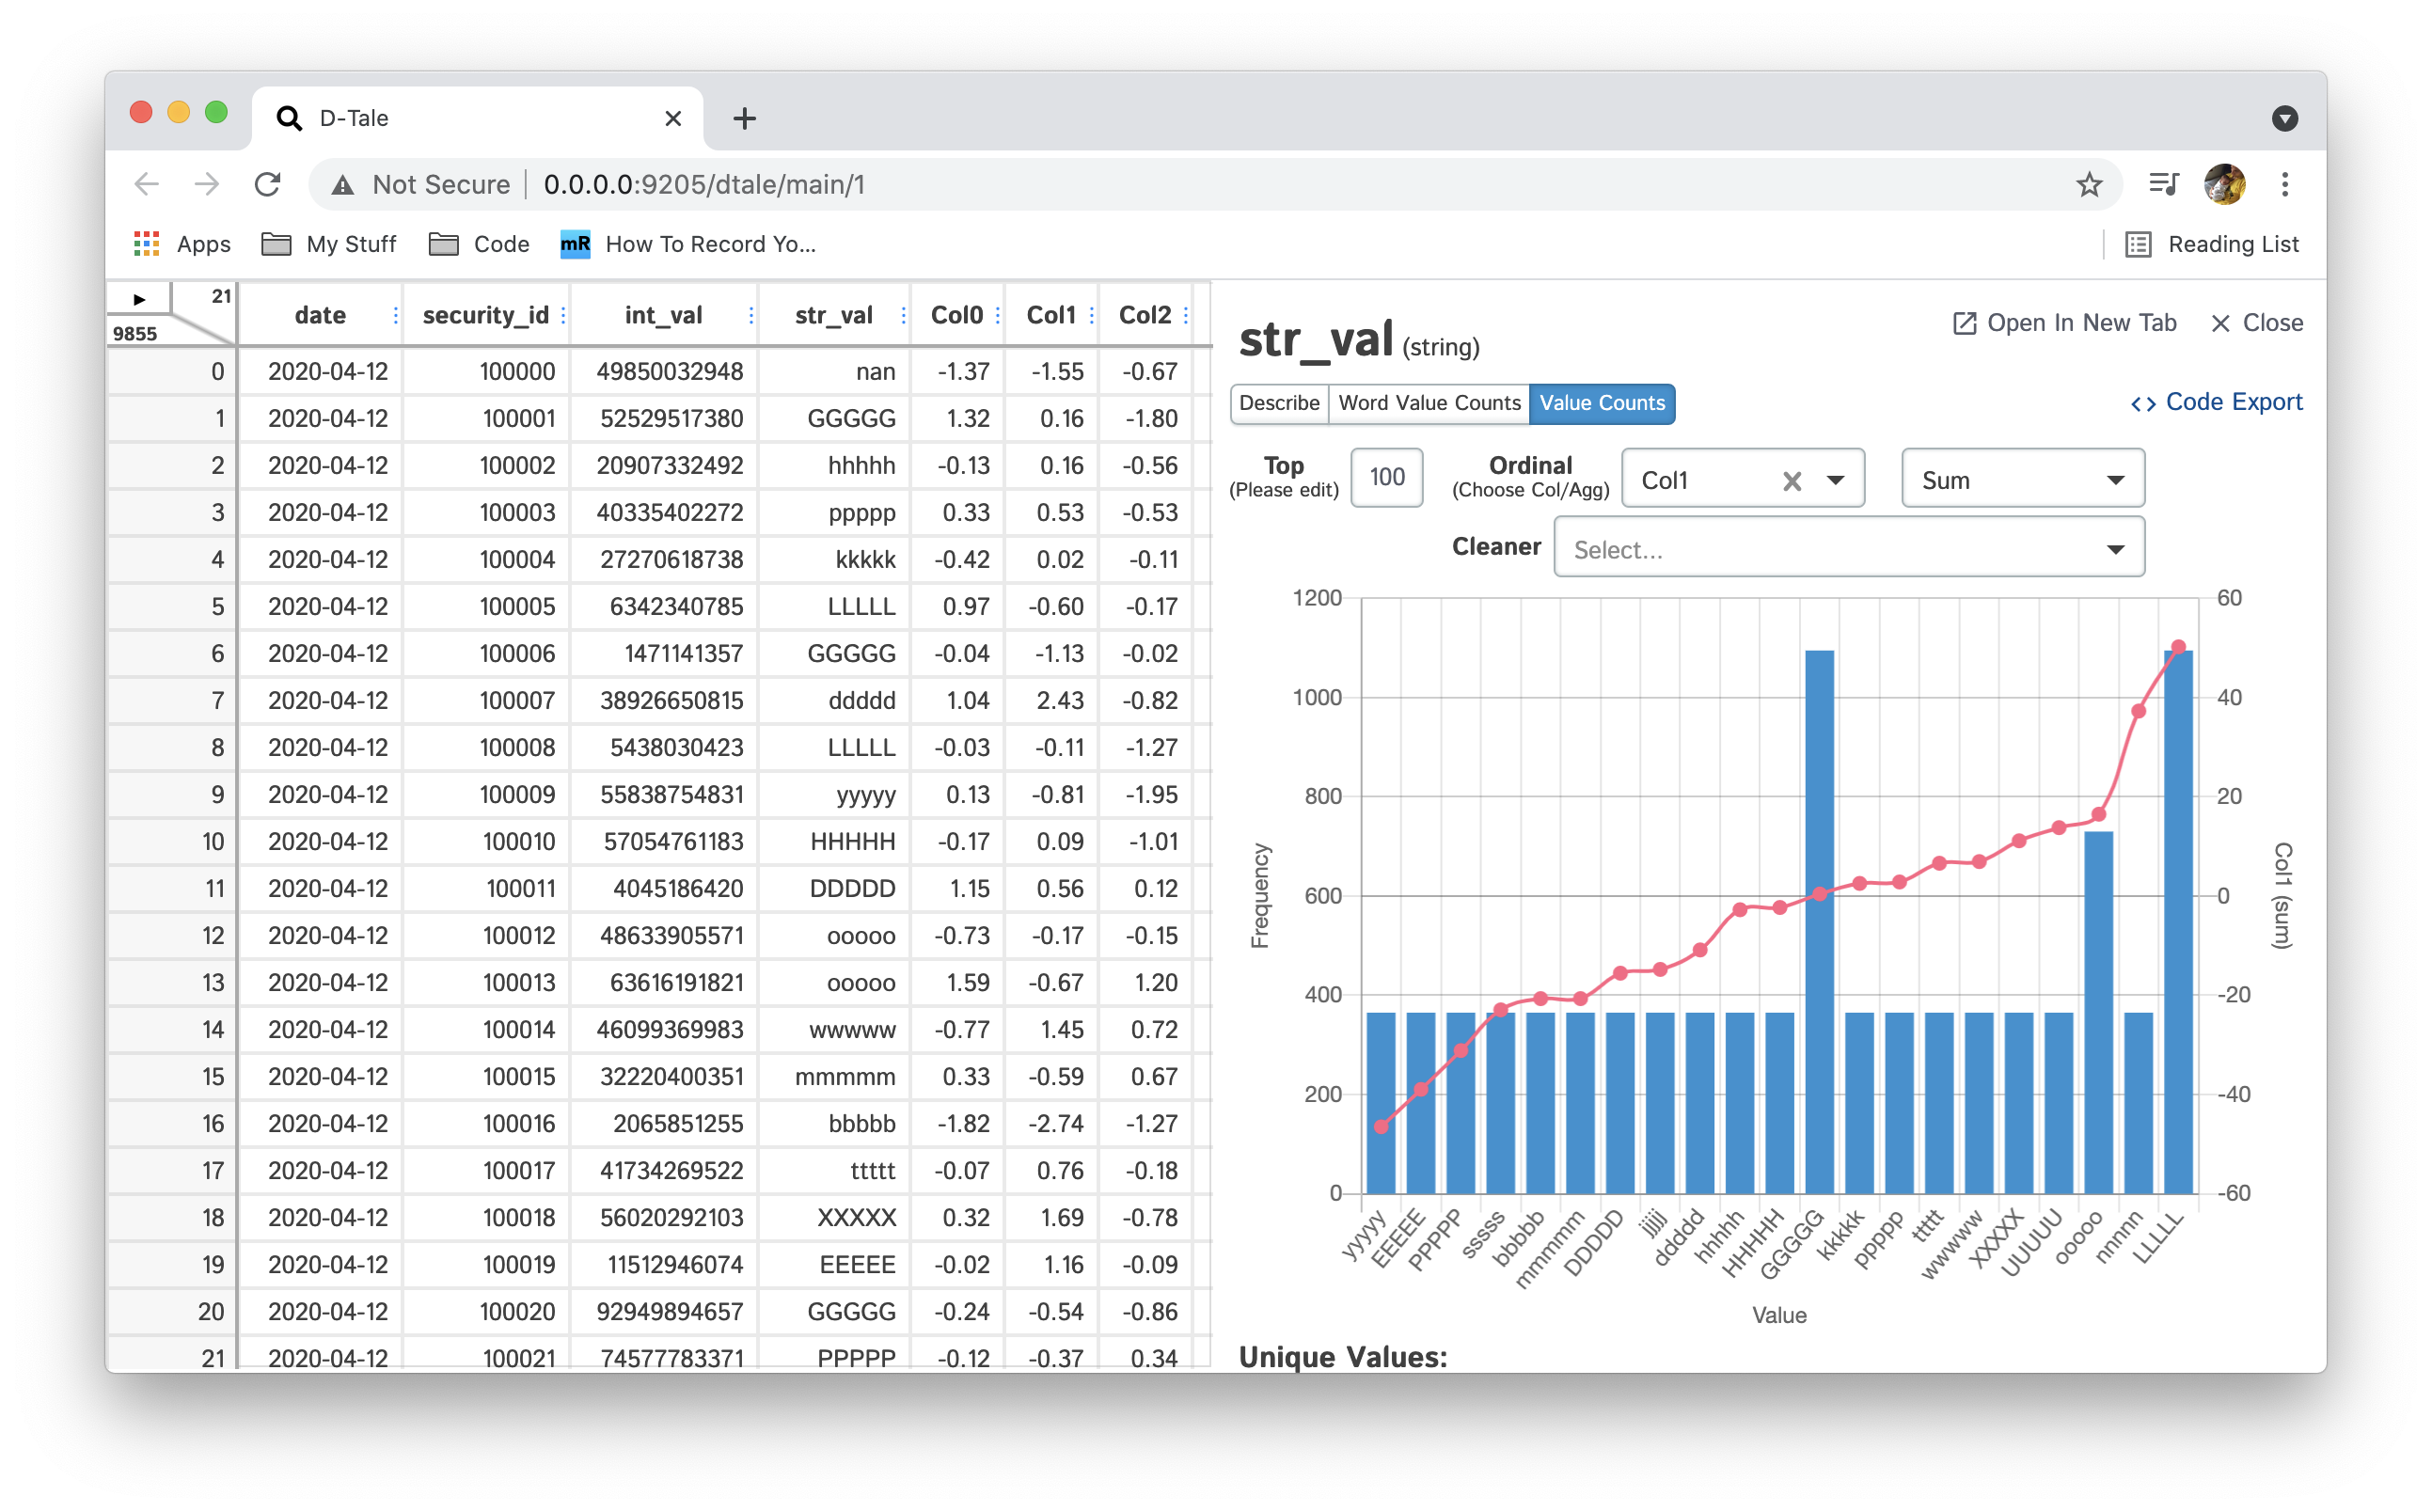
| Value Counts | Int, String, Bool, Date, Category | 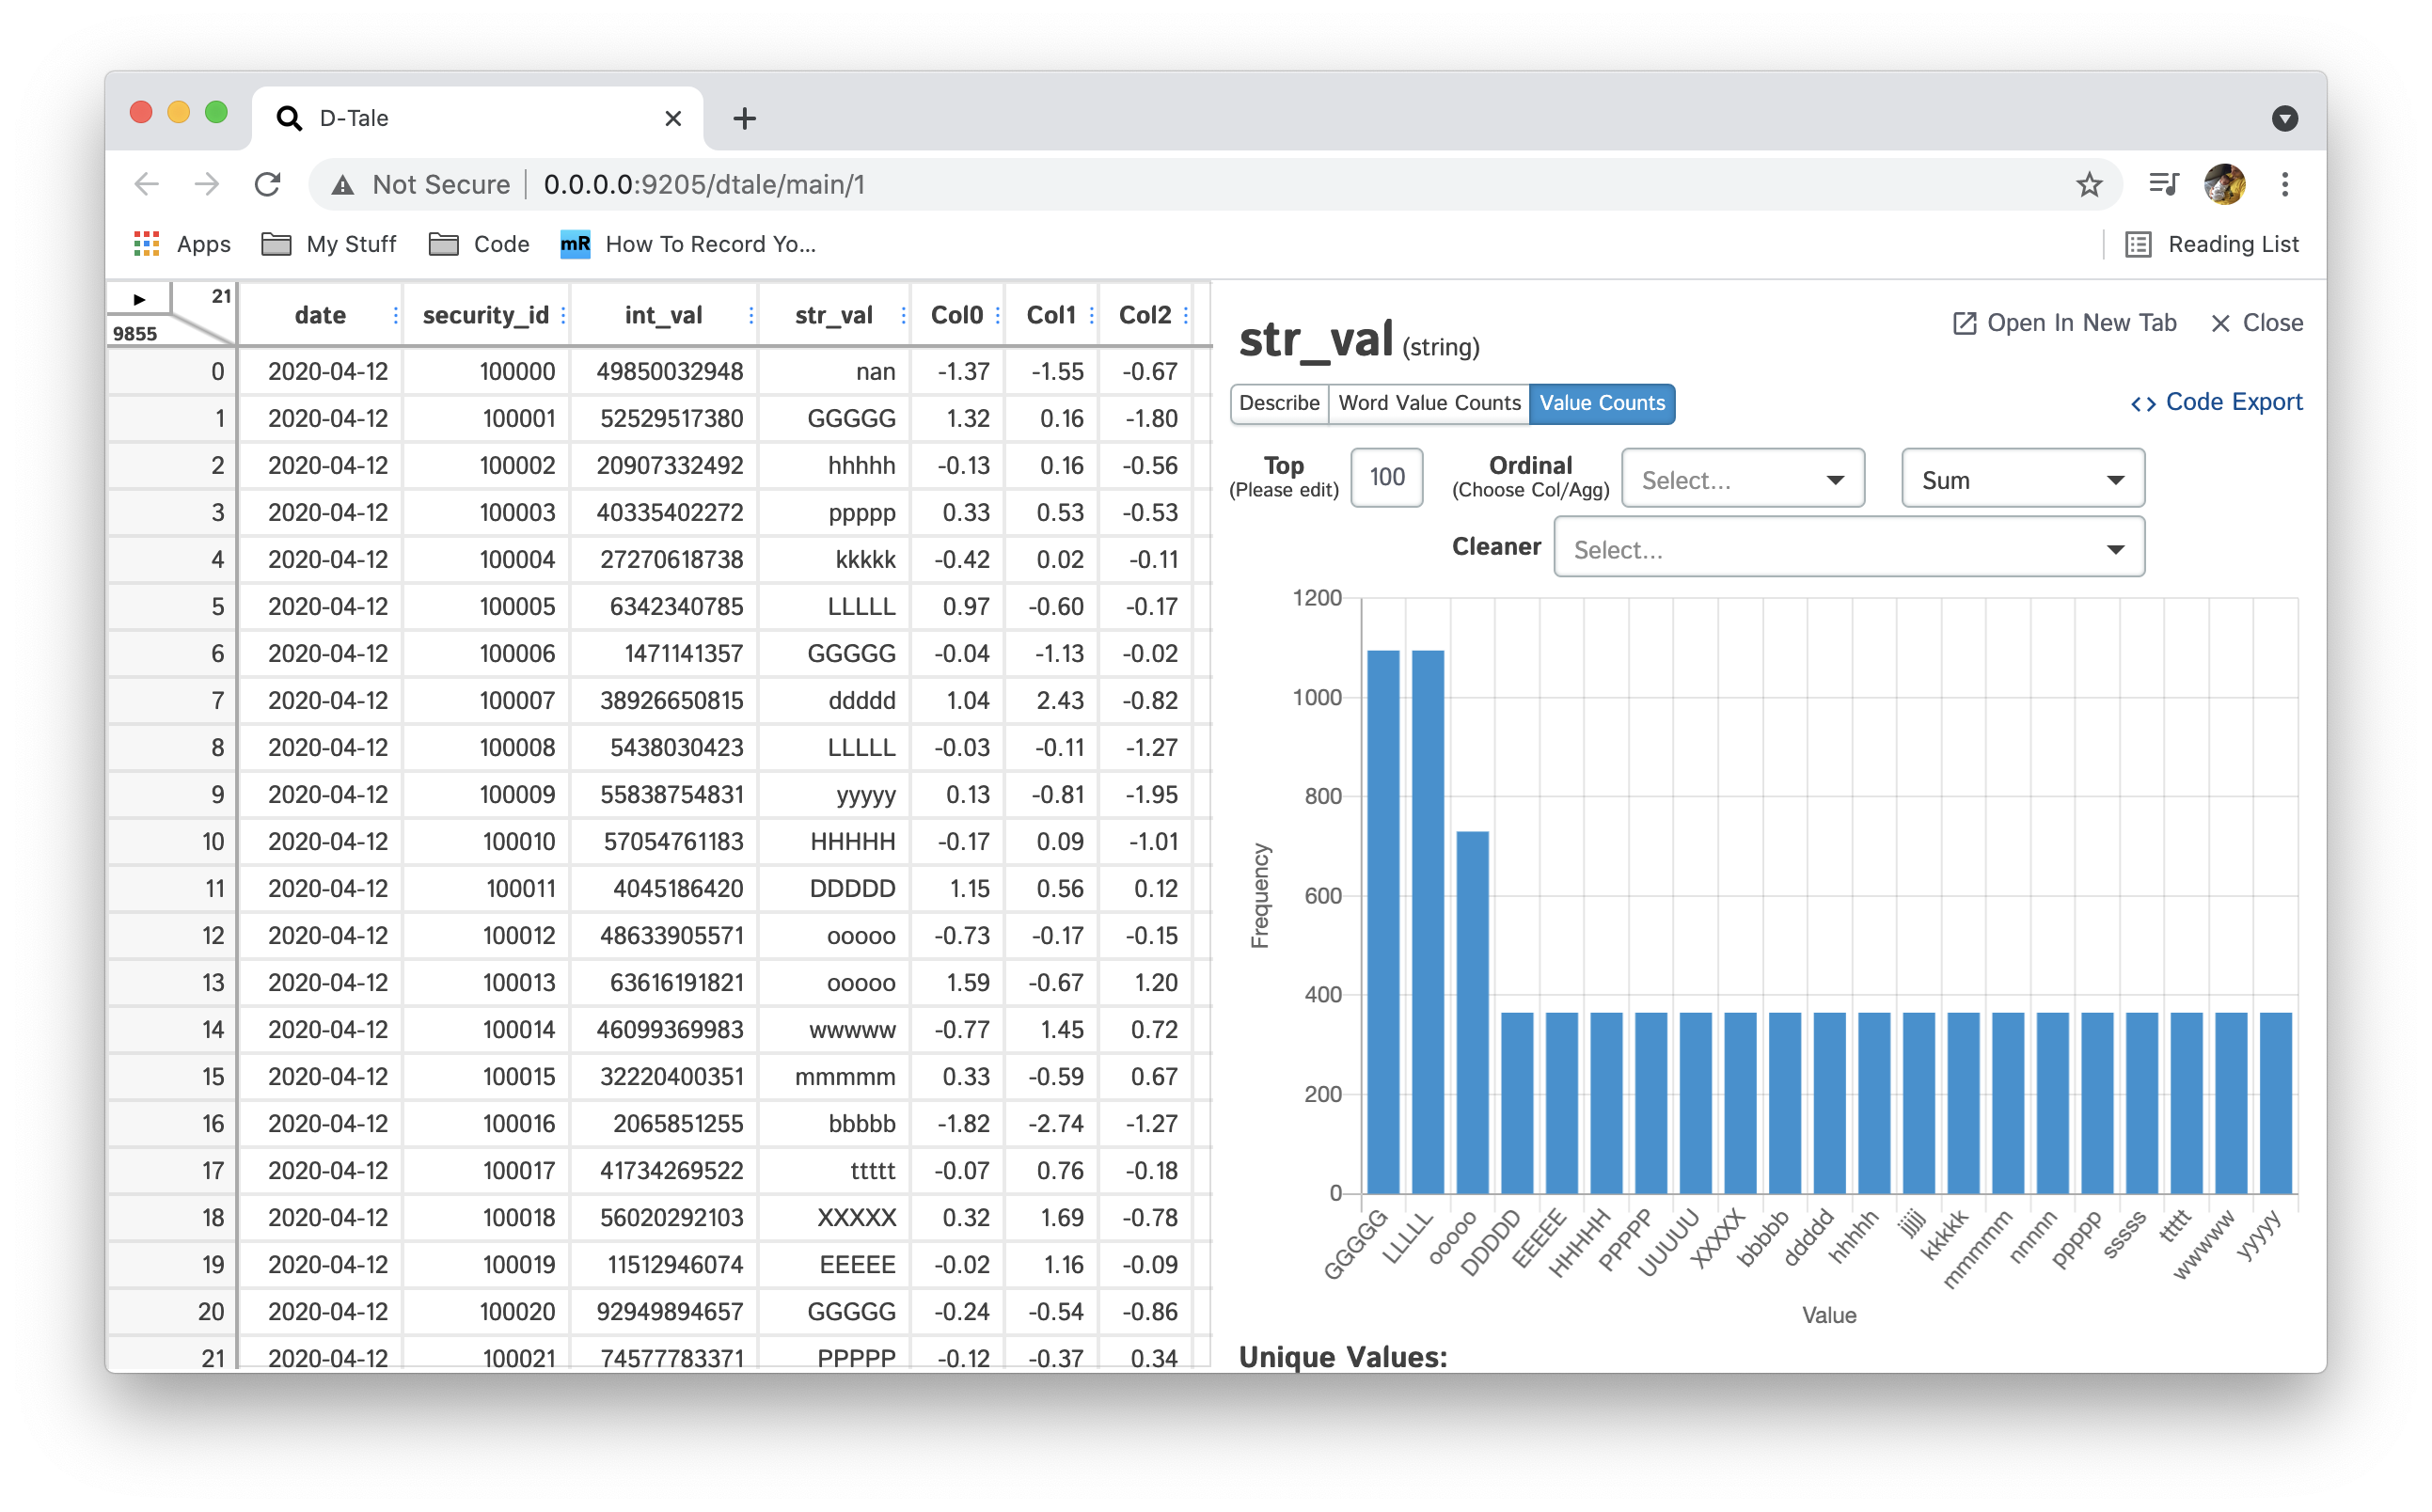 |
| Word Value Counts | String | 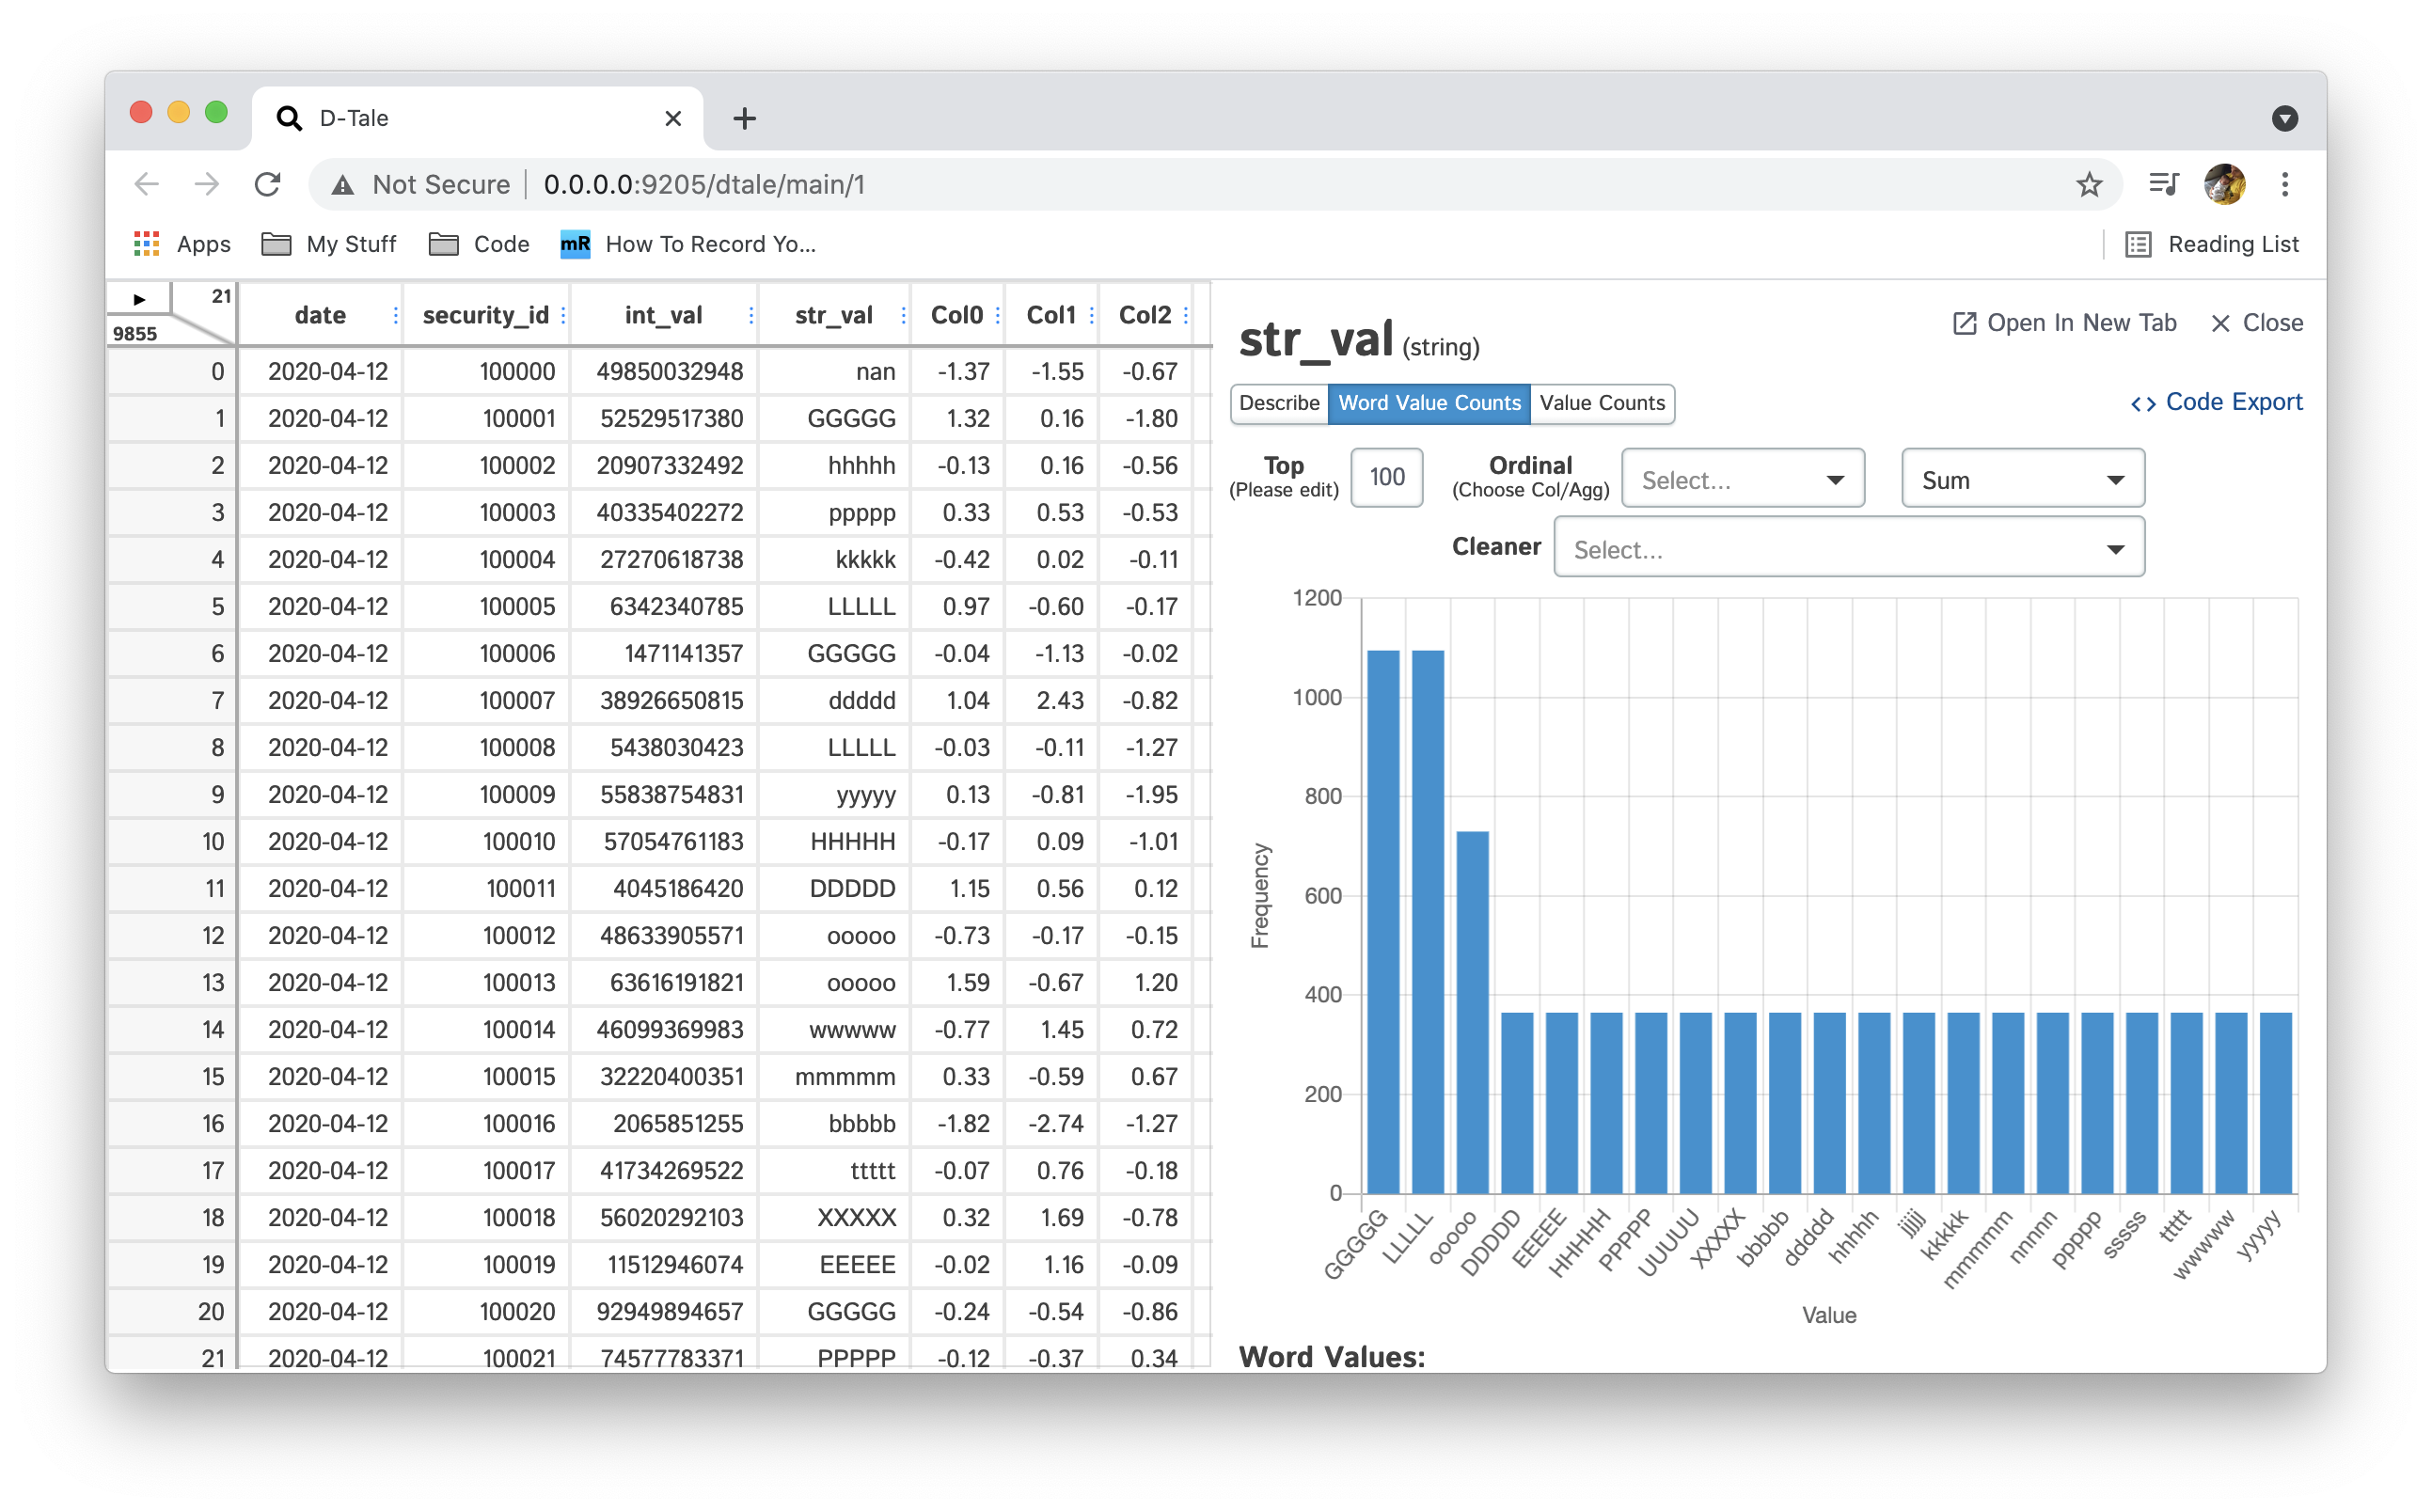 |
| Category | Float | 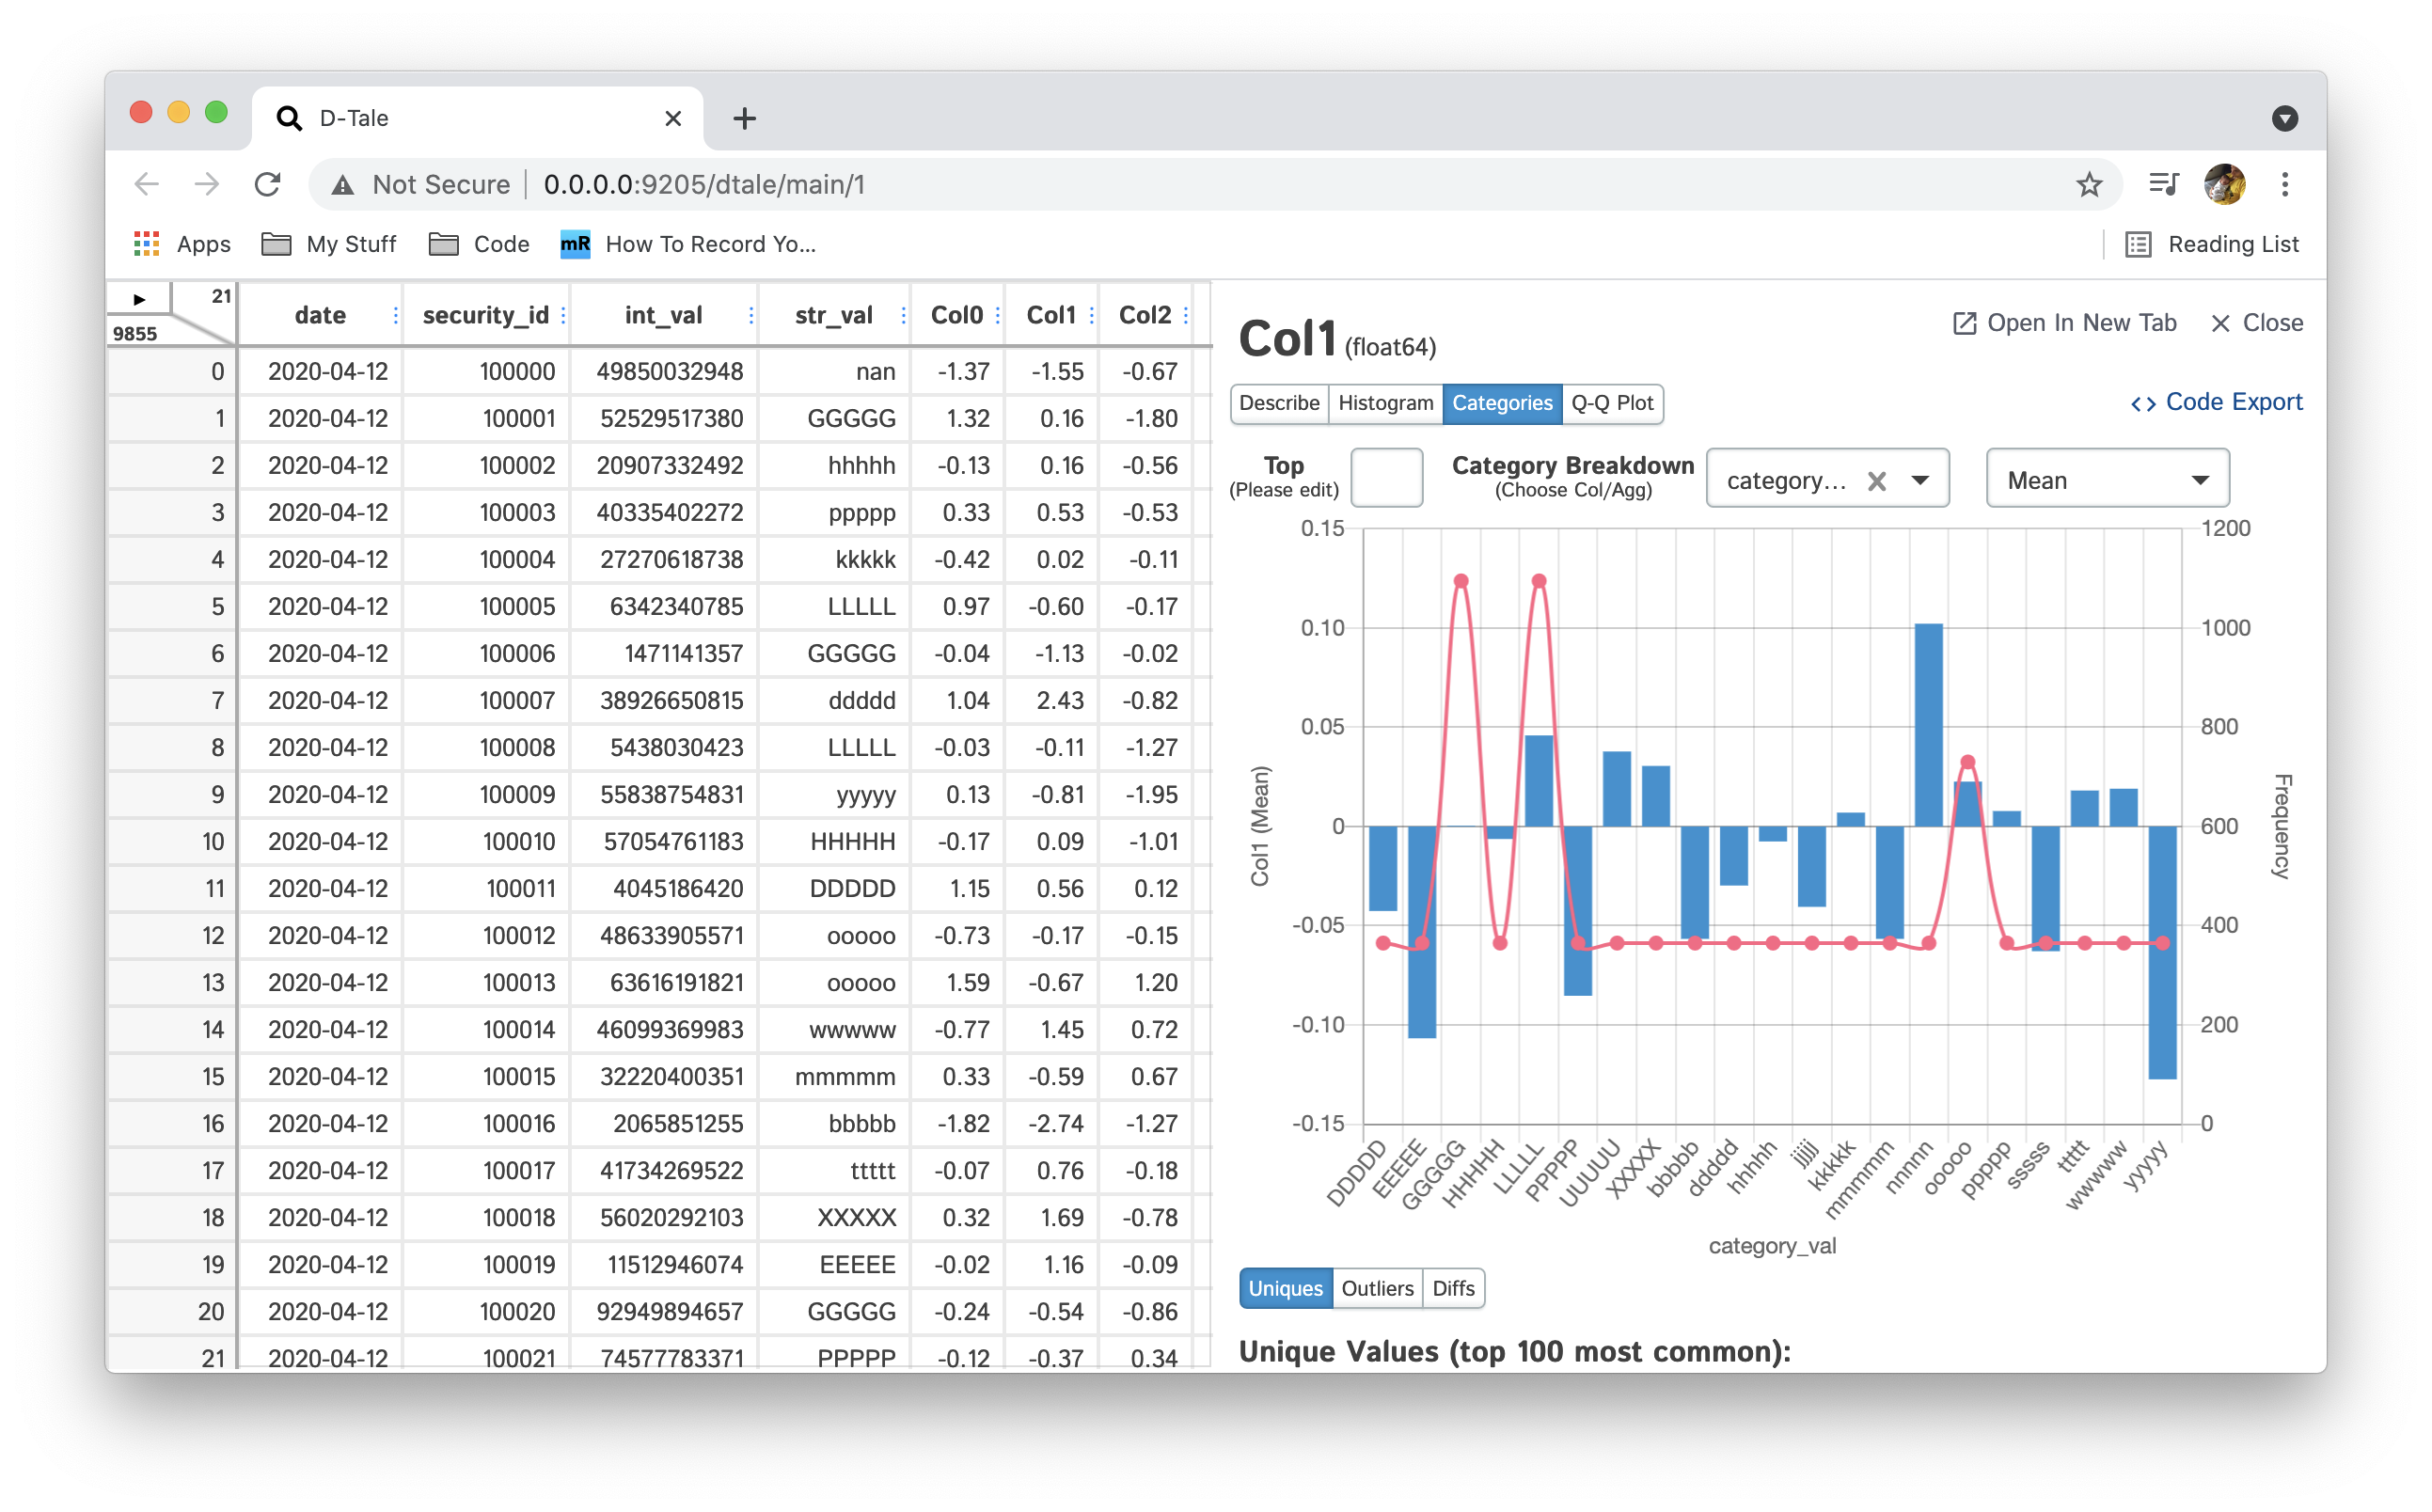 |
| Geolocation* | Int, Float |  |
| Q-Q Plot | Int, Float, Date | 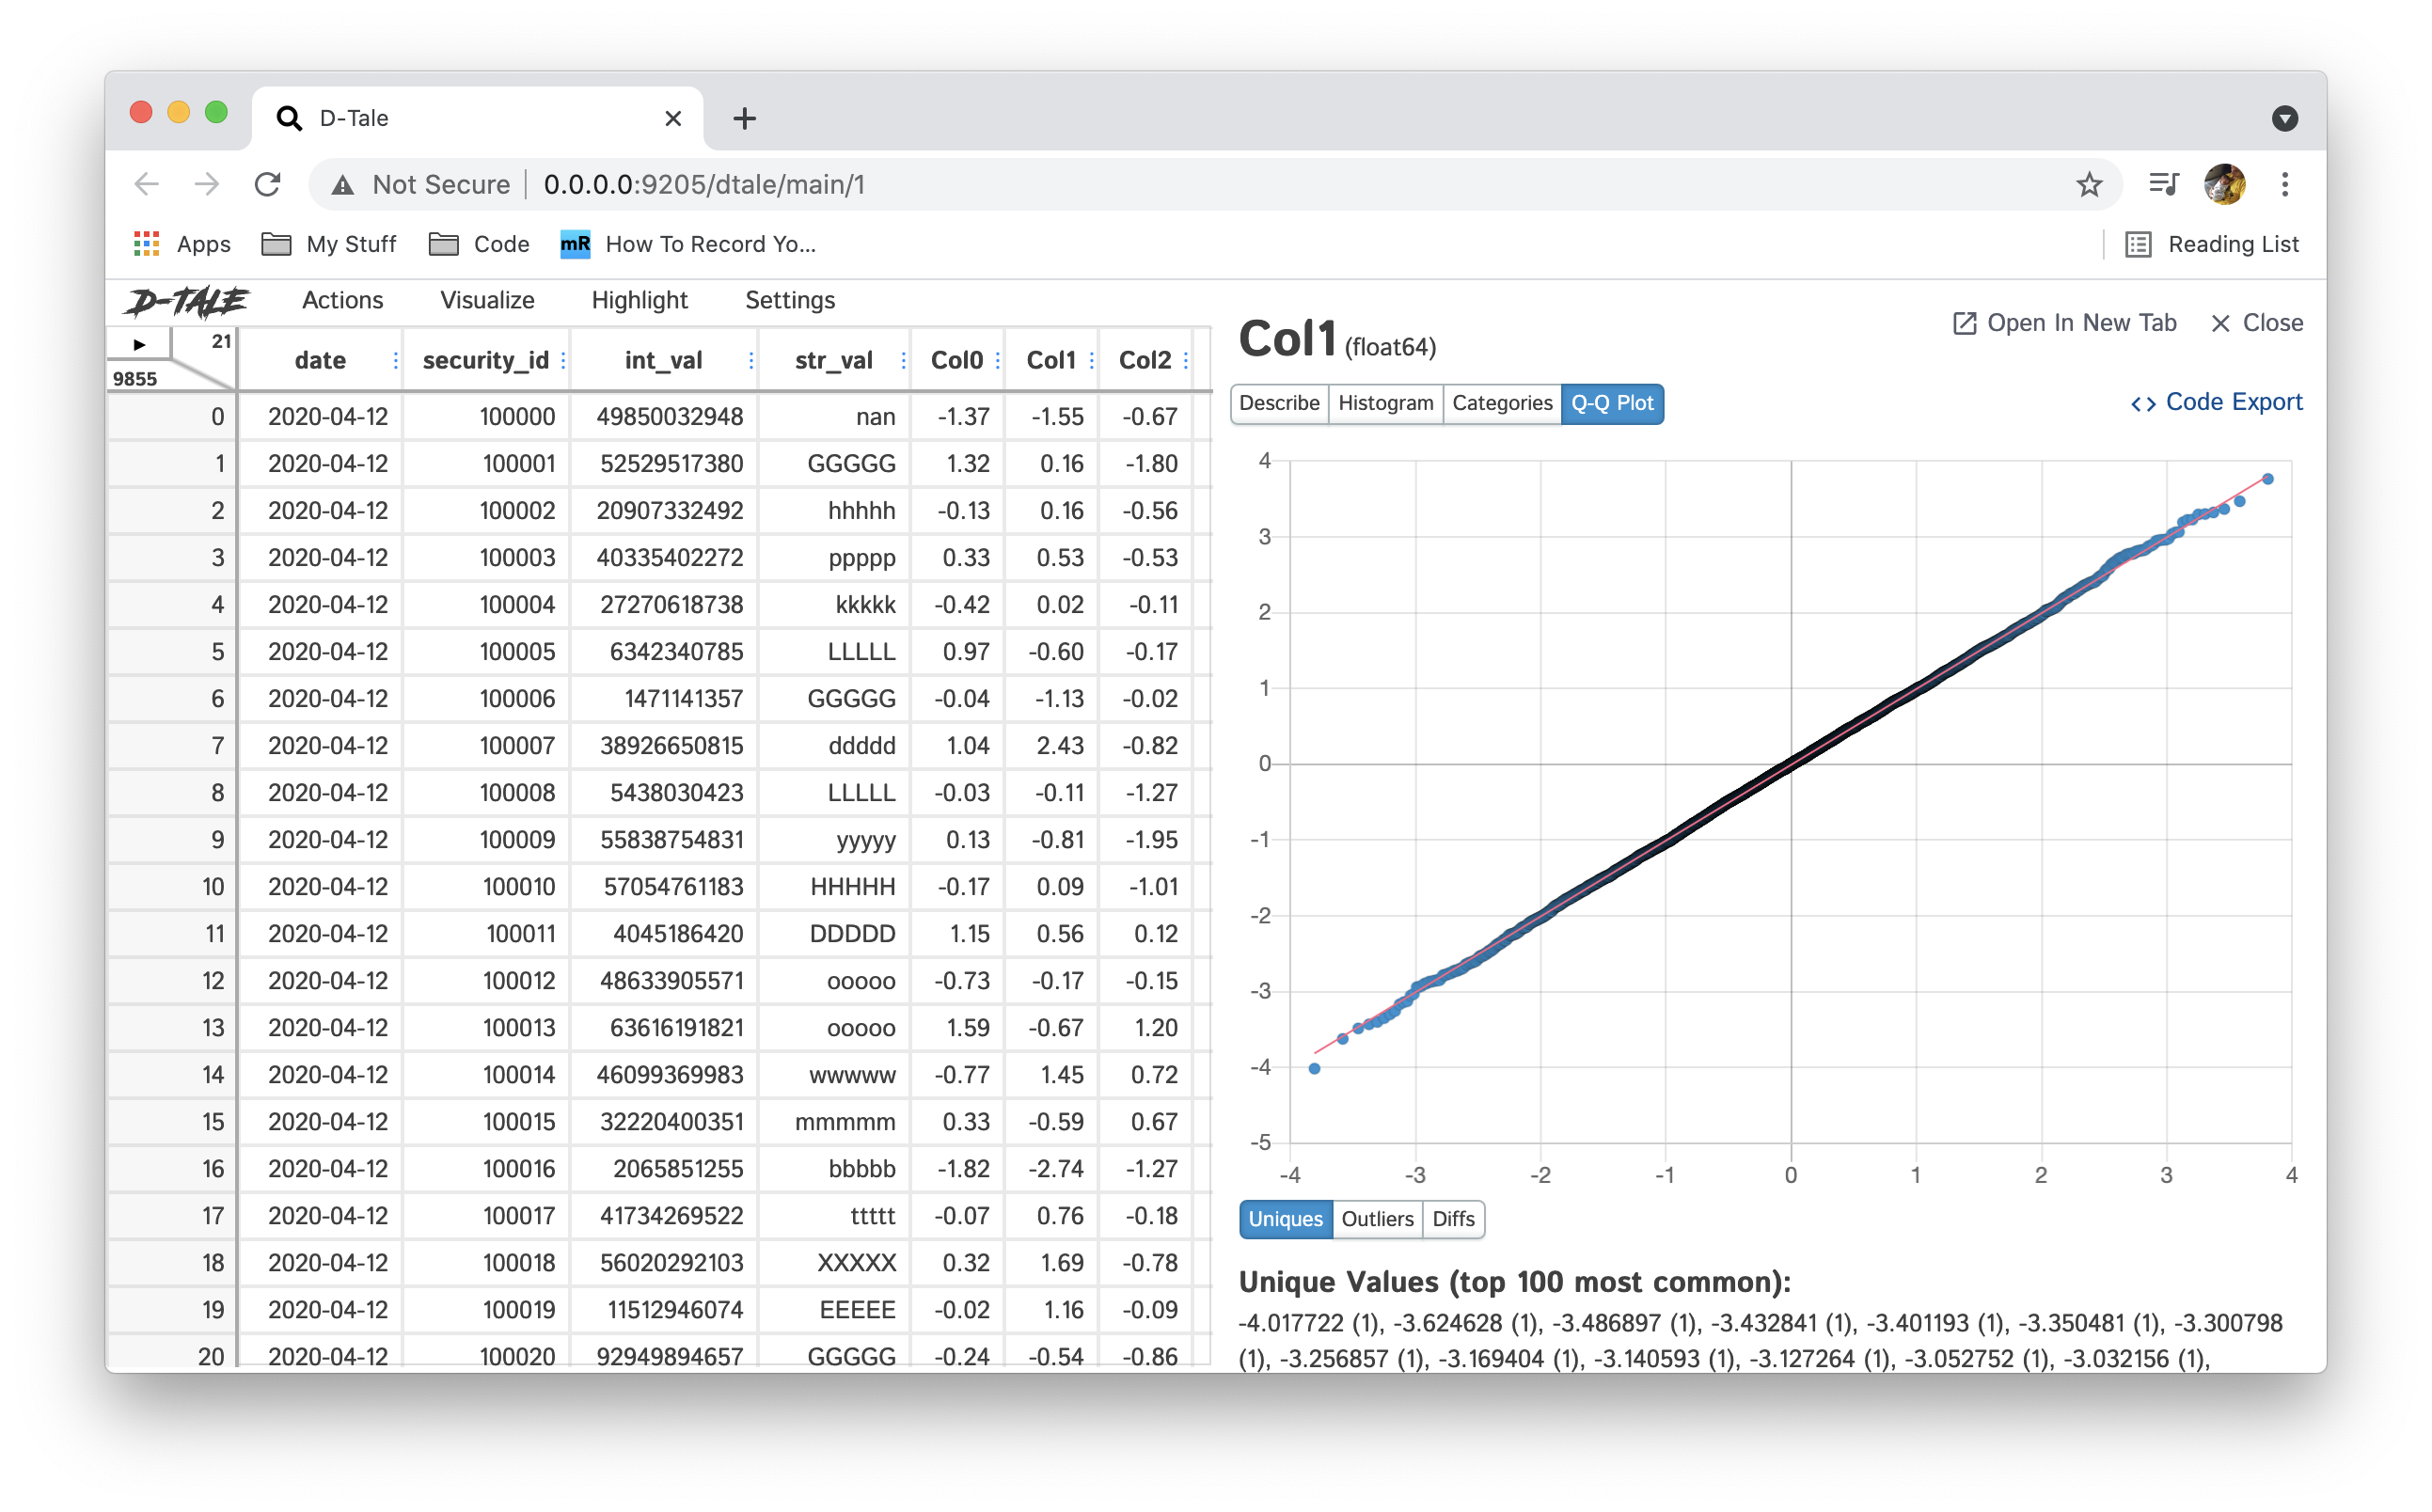 |
Histogram can be displayed in any number of bins (default: 20), simply type a new integer value in the bins input
Value Count by default, show the top 100 values ranked by frequency. If you would like to show the least frequent values simply make your number negative (-10 => 10 least frequent value)
Value Count w/ Ordinal you can also apply an ordinal to your Value Count chart by selecting a column (of type int or float) and applying an aggregation (default: sum) to it (sum, mean, etc...) this column will be grouped by the column you're analyzing and the value produced by the aggregation will be used to sort your bars and also displayed in a line. Here's an example:
Word Value Count you can analyze string data by splitting each record by spaces to see the counts of each word. This chart has all the same functions available as "Value Counts". In addition, you can select multiple "Cleaner" functions to be applied to your column before building word values. These functions will perform operations like removing punctuation, removing numeric character & normalizing accent characters.
Category (Category Breakdown) when viewing float columns you can also see them broken down by a categorical column (string, date, int, etc...). This means that when you select a category column this will then display the frequency of each category in a line as well as bars based on the float column you're analyzing grouped by that category and computed by your aggregation (default: mean).
Geolocation when your data contains latitude & longitude then you can view the coverage in a plotly scattergeo map. In order to have access this chart your dataframe must have at least one of each of these types of columns:
- "lat" must be contained within the lower-cased version of the column name and values be between -90 & 90
- "lon" must be contained within the lower-cased version of the column name and values be between -180 & 180
Hotkeys
These are key combinations you can use in place of clicking actual buttons to save a little time:
| Keymap | Action |
|---|---|
shift+m | Opens main menu* |
shift+d | Opens "Describe" page* |
shift+f | Opens "Custom Filter"* |
shift+b | Opens "Build Column"* |
shift+c | Opens "Charts" page* |
shift+x | Opens "Code Export"* |
esc | Closes any open modal window or side panel & exits cell editing |
* Does not fire if user is actively editing a cell.
Menu Functions Depending on Browser Dimensions
Depending on the dimensions of your browser window the following buttons will not open modals, but rather separate browser windows: Correlations, Describe & Instances (see images from Jupyter Notebook, also Charts will always open in a separate browser window)
For Developers
Cloning
Clone the code (git clone ssh://git@github.com:manahl/dtale.git), then start the backend server:
$ git clone ssh://git@github.com:manahl/dtale.git
# install the dependencies
$ python setup.py develop
# start the server
$ dtale --csv-path /home/jdoe/my_csv.csv --csv-parse_dates date
You can also run dtale from PyDev directly.
You will also want to import javascript dependencies and build the source (all javascript code resides in the frontend folder):
$ cd frontend
$ npm install
# 1) a persistent server that serves the latest JS:
$ npm run watch
# 2) or one-off build:
$ npm run build
Running tests
The usual npm test command works:
$ npm test
You can run individual test files:
$ npm run test -- static/__tests__/dtale/DataViewer-base-test.jsx
Linting
You can lint all the JS and CSS to confirm there's nothing obviously wrong with it:
$ npm run lint
You can also lint individual JS files:
$ npm run lint-js-file -s -- static/dtale/DataViewer.jsx
Formatting JS
You can auto-format code as follows:
$ npm run format
Docker Development
You can build python 27-3 & run D-Tale as follows:
$ yarn run build
$ docker-compose build dtale_2_7
$ docker run -it --network host dtale_2_7:latest
$ python
>>> import pandas as pd
>>> df = pd.DataFrame([dict(a=1,b=2,c=3)])
>>> import dtale
>>> dtale.show(df)
Then view your D-Tale instance in your browser using the link that gets printed
You can build python 36-1 & run D-Tale as follows:
$ yarn run build
$ docker-compose build dtale_3_6
$ docker run -it --network host dtale_3_6:latest
$ python
>>> import pandas as pd
>>> df = pd.DataFrame([dict(a=1,b=2,c=3)])
>>> import dtale
>>> dtale.show(df)
Then view your D-Tale instance in your browser using the link that gets printed
Adding Language Support
Currently D-Tale support both english & chinese but other languages will gladly be supported. To add another language simply open a pull request with the following:
- cake a copy & translate the values in the following JSON english JSON files and save them to the same locations as each file
- Back-End
- Front-End
- please make the name of these files the name of the language you are adding (currently english -> en, chinese -> cn)
- be sure to keep the keys in english, that is important
Looking forward to what languages come next! :smile:
Global State/Data Storage
If D-Tale is running in an environment with multiple python processes (ex: on a web server running gunicorn) it will most likely encounter issues with inconsistent state. Developers can fix this by configuring the system D-Tale uses for storing data. Detailed documentation is available here: Data Storage and managing Global State
Startup Behavior
Here's a little background on how the dtale.show() function works:
- by default it will look for ports between 40000 & 49000, but you can change that range by specifying the environment variables DTALE_MIN_PORT & DTALE_MAX_PORT
- think of sessions as python consoles or jupyter notebooks
- Session 1 executes
dtale.show(df)our state is:
| Session | Port | Active Data IDs | URL(s) |
|---|---|---|---|
| 1 | 40000 | 1 | http://localhost:40000/dtale/main/1 |
- Session 1 executes
dtale.show(df)our state is:
| Session | Port | Active Data IDs | URL(s) |
|---|---|---|---|
| 1 | 40000 | 1,2 | http://localhost:40000/dtale/main/[1,2] |
- Session 2 executes
dtale.show(df)our state is:
| Session | Port | Active Data IDs | URL(s) |
|---|---|---|---|
| 1 | 40000 | 1,2 | http://localhost:40000/dtale/main/[1,2] |
| 2 | 40001 | 1 | http://localhost:40001/dtale/main/1 |
- Session 1 executes
dtale.show(df, port=40001, force=True)our state is:
| Session | Port | Active Data IDs | URL(s) |
|---|---|---|---|
| 1 | 40001 | 1,2,3 | http://localhost:40001/dtale/main/[1,2,3] |
- Session 3 executes
dtale.show(df)our state is:
| Session | Port | Active Data IDs | URL(s) |
|---|---|---|---|
| 1 | 40001 | 1,2,3 | http://localhost:40001/dtale/main/[1,2,3] |
| 3 | 40000 | 1 | http://localhost:40000/dtale/main/1 |
- Session 2 executes
dtale.show(df)our state is:
| Session | Port | Active Data IDs | URL(s) |
|---|---|---|---|
| 1 | 40001 | 1,2,3 | http://localhost:40001/dtale/main/[1,2,3] |
| 3 | 40000 | 1 | http://localhost:40000/dtale/main/1 |
| 2 | 40002 | 1 | http://localhost:40002/dtale/main/1 |
- Session 4 executes
dtale.show(df, port=8080)our state is:
| Session | Port | Active Data IDs | URL(s) |
|---|---|---|---|
| 1 | 40001 | 1,2,3 | http://localhost:40001/dtale/main/[1,2,3] |
| 3 | 40000 | 1 | http://localhost:40000/dtale/main/1 |
| 2 | 40002 | 1 | http://localhost:40002/dtale/main/1 |
| 4 | 8080 | 1 | http://localhost:8080/dtale/main/1 |
- Session 1 executes
dtale.get_instance(1).kill()our state is:
| Session | Port | Active Data IDs | URL(s) |
|---|---|---|---|
| 1 | 40001 | 2,3 | http://localhost:40001/dtale/main/[2,3] |
| 3 | 40000 | 1 | http://localhost:40000/dtale/main/1 |
| 2 | 40002 | 1 | http://localhost:40002/dtale/main/1 |
| 4 | 8080 | 1 | http://localhost:8080/dtale/main/1 |
- Session 5 sets DTALE_MIN_RANGE to 30000 and DTALE_MAX_RANGE 39000 and executes
dtale.show(df)our state is:
| Session | Port | Active Data ID(s) | URL(s) |
|---|---|---|---|
| 1 | 40001 | 2,3 | http://localhost:40001/dtale/main/[2,3] |
| 3 | 40000 | 1 | http://localhost:40000/dtale/main/1 |
| 2 | 40002 | 1 | http://localhost:40002/dtale/main/1 |
| 4 | 8080 | 1 | http://localhost:8080/dtale/main/1 |
| 5 | 30000 | 1 | http://localhost:30000/dtale/main/1 |
Documentation
Have a look at the detailed documentation.
Dependencies
- Back-end
- dash
- dash_daq
- Flask
- Flask-Compress
- Pandas
- plotly
- scikit-learn
- scipy
- xarray
- arctic [extra]
- dash-bio [extra]
- flask-ngrok [extra]
- redis [extra]
- rpy2 [extra]
- streamlit [extra]
- swifter [extra]
- Front-end
- react-virtualized
- chart.js
Acknowledgements
D-Tale has been under active development at Man Numeric since 2019.
Original concept and implementation: Andrew Schonfeld
Contributors:
- Phillip Dupuis
- Fernando Saravia Rajal
- Dominik Christ
- Reza Moshksar
- Bertrand Nouvel
- Chris Boddy
- Jason Holden
- Tom Taylor
- Wilfred Hughes
- Mike Kelly
- Vincent Riemer
- Youssef Habchi - title font
- Yadhu Krishna
- ... and many others ...
Contributions welcome!
License
D-Tale is licensed under the GNU LGPL v2.1. A copy of which is included in LICENSE