Awesome
periodic-table-cli

An interactive Periodic Table of Elements app for the console!
Why the console? Because it's the cool way.
Also available for NodeJS. View Homepage.
Usage
$ pip install periodic-table-cli
$ periodic-table-cli
$ periodic-table-cli [options]
The config params are optional (see below).
Note: Supports Python 3.8+. Zero dependencies except windows-curses for Windows.
Interactive Controls
- Navigation: Use
UP/DOWN/LEFT/RIGHTarrows. - Display Mode: Use
SLASH(/) to toggle the display mode forwards. UseBACKSLASH(\) to toggle the display mode in reverse. - Search: Use
UP/DOWNarrows to navigate results. PressENTERto select. PressLEFTto exit search. - Quit: Press
ESCorCTRL+C.
Add the --help flag for more info.
Note:
- Be sure to run in terminals that support 256 colors.
- Minimum required terminal screen dimensions: 156 columns x 46 rows. See scrolling for more info.
Features
Browse
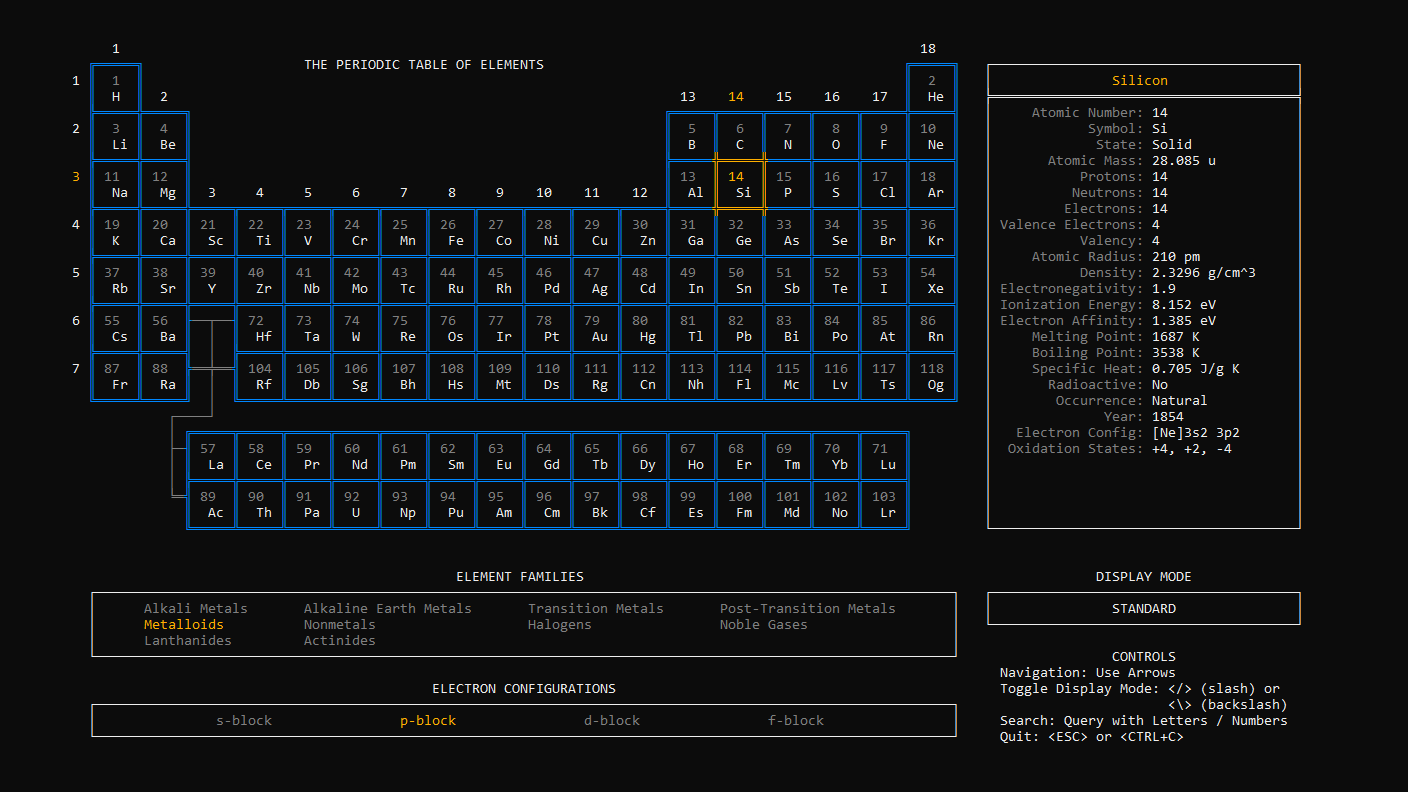
Use arrow keys to navigate and browse across all 118 elements. The selected element appears in gold on the Periodic Table on the left, and 22 data points for that element will display on the right. Each element's family and electron configuration will appear in gold below the Periodic Table.
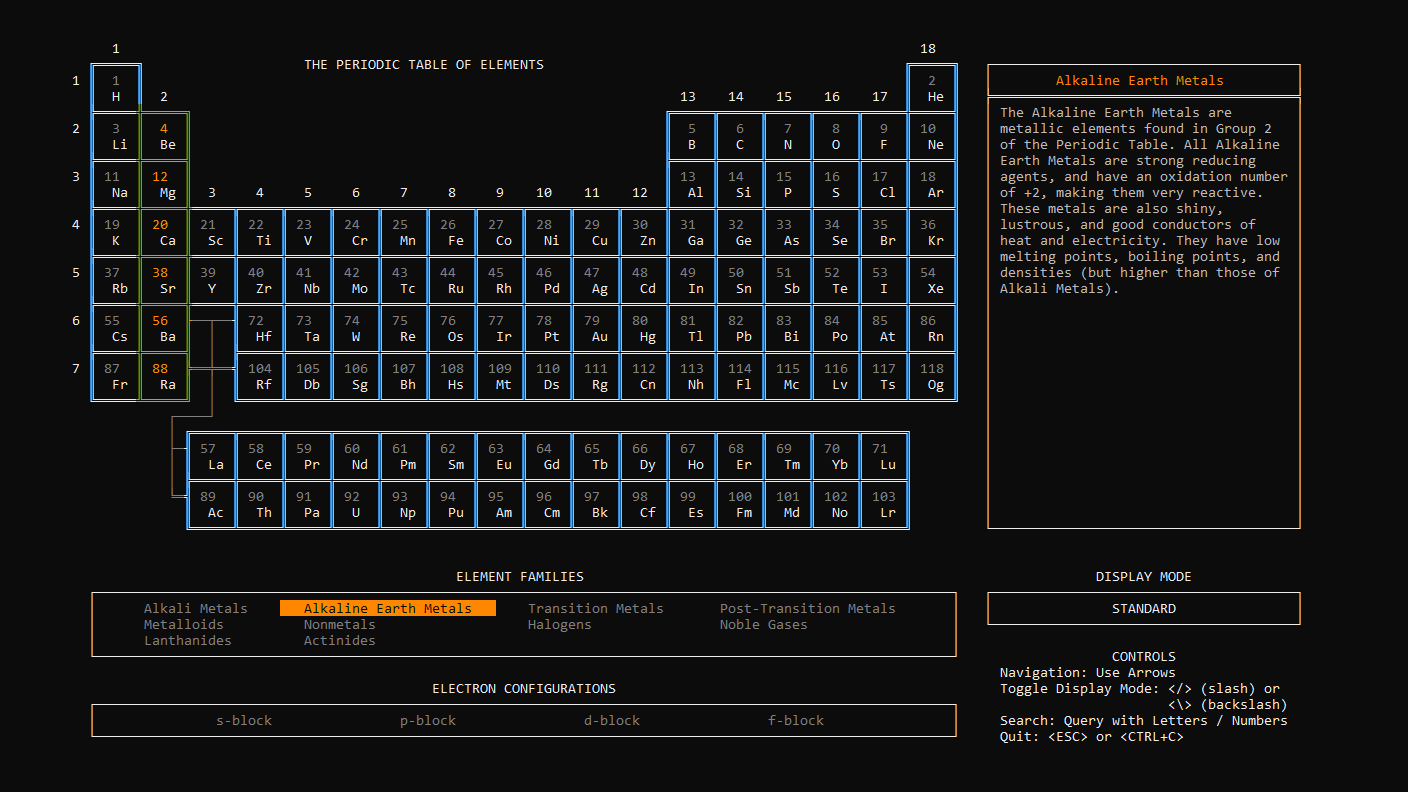
Move the cursor directly below the Periodic Table to browse all 10 element families. The elements in that family will be focused on the Periodic Table, and a description of that family will appear on the right.
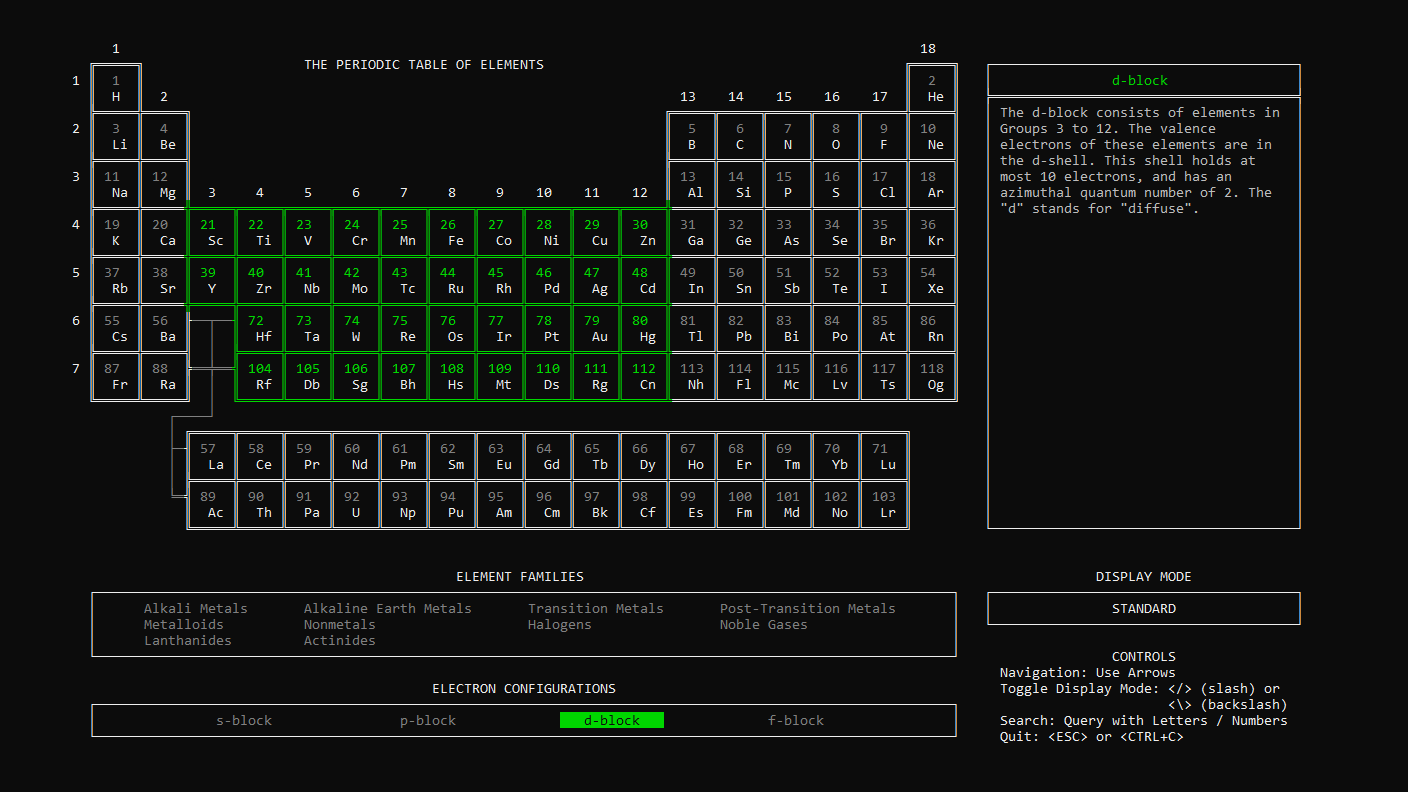
Move the cursor below the element families to browse all 4 electron configurations. The elements with that electron configuration will be focused on the Periodic Table, and a description of that electron shell will appear on the right.
Search
Use letters or numbers to query for an element, family, or electron configuration. Queries are matched on element names, symbols, and atomic numbers, along with family names and electron configuration names. Just start typing to enter search mode. Press the Enter to select a search item, or the Left arrow to exit search mode.
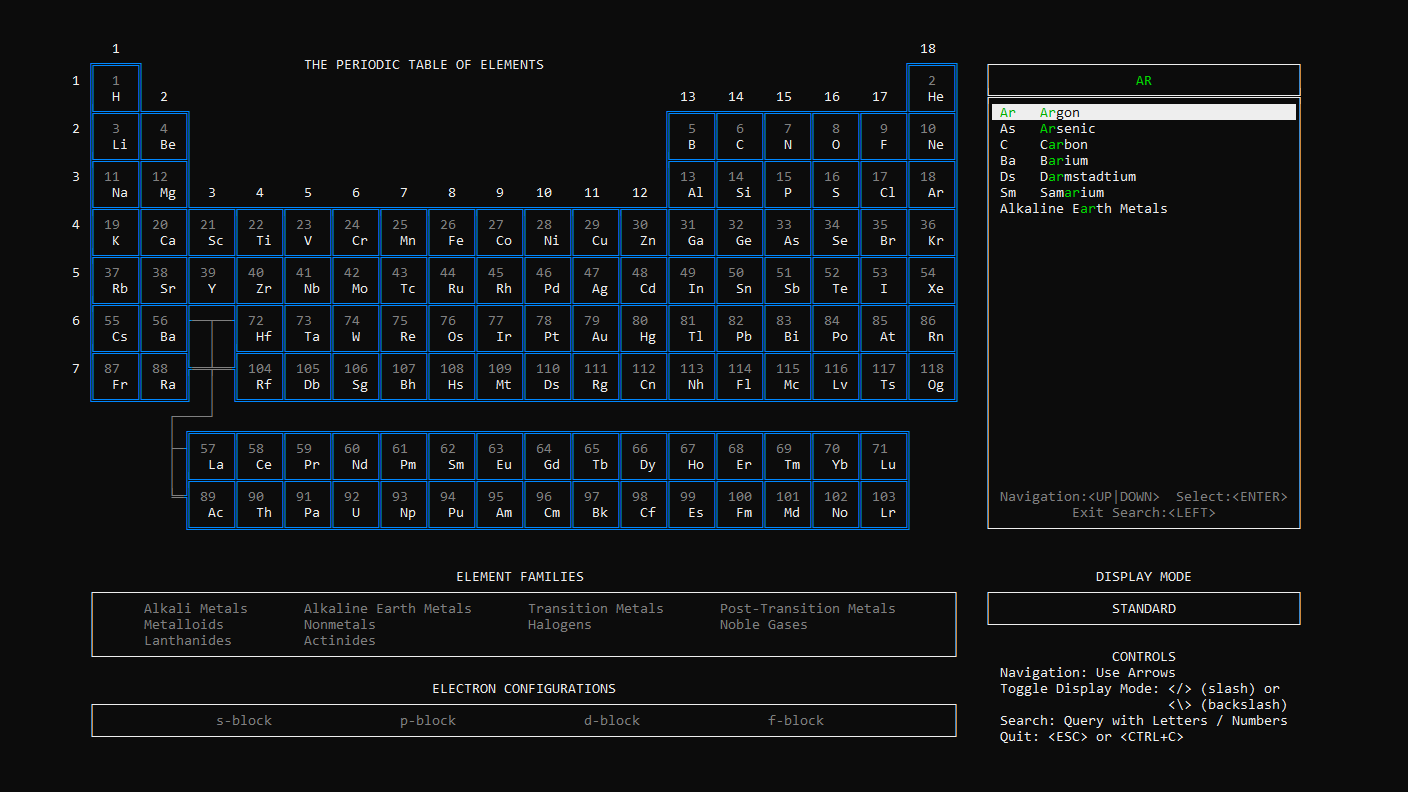
Display Mode
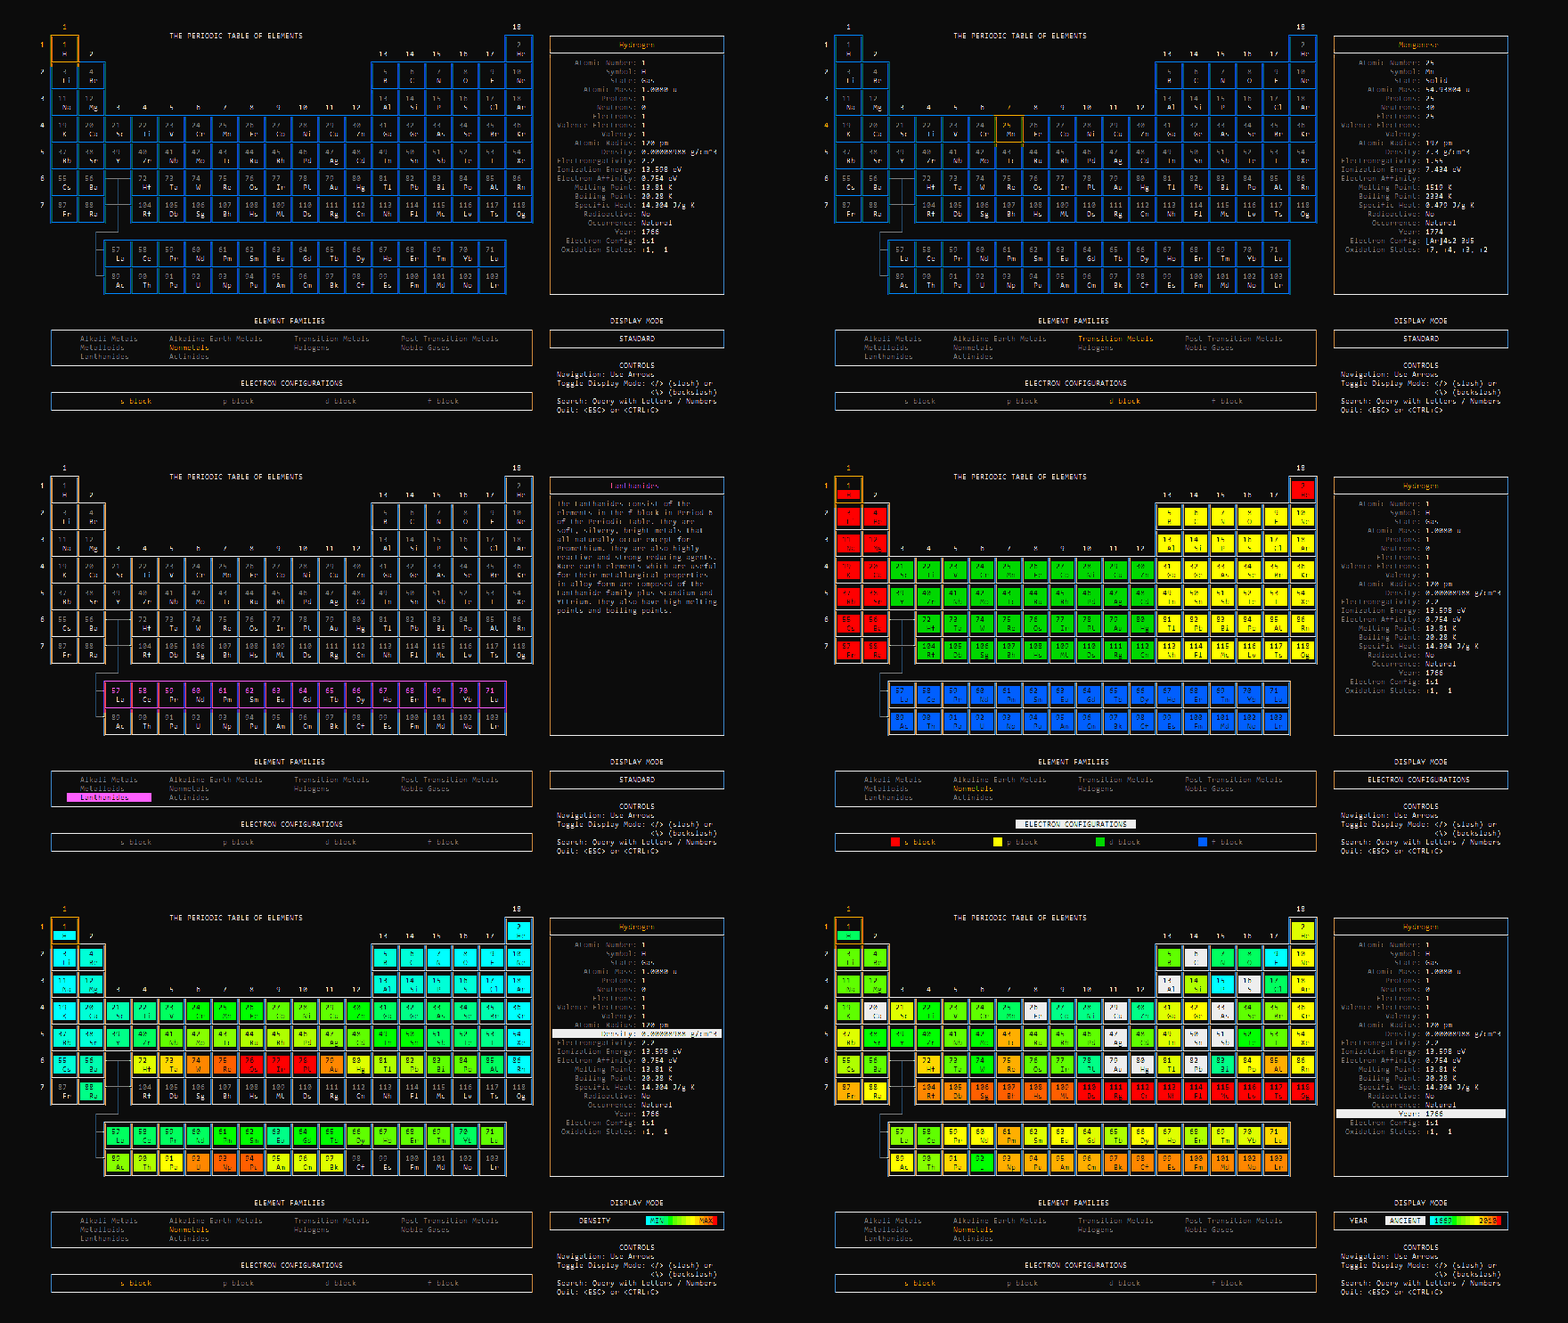
Use the SLASH (/) key to toggle different display modes. Use BACKSLASH (\) to toggle in reverse. The following 20 display modes are supported:
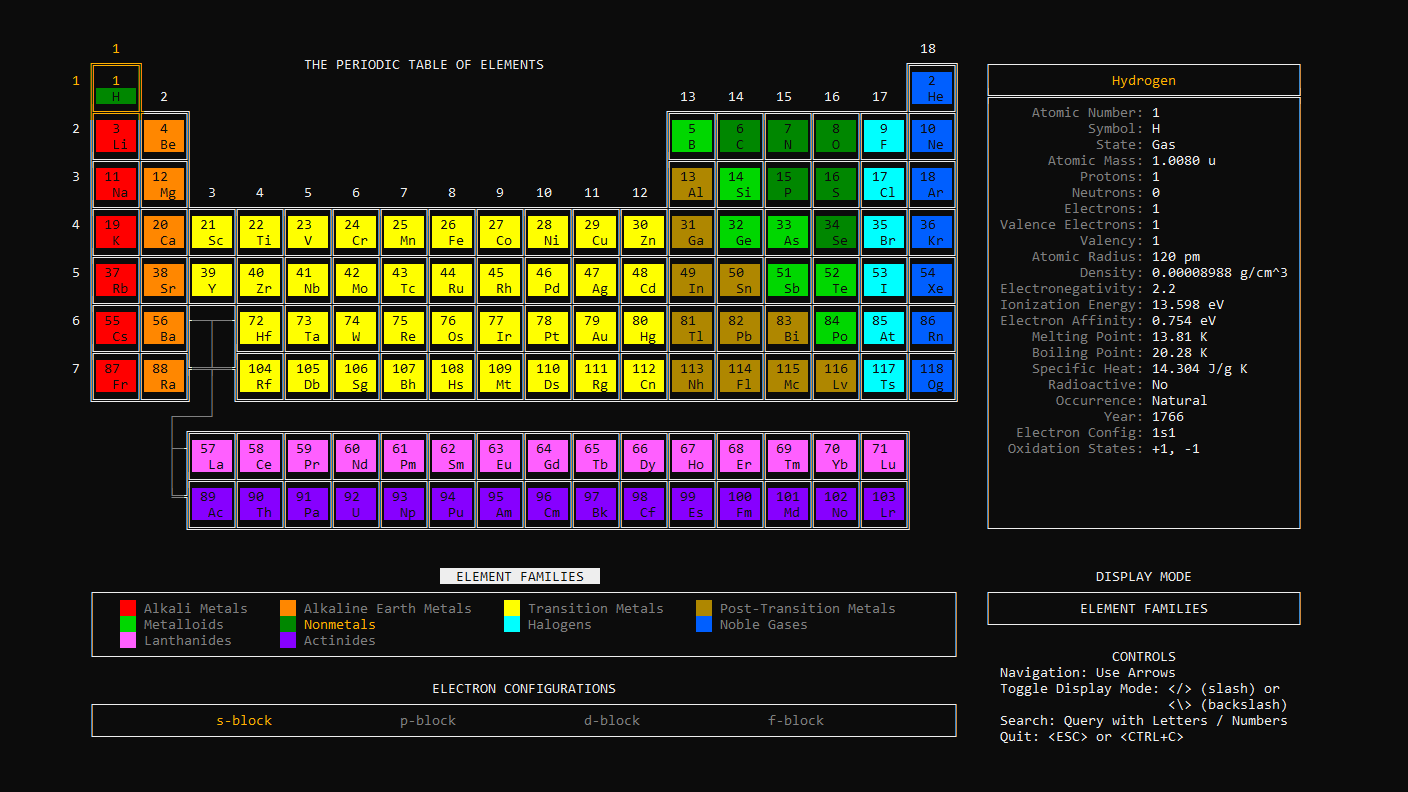
Element Families
Display 10 color-coded element families:
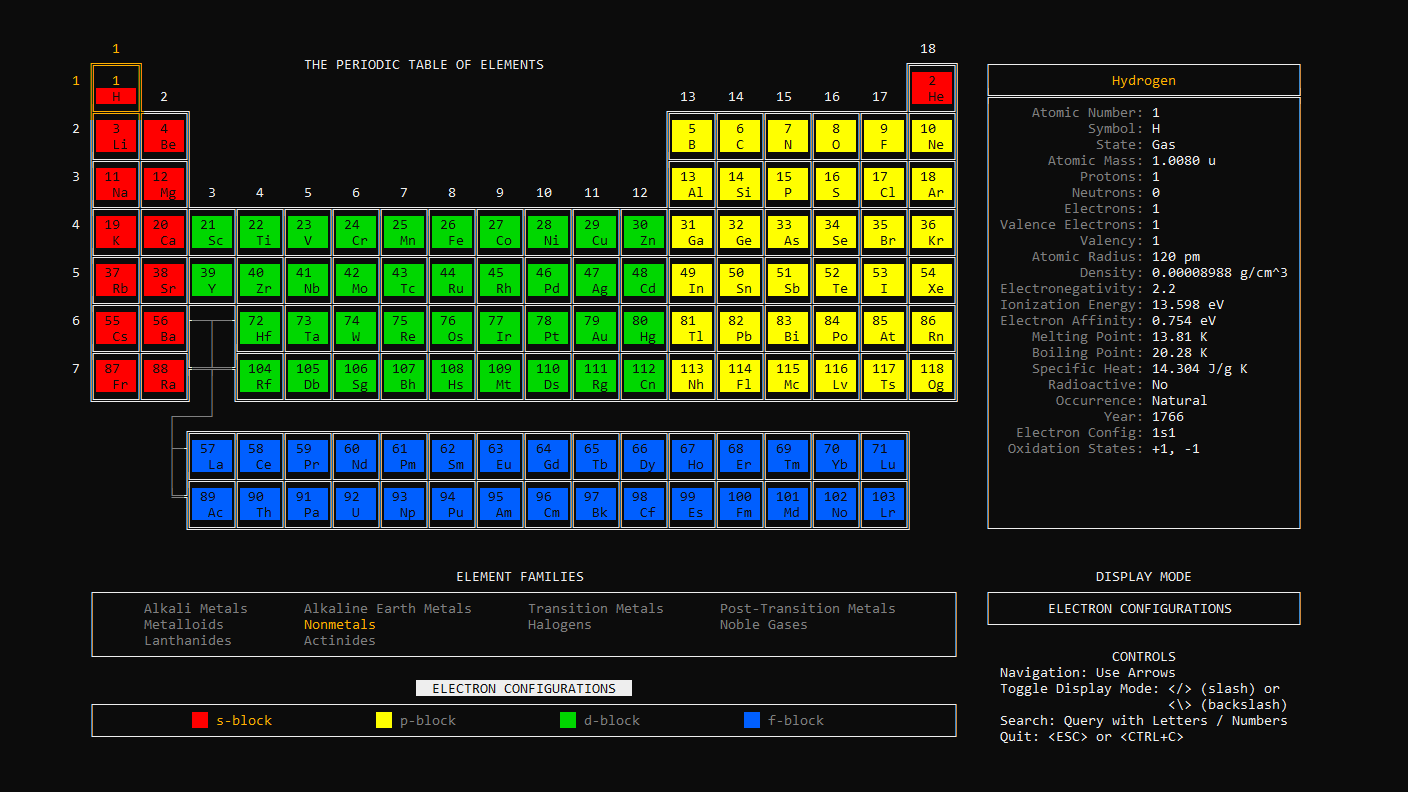
Electron Configurations
Display 4 color-coded electron shells:
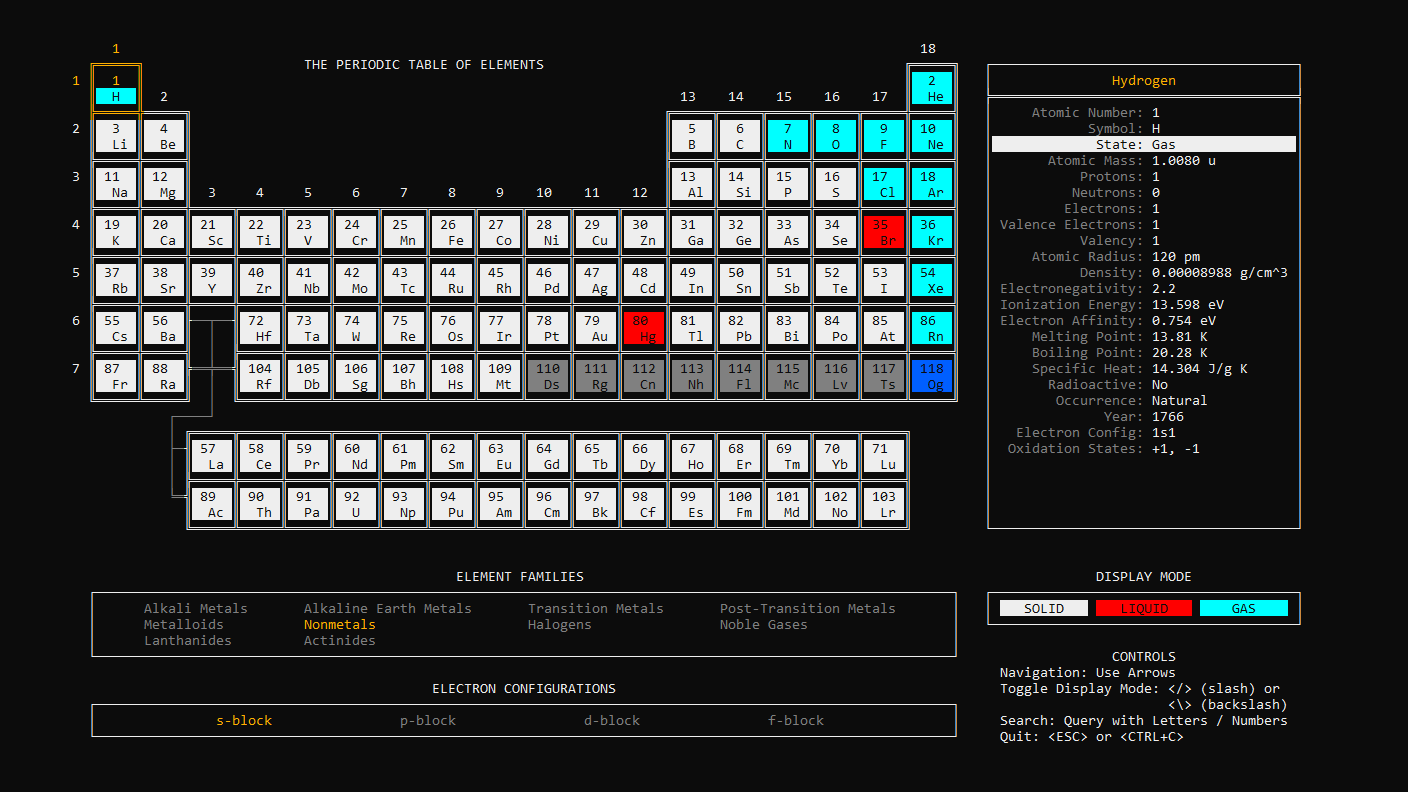
Standard State
Display whether an element is a solid (white), liquid (red), or gas (blue). Expected states appear as a darker color (gray is expected solid, dark blue is expected gas):
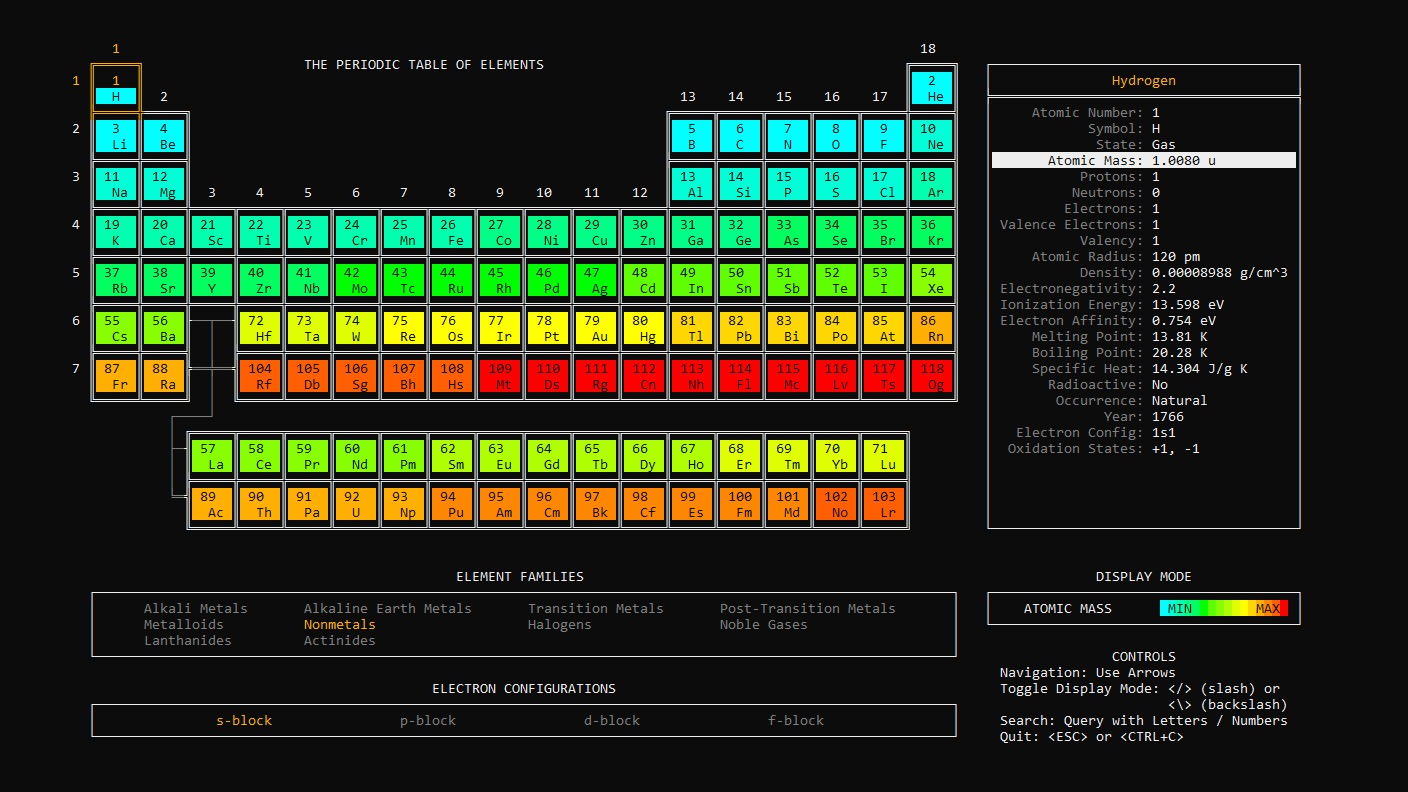
Atomic Mass
Display a heat-map of atomic mass (increasing from blue to red):
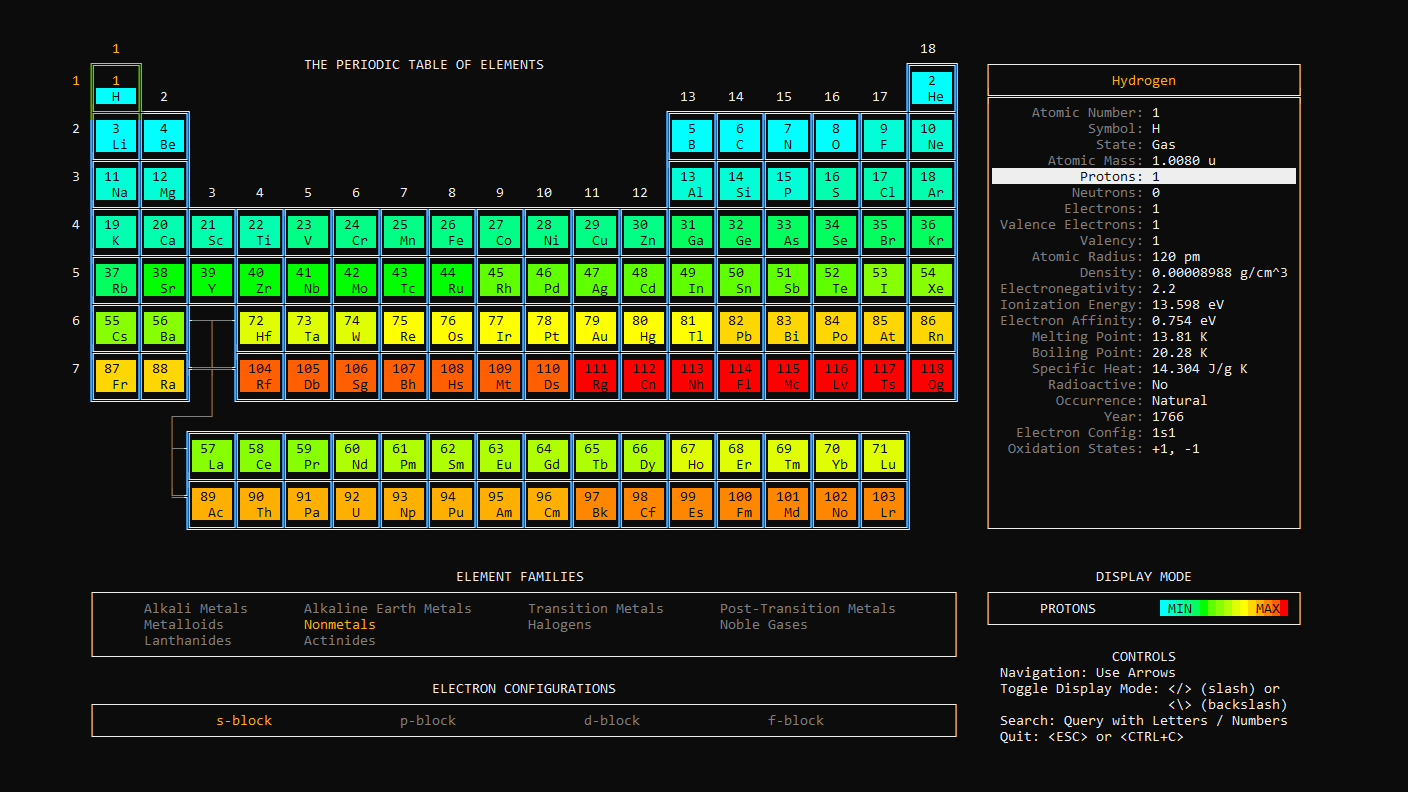
Protons
Display a heat-map of the number of protons (increasing from blue to red):
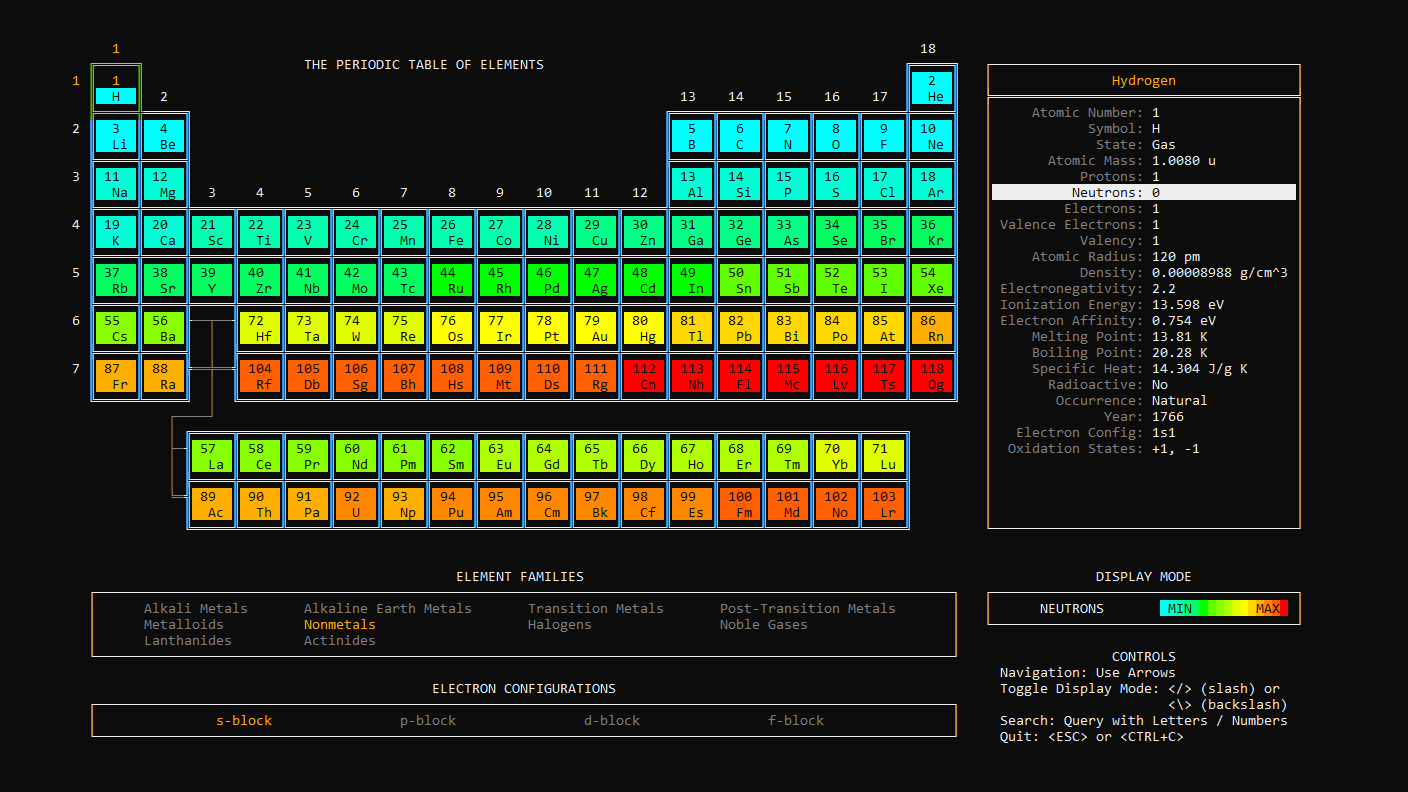
Neutrons
Display a heat-map of the number of neutrons (increasing from blue to red):
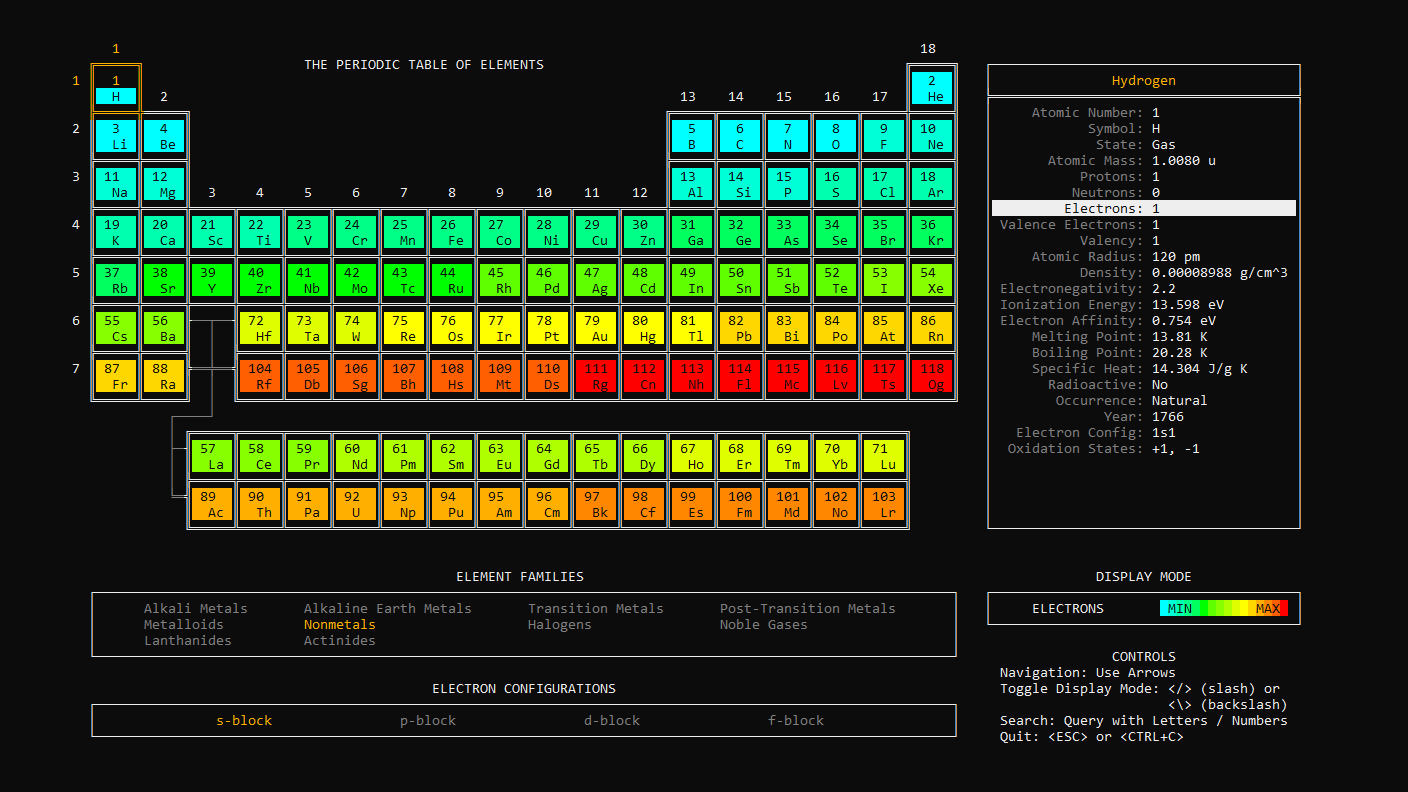
Electrons
Display a heat-map of the number of electrons (increasing from blue to red):
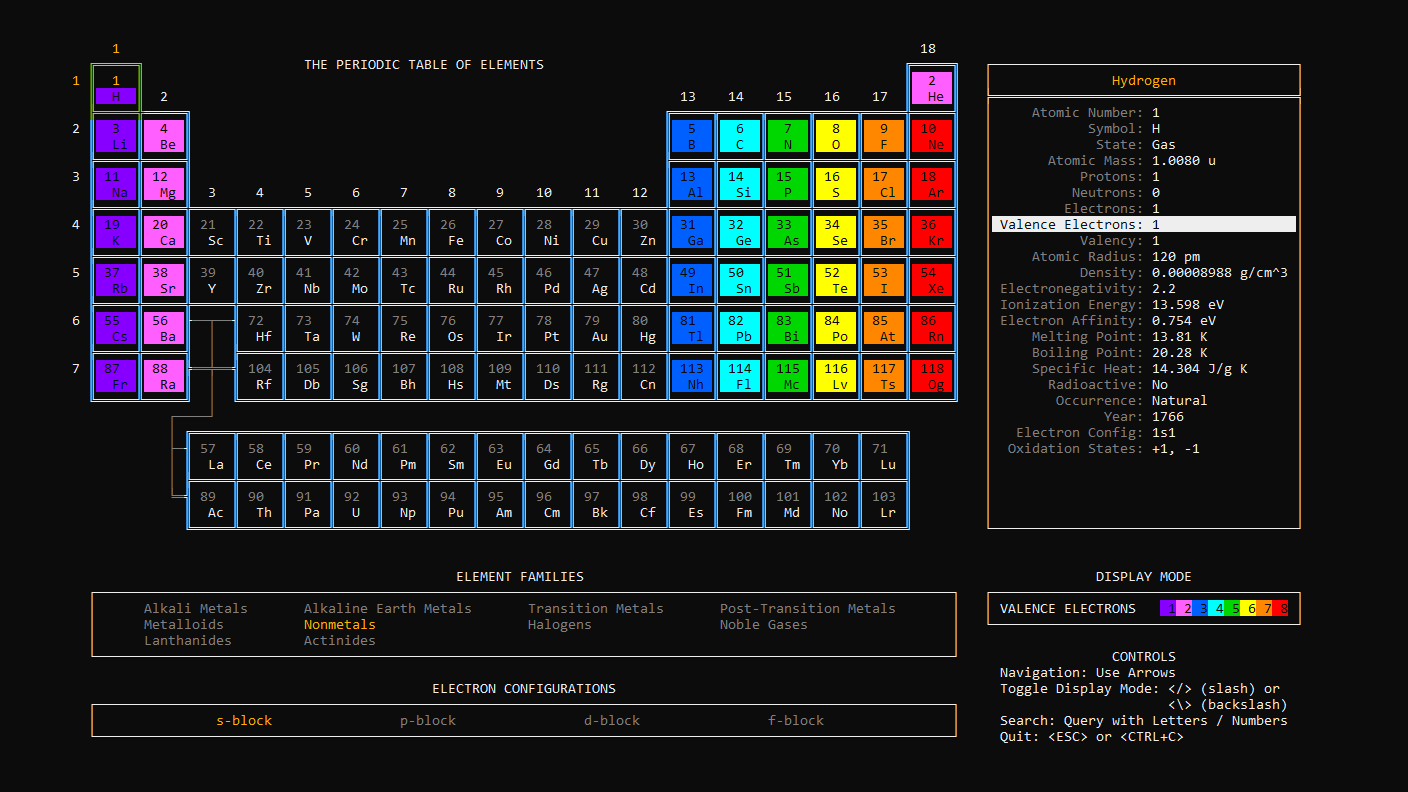
Valence Electrons
Display a color-coded representation of the number of valence electrons:
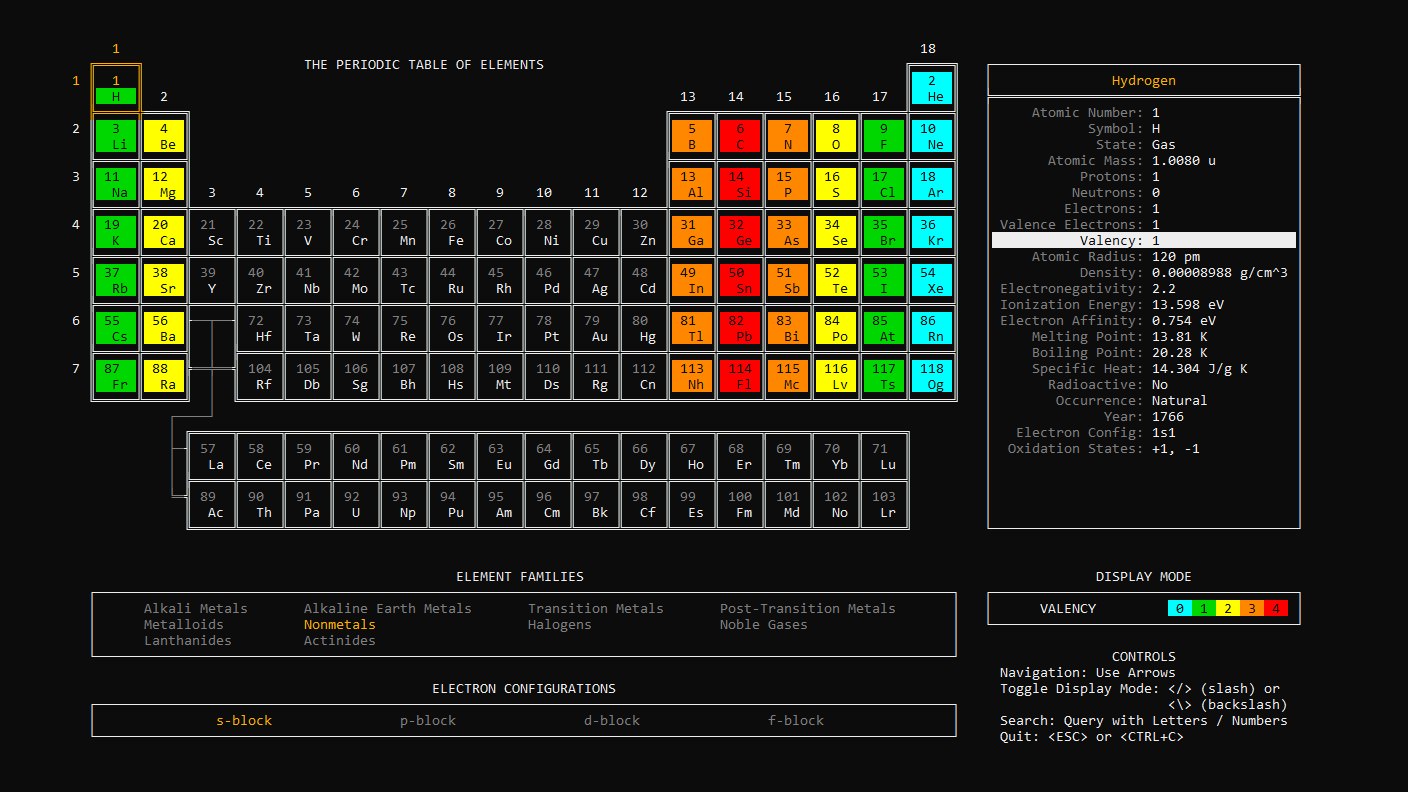
Valency
Display a color-coded representation of valency:
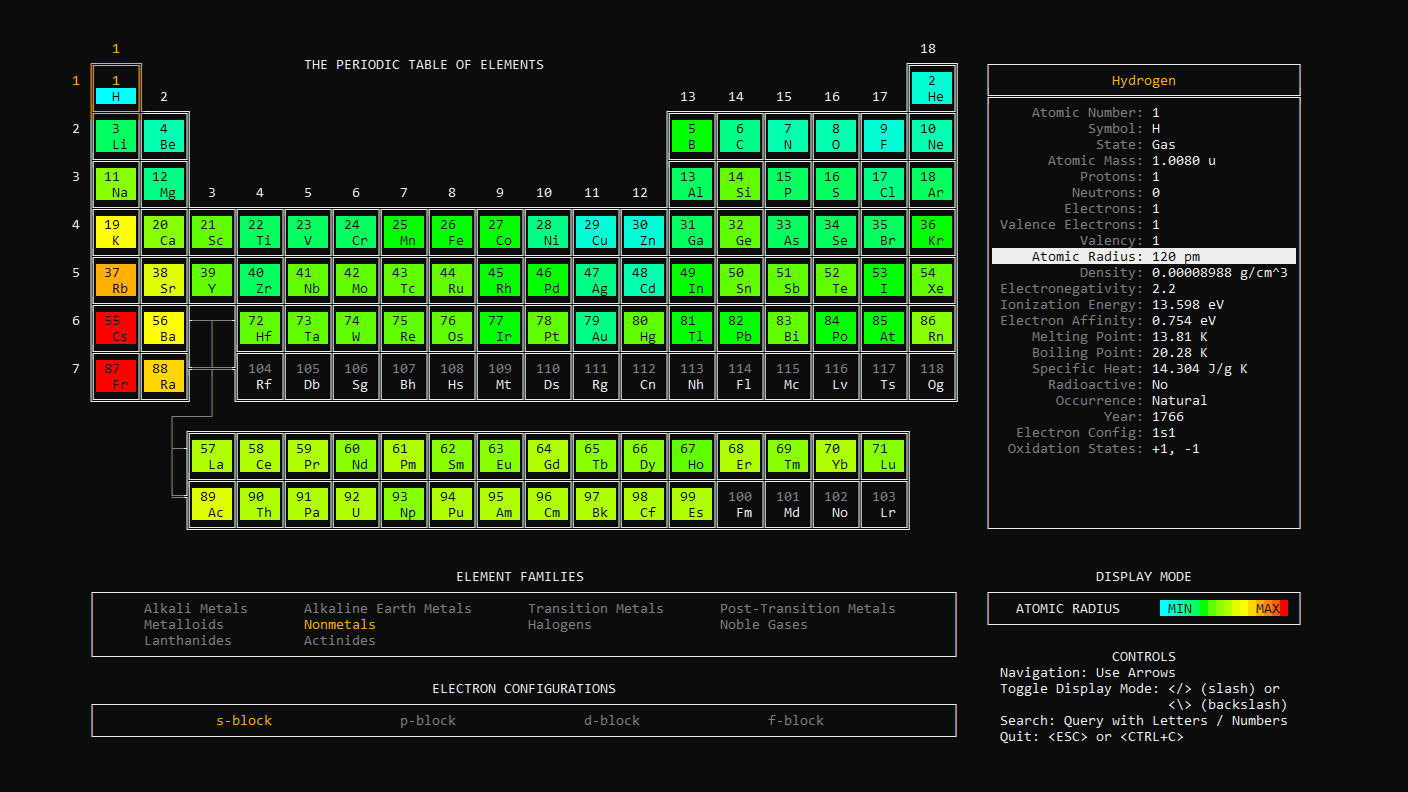
Atomic Radius
Display a heat-map of atomic radius (increasing from blue to red):
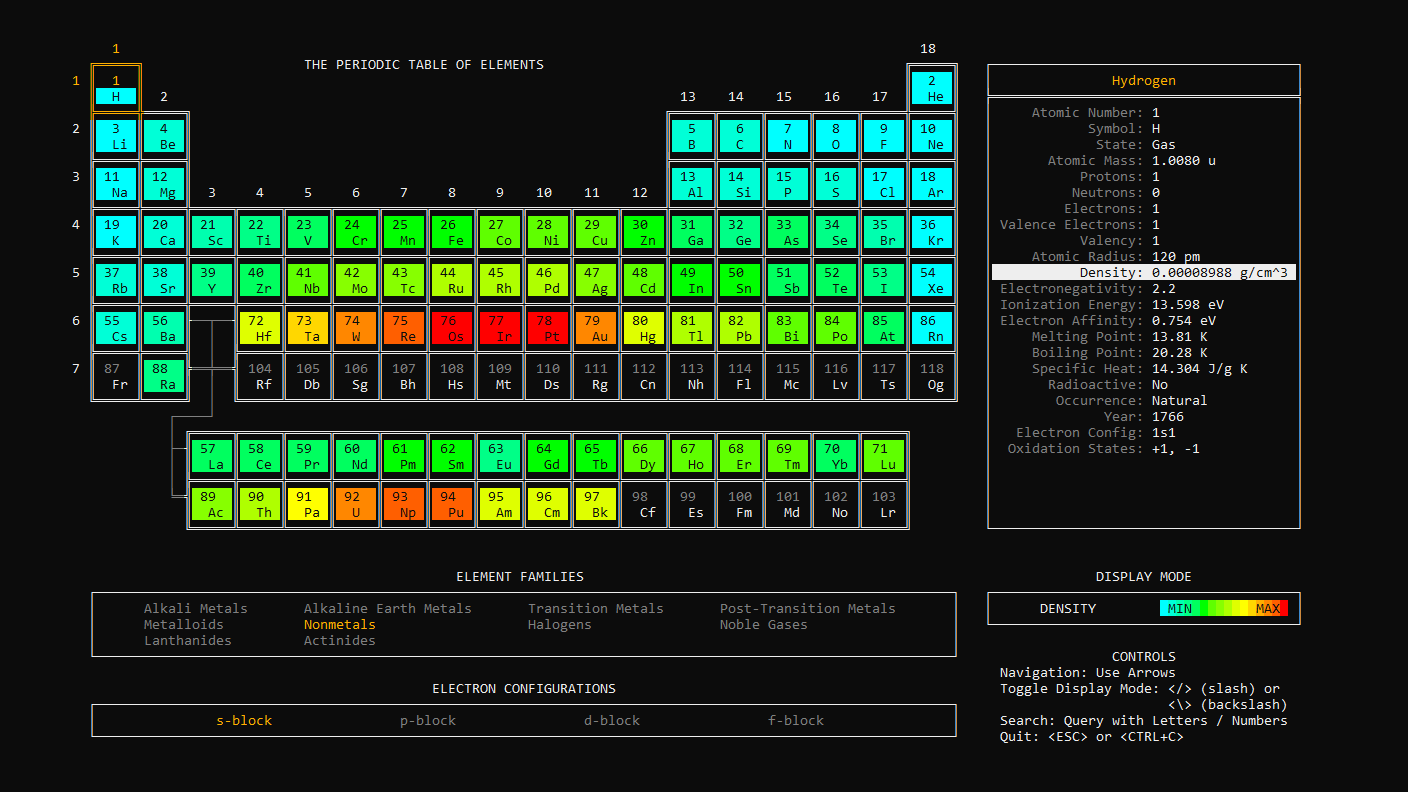
Density
Display a heat-map of density (increasing from blue to red):
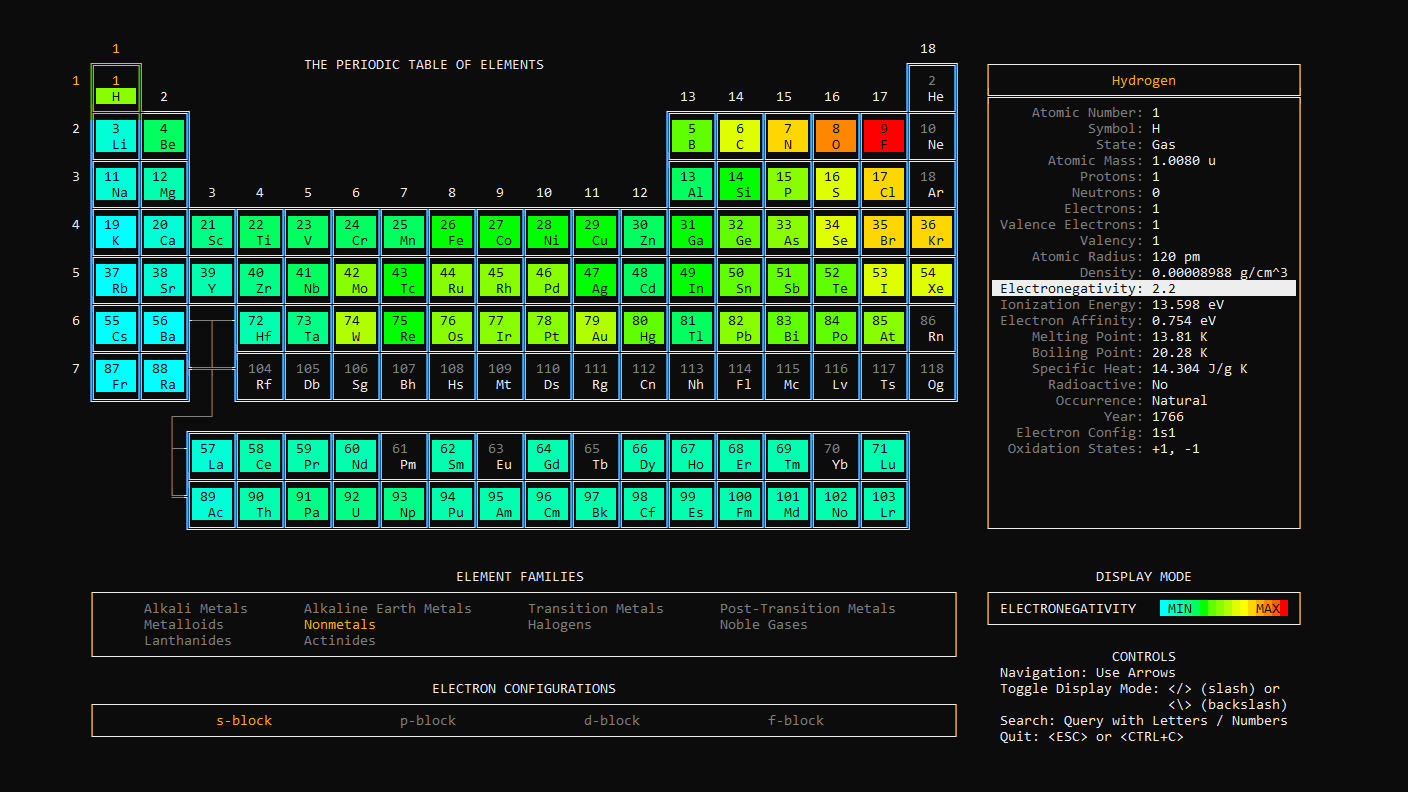
Electronegativity
Display a heat-map of electronegativity (increasing from blue to red):
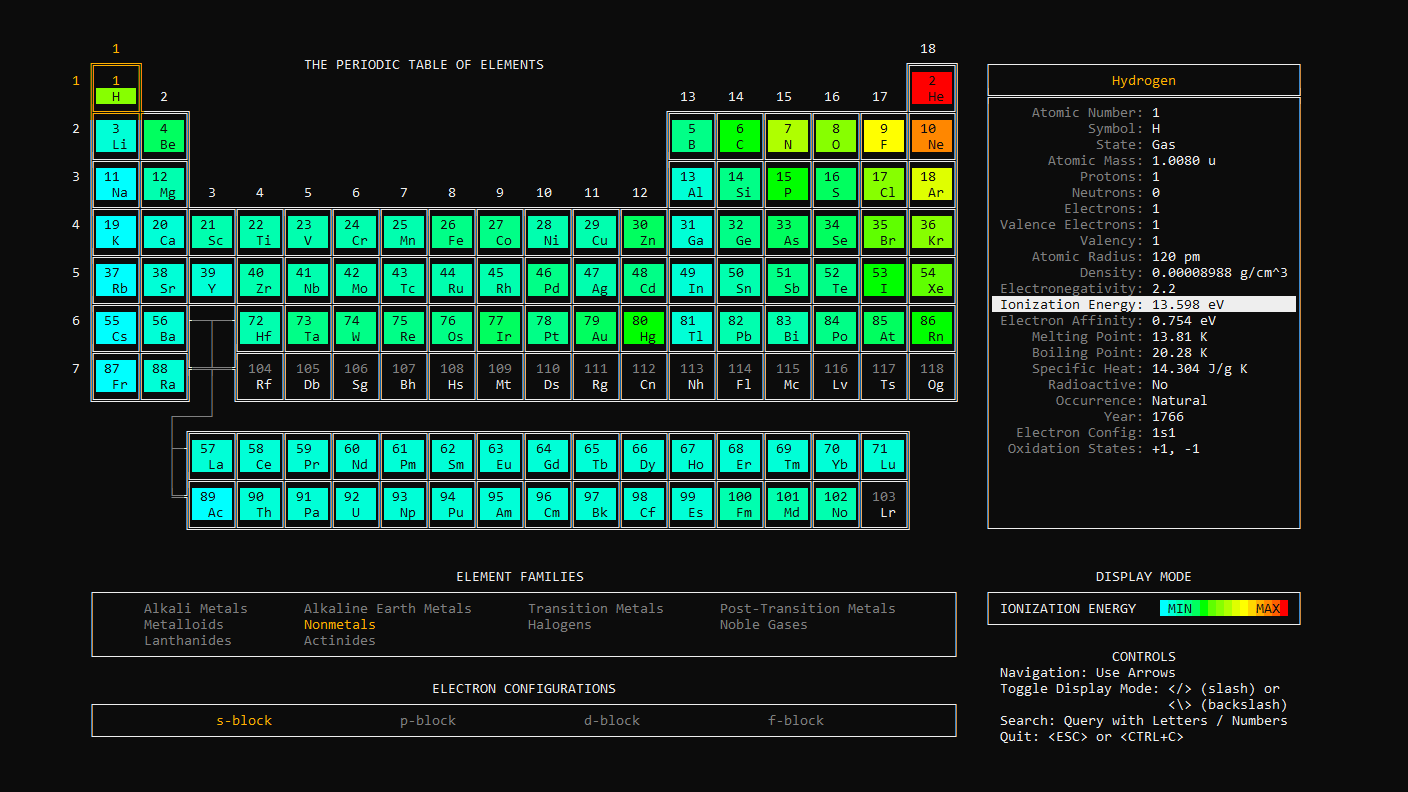
Ionization Energy
Display a heat-map of ionization energy (increasing from blue to red):
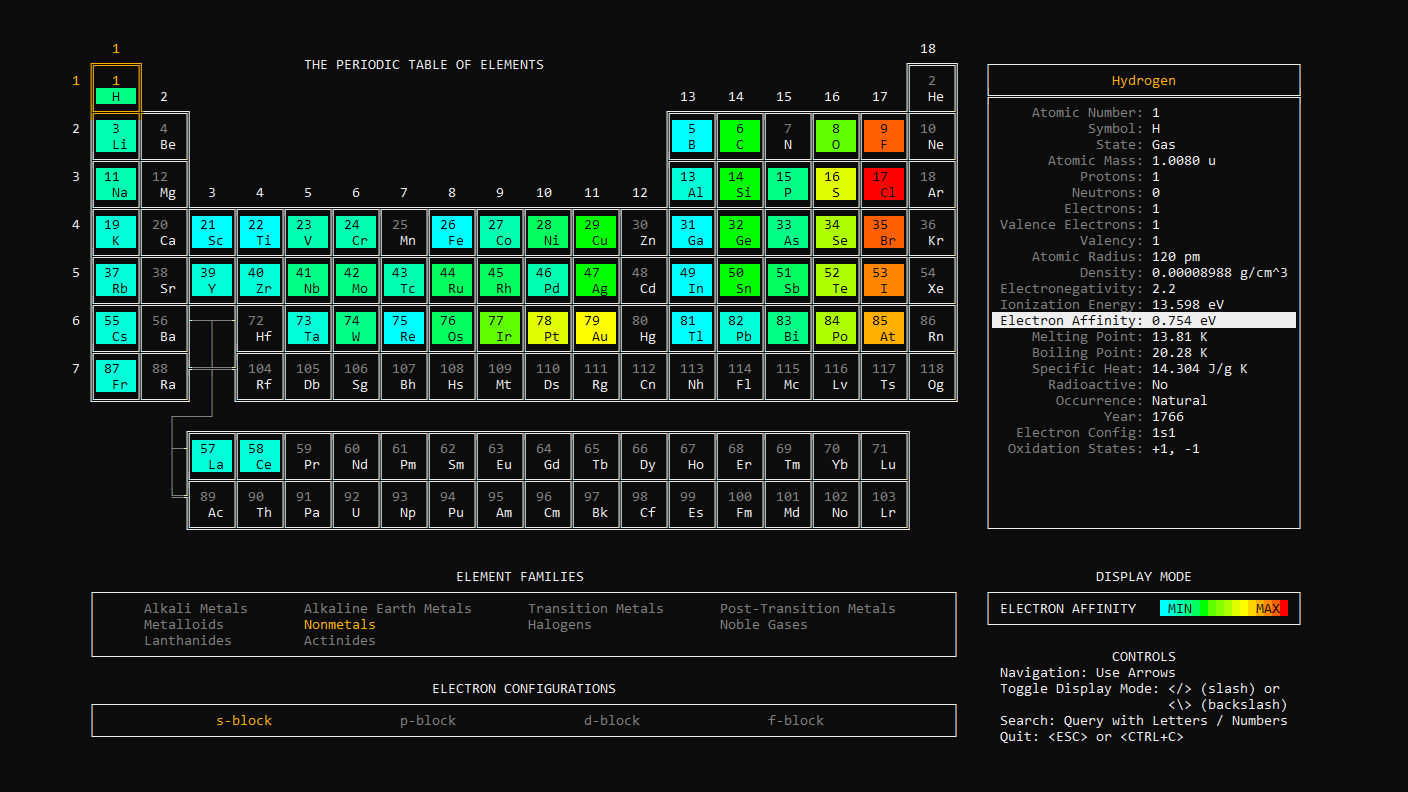
Electron Affinity
Display a heat-map of electron affinity (increasing from blue to red):
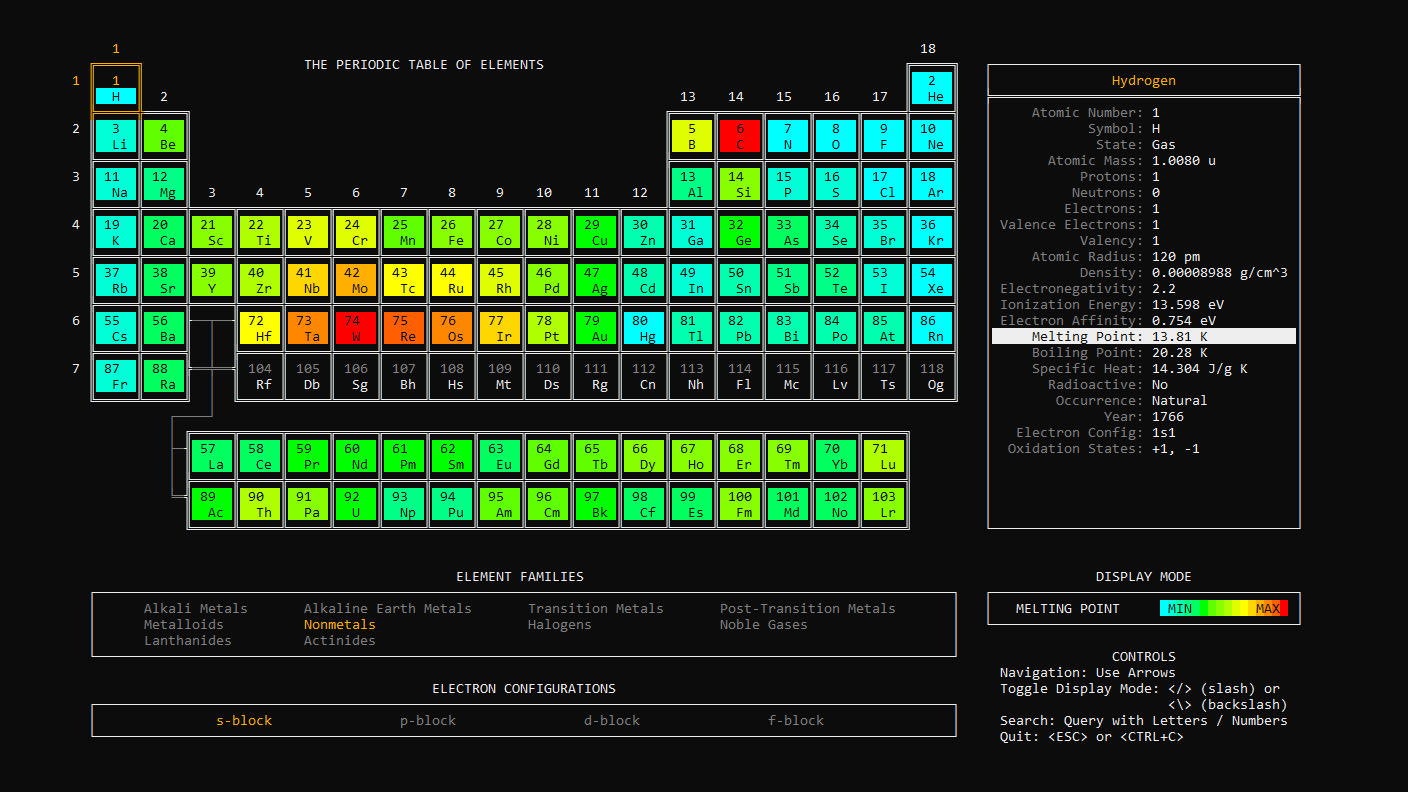
Melting Point
Display a heat-map of melting point (increasing from blue to red):
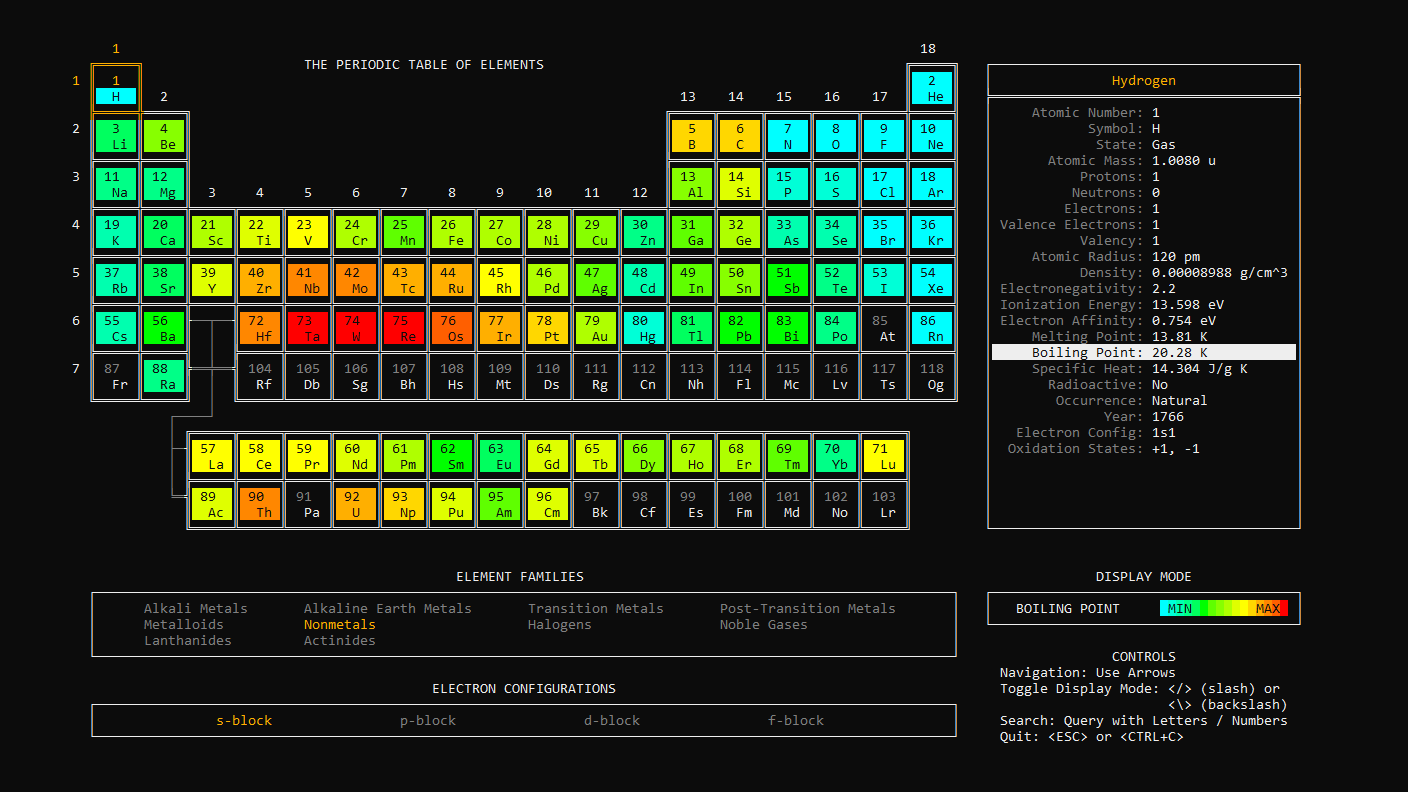
Boiling Point
Display a heat-map of boiling point (increasing from blue to red):
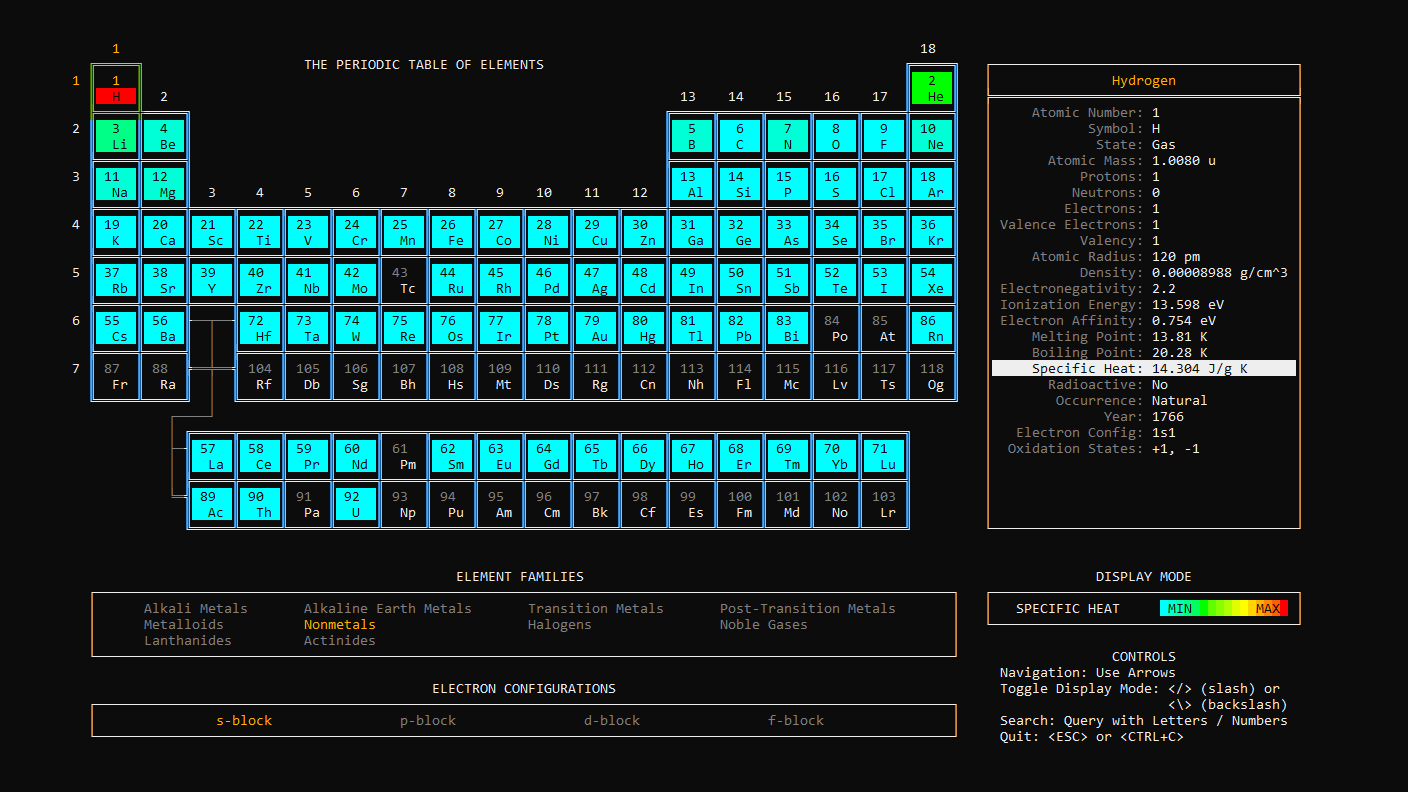
Specific Heat
Display a heat-map of specific heat (increasing from blue to red):
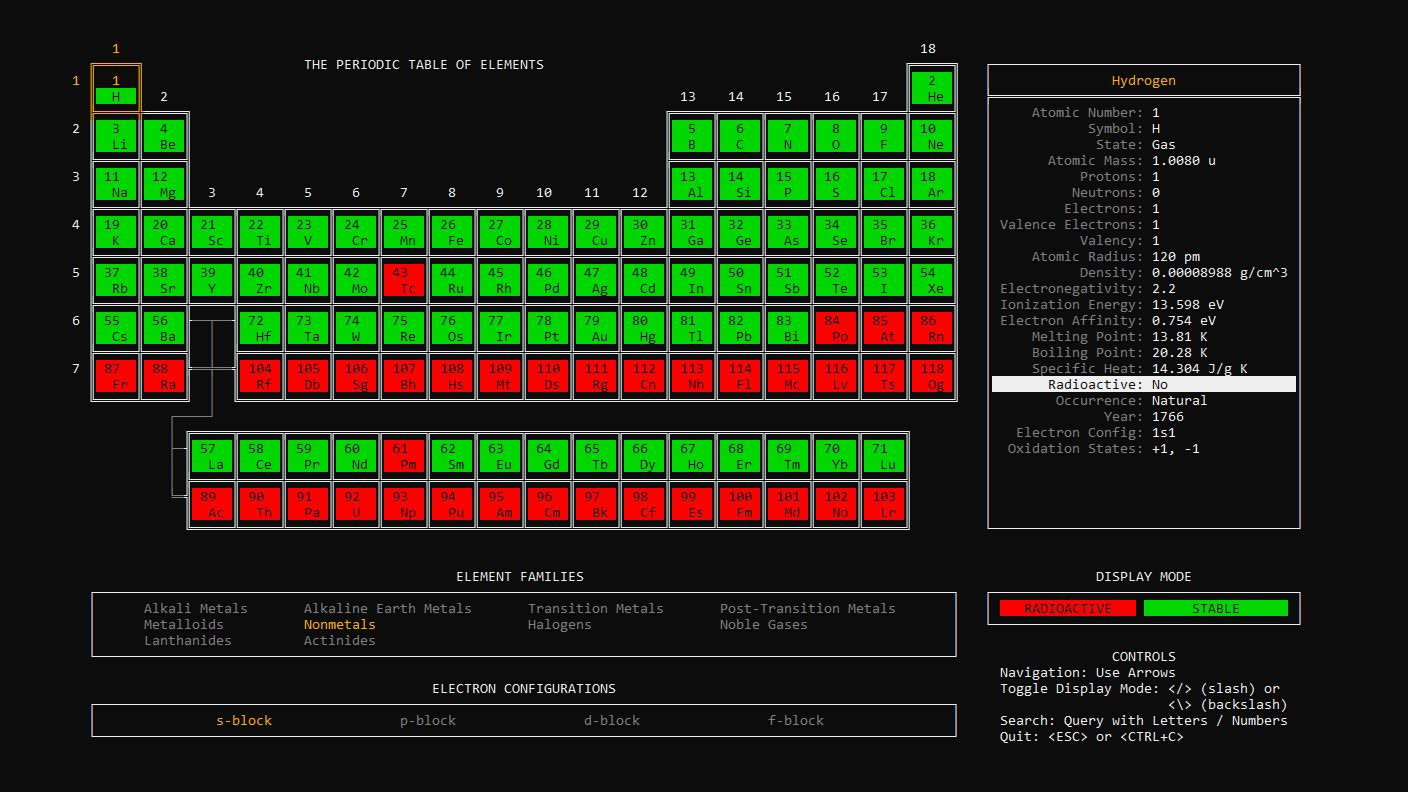
Radioactivity
Display which elements are radioactive (red) and stable (green):
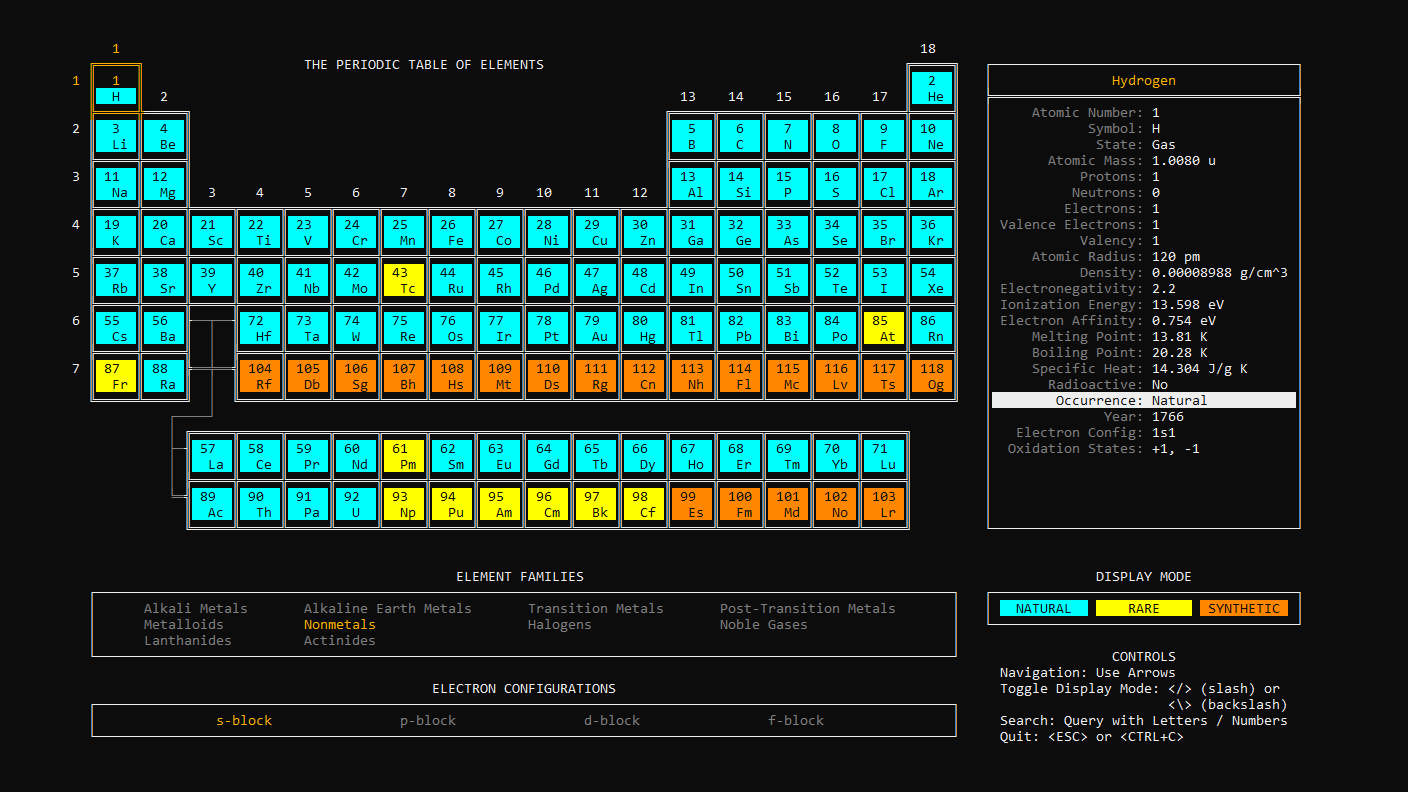
Occurrence
Display which elements have a natural occurrence (blue), rare occurrence (orange), or artificial occurrence (yellow):
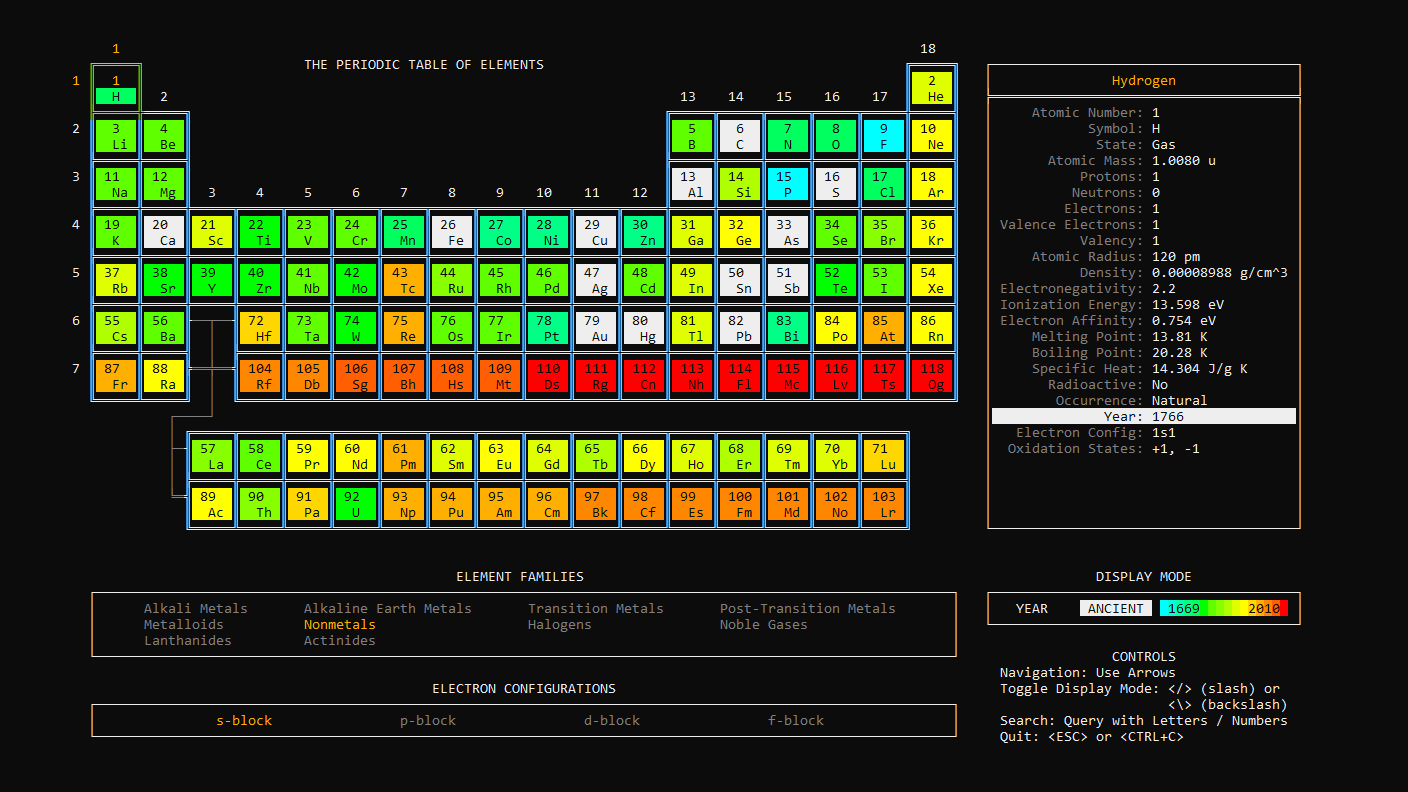
Year
Display a heat-map of the year each element was discovered (increasing from blue to red). Ancient elements appear in white:
Options
Data Mode
The --mode=data param displays a brief list of all the elements, including atomic number, element symbol, and element name:
$ periodic-table-cli --mode=data

Verbose
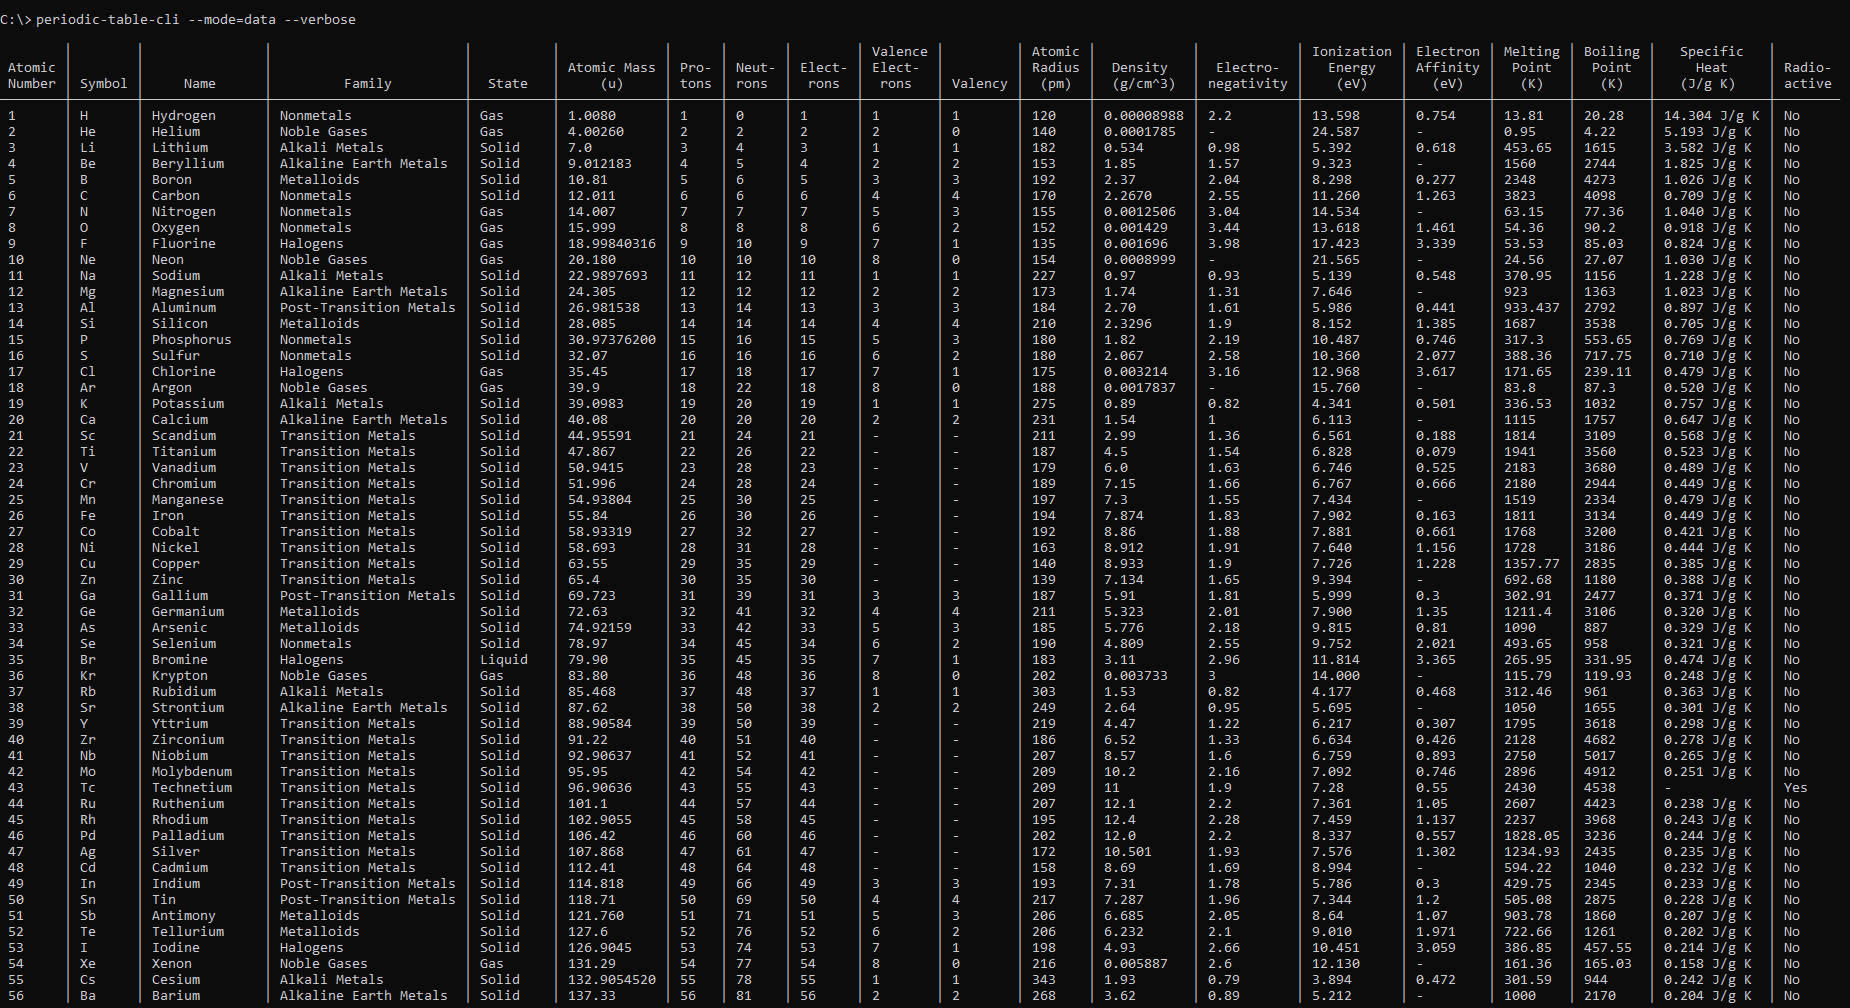
Add the optional --verbose flag (or shorthand -v) to display a detailed list of all elements with up to 27 data columns (limited by screen size):
$ periodic-table-cli --mode=data --verbose
Specific Elements
Specify an element to view data for that element. Elements can be specified using the --atomic-number=<number>, --symbol=<symbol>, or --name=<name> params:
$ periodic-table-cli --mode=data --atomic-number=<number>
$ periodic-table-cli --mode=data --symbol=<symbol>
$ periodic-table-cli --mode=data --name=<name>
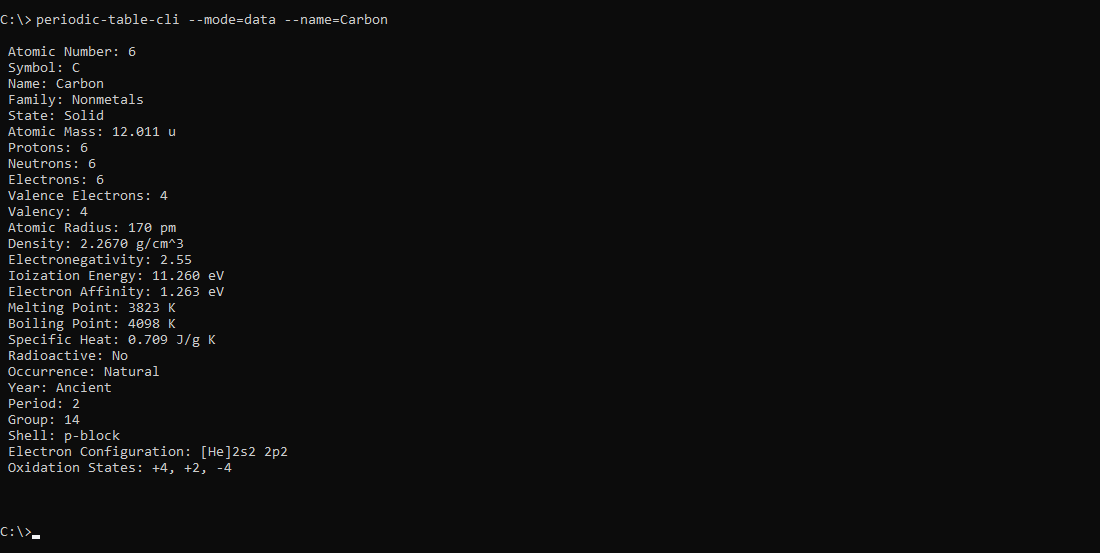
Chart Mode
The --mode=chart param prints a non-interactive Periodic Table of Elements:
$ periodic-table-cli --mode=chart

Minimum terminal width: 113 characters
Small
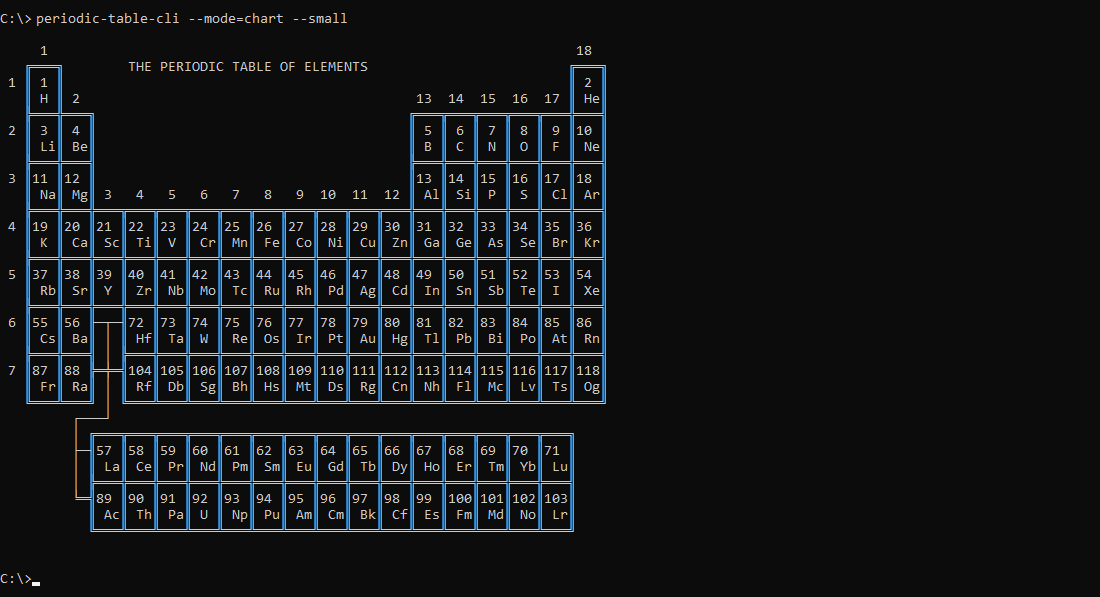
Add the optional --small flag (or shorthand -s) to print a smaller non-interactive version of the Periodic Table of Elements:
$ periodic-table-cli --mode=chart --small
Minimum terminal width: 76 characters
Specific Elements
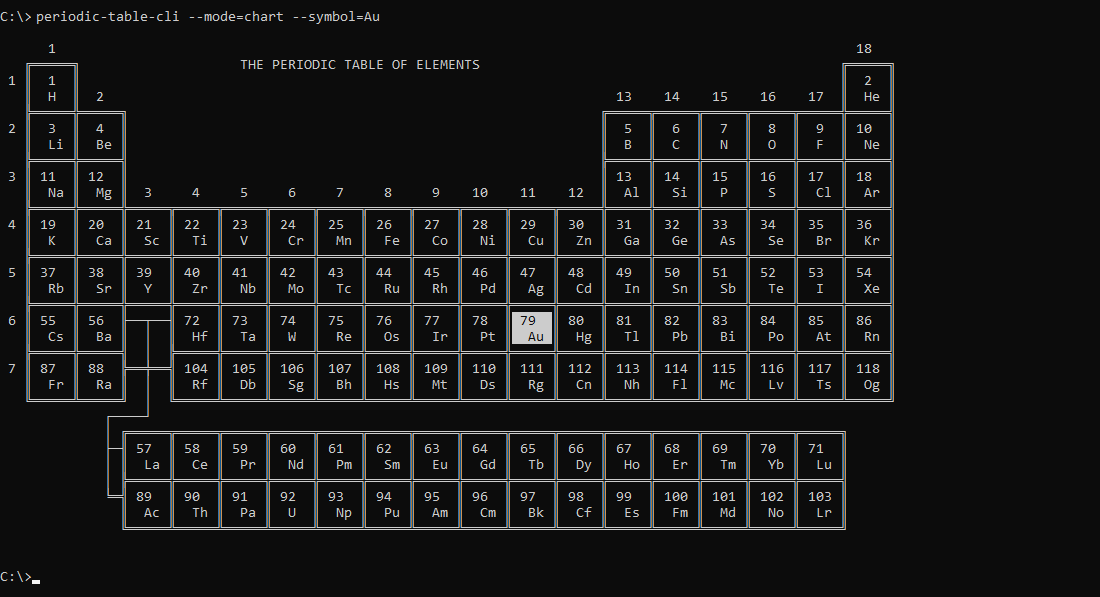
Specify an element to view that element on the Periodic Table of Element. Elements can be specified using the --atomic-number=<number>, --symbol=<symbol>, or --name=<name> params:
$ periodic-table-cli --mode=chart --atomic-number=<number>
$ periodic-table-cli --mode=chart --symbol=<symbol>
$ periodic-table-cli --mode=chart --name=<name>
App Mode (default)
The --mode=app param runs the app in interactive mode (default).
$ periodic-table-cli --mode=app
Specific Elements
Specify an element to launch the app on that element. Elements can be specified using the --atomic-number=<number>, --symbol=<symbol>, or --name=<name> params:
$ periodic-table-cli --mode=app --atomic-number=<number>
$ periodic-table-cli --mode=app --symbol=<symbol>
$ periodic-table-cli --mode=app --name=<name>
Scrolling
The minimum required terminal screen dimensions are 156 columns x 46 rows. When using a smaller screen, some components may be cut off. To fix this, either make the screen bigger or use scrolling to pan across the screen:
- Use
COMMA(,) to scroll up. - Use
PERIOD(.) to scroll down. - Use
LEFT CARROT(<) to scroll left. - Use
RIGHT CARROT(>) to scroll right.
Data Sources
Data used in the app is stored in an easy to edit data file. The data is mostly imported from PubChem.
Last Updated February 2024


