Awesome
@jupyterlab/debugger
Archived
This project is archived. Development is now happening in https://github.com/jupyterlab/jupyterlab.
If you use JupyterLab 3.x:
The debugger extension is shipped by default with JupyterLab 3.x and doesn't need to be installed manually.
Be sure to install a kernel that supports debugging, such as xeus-python:
conda install -c conda-forge xeus-python
Refer to the documentation for more details: https://jupyterlab.readthedocs.io/en/latest/user/debugger.html
Please open new issues and pull requests on the JupyterLab repo: https://github.com/jupyterlab/jupyterlab
If you use JupyterLab 2.x:
Follow the instructions below.
![]()
![]()
A JupyterLab debugger UI extension. This extension is under active development.

Prerequisites
- JupyterLab 2.0+
- xeus-python 0.8.0+
- notebook 6+
Installation
A kernel with support for debugging is required to be able to use the debugger.
It is generally recommended to create a new conda environment to install the dependencies:
conda create -n jupyterlab-debugger -c conda-forge xeus-python=0.8.6 notebook=6 jupyterlab=2 ptvsd nodejs
conda activate jupyterlab-debugger
Then, run the following command to install the extension:
jupyter labextension install @jupyterlab/debugger
Usage
For now xeus-python is the only Jupyter kernel that supports debugging. xeus-python can be selected from the JupyterLab launcher:
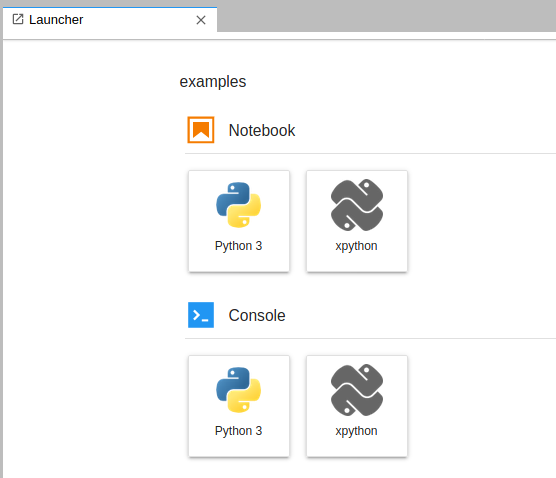
Alternatively, it is also possible to switch to the xpython kernel using the kernel selection dialog:
Enable the debugger, set breakpoints and step into the code:
Development
# Create a new conda environment
conda create -n jupyterlab-debugger -c conda-forge nodejs xeus-python=0.8.6 ptvsd jupyterlab=2

# Activate the conda environment
conda activate jupyterlab-debugger

# Install dependencies
jlpm

# Build TypeScript source
jlpm build

# Link your development version of the extension with JupyterLab
jupyter labextension link .

# Rebuild TypeScript source after making changes
jlpm build

# Rebuild JupyterLab after making any changes
jupyter lab build

# Start JupyterLab with the kernel logs enabled and watch mode enabled
XEUS_LOG=1 jupyter lab --no-browser --watch
Tests
To run the tests:
# [Optional] to enable the logs for xeus-python
export XEUS_LOG=1

jlpm run test
To run tests for a specific test suite name:
jlpm run test --testNamePattern=<regex>
To run tests for a specific test module name:
jlpm run test --testPathPattern=<regex>
Inspecting debug messages
The kernelspy extension for JupyterLab can be used to inspect the debug messages sent between the debugger UI and the kernel.
To install it:
jupyter labextension install jupyterlab-kernelspy
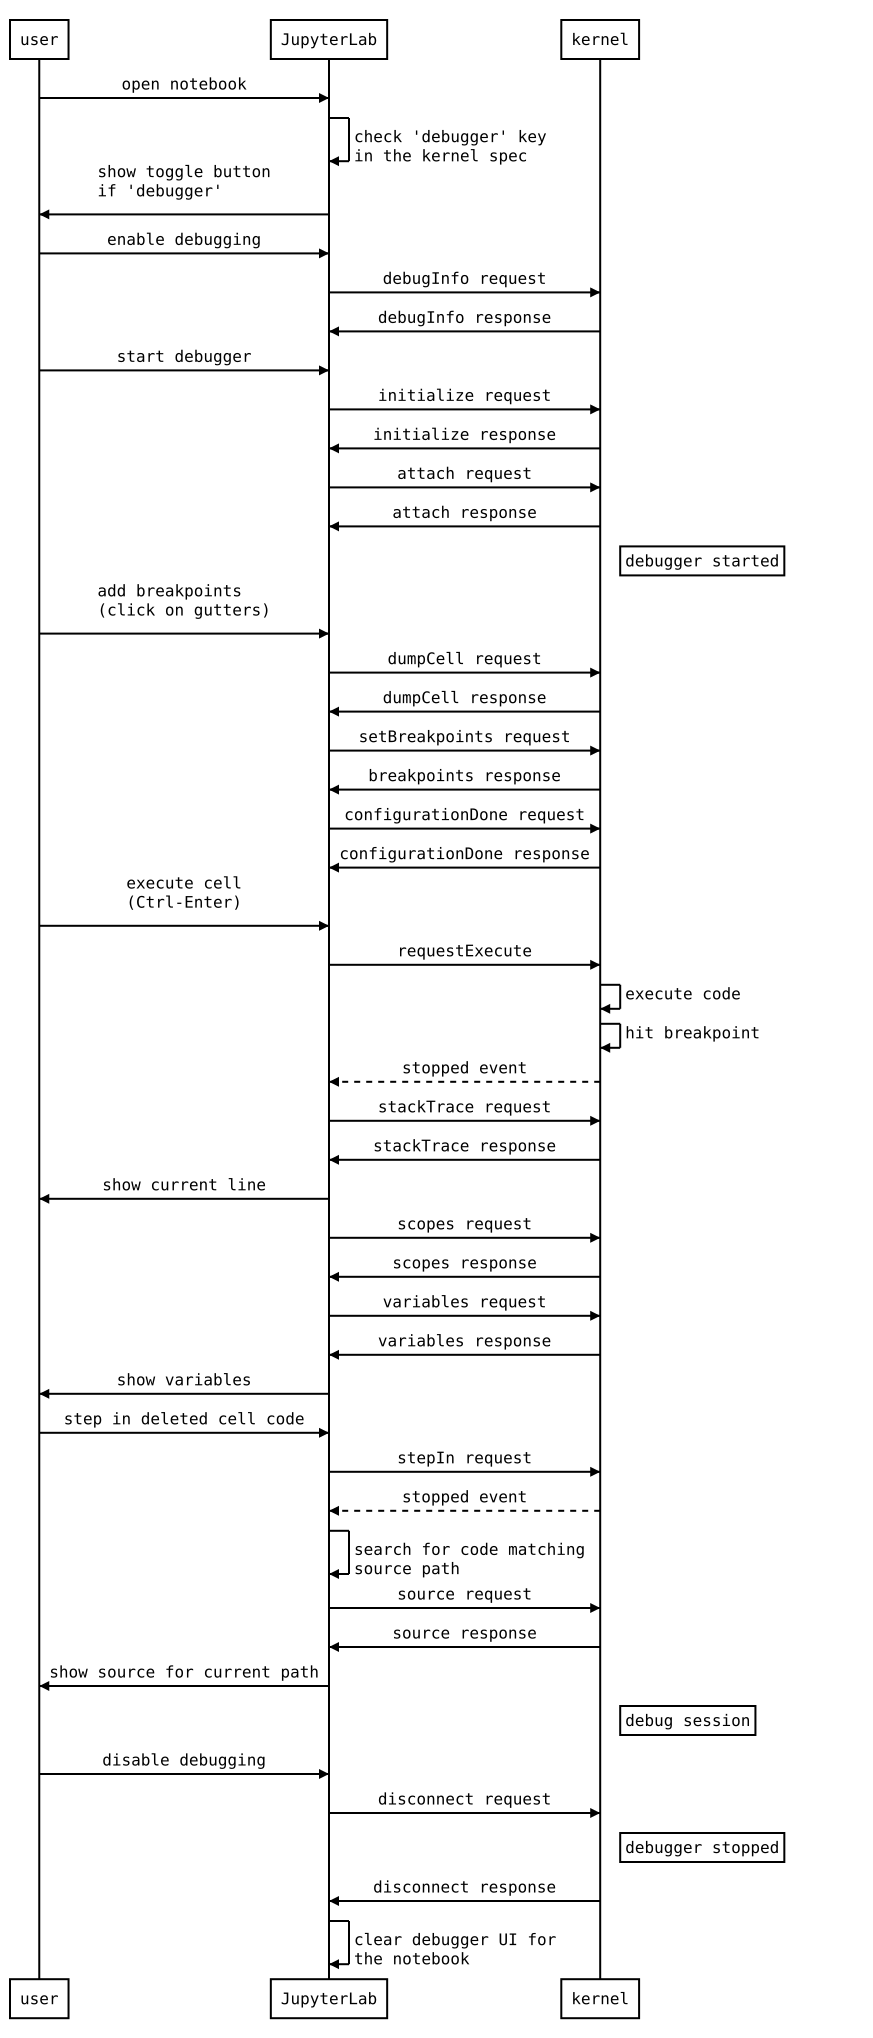
Debug Protocol Overview
The following diagram illustrates the types of messages sent between the JupyterLab extension and the kernel.
Diagram
References
- Dump cell and state restoration: https://github.com/jupyterlab/debugger/issues/52
- Protocol Overview: https://microsoft.github.io/debug-adapter-protocol/overview
- Specification: https://microsoft.github.io/debug-adapter-protocol/specification
Source
Generated using: https://bramp.github.io/js-sequence-diagrams/
<details><summary>Diagram source</summary> <pre> user->JupyterLab: open notebookJupyterLab->JupyterLab: check 'debugger' key\nin the kernel spec
JupyterLab->user: show toggle button\nif 'debugger'
user->JupyterLab: enable debugging
JupyterLab->kernel: debugInfo request
kernel->JupyterLab: debugInfo response
user->JupyterLab: start debugger
JupyterLab->kernel: initialize request
kernel->JupyterLab: initialize response
JupyterLab->kernel: attach request
kernel->JupyterLab: attach response
Note right of kernel: debugger started
user->JupyterLab: add breakpoints\n(click on gutters)
JupyterLab->kernel: dumpCell request
kernel->JupyterLab: dumpCell response
JupyterLab->kernel: setBreakpoints request
kernel->JupyterLab: breakpoints response
JupyterLab->kernel: configurationDone request
kernel->JupyterLab: configurationDone response
user->JupyterLab: execute cell\n(Ctrl-Enter)
JupyterLab->kernel: requestExecute
kernel->kernel: execute code
kernel->kernel: hit breakpoint
kernel-->JupyterLab: stopped event
JupyterLab->kernel: stackTrace request
kernel->JupyterLab: stackTrace response
JupyterLab->user: show current line
JupyterLab->kernel: scopes request
kernel->JupyterLab: scopes response
JupyterLab->kernel: variables request
kernel->JupyterLab: variables response
JupyterLab->user: show variables
user->JupyterLab: step in deleted cell code
JupyterLab->kernel: stepIn request
kernel-->JupyterLab: stopped event
JupyterLab->JupyterLab: search for code matching\nsource path
JupyterLab->kernel: source request
kernel->JupyterLab: source response
JupyterLab->user: show source for current path
Note right of kernel: debug session
user->JupyterLab: disable debugging
JupyterLab->kernel: disconnect request
Note right of kernel: debugger stopped
kernel->JupyterLab: disconnect response
JupyterLab->JupyterLab: clear debugger UI for\nthe notebook
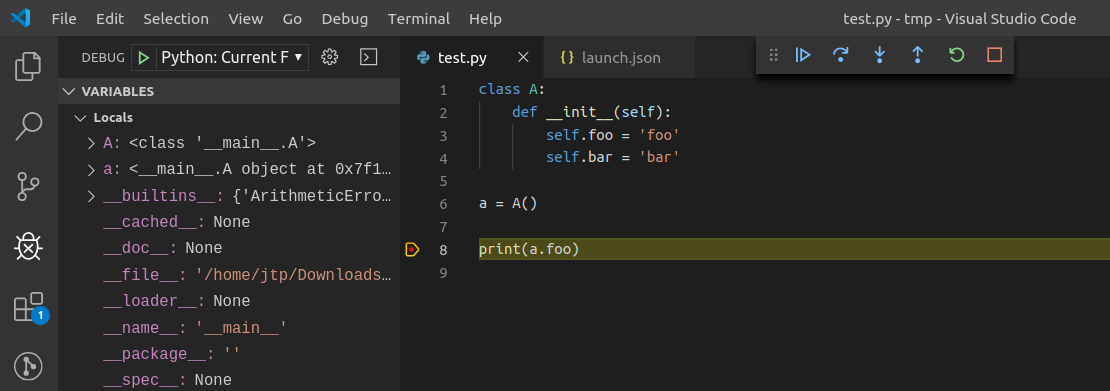
</pre> </details>Inspecting Debug Messages in VS Code
Inspecting the debug messages in VS Code can be useful to understand when debug requests are made (for example triggered by a UI action), and to compare the behavior of the JupyterLab debugger with the Python debugger in VS Code.
Create launch.json
The first step is to create a test file and a debug configuration:

{
  "version": "0.2.0",
  "configurations": [
    {
      "name": "Python: Current File",
      "type": "python",
      "request": "launch",
      "program": "${file}",
      "console": "integratedTerminal",
      "env": { "DEBUGPY_LOG_DIR": "/path/to/logs/folder" }
    }
  ]
}
Start the debugger
Open the logs
The content of the log file look like this:
...

D00000.032: IDE --> {
                "command": "initialize",
                "arguments": {
                    "clientID": "vscode",
                    "clientName": "Visual Studio Code",
                    "adapterID": "python",
                    "pathFormat": "path",
                    "linesStartAt1": true,
                    "columnsStartAt1": true,
                    "supportsVariableType": true,
                    "supportsVariablePaging": true,
                    "supportsRunInTerminalRequest": true,
                    "locale": "en-us"
                },
                "type": "request",
                "seq": 1
            }

...
With:
IDE= VS CodePYD= pydev debugger- Messages follow the DAP: https://microsoft.github.io/debug-adapter-protocol/specification
Overview