Awesome
microprofile 
This is a fork of microprofile by Jonas Meyer. This library has diverged from upstream.
Using the upstream version is recommended as this fork will no longer be maintained.
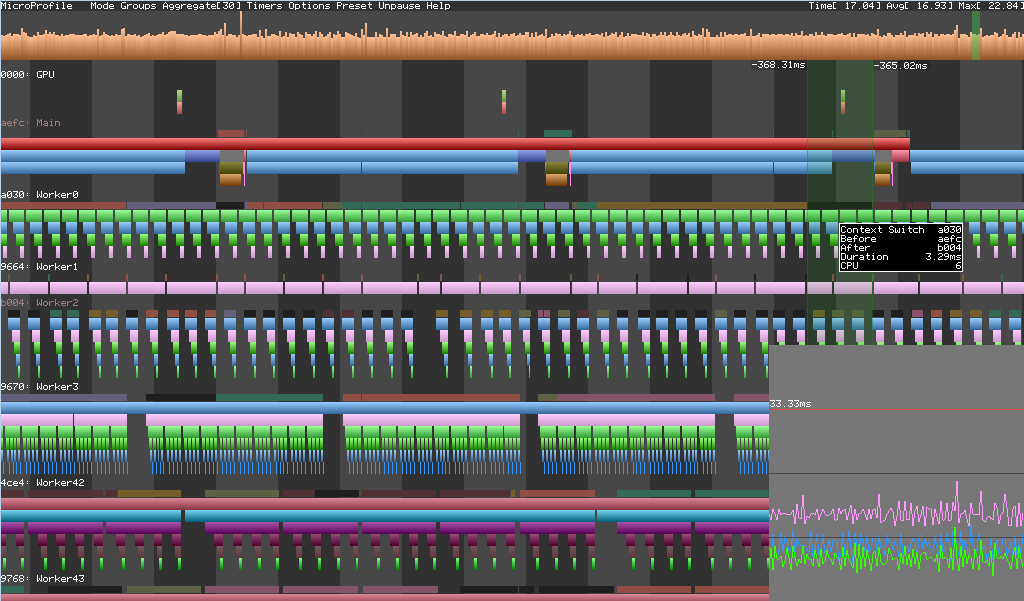
microprofile is an embeddable CPU/GPU profiler with an in-app and HTML visualizers.

Features
- Hierarchical regions for timing sections of the code
- Labels for adding extra information in the form of strings to regions
- GPU regions (D3D11/D3D12/GL/VK) with GPU timestamp synchronization
- Counters for measuring various global values that change over time
- Graphing any region or counter in real-time to observe differences over time
- Visualization using in-game UI, a web browser (buit-in server) or an HTML file
- Low overhead
Platform support
microprofile is known to work on Windows XP and above, Linux, OSX, iOS, Android and Xbox One.
It should be easy to adapt to support any other platforms; pull requests are welcome!
Difference from upstream
This library has been forked from upstream in 2015 - back when upstream was using Bitbucket/Mercurial - and has diverged over time from upstream; the difference in priorities for features led to the divergence not really converging, so treat this as a permanent fork.
The list of features that have not been backported from upstream (as of October 2018):
- WebSocket-based live connection that displays graphs and allows to start the frame capture
- Timelines that can be useful for profiling long running code such as level loading
- Support for more than 48 categories
The list of features that this fork has but upstream doesn't (as of October 2018):
- On-screen UI support that can use OpenGL or any other rendering backend for rendering (upstream removed this in 2017)
- On-screen UI support for "Frame" display mode that only shows the frame bar, to allow for easier detection of spikes without obstructing gameplay
- Unified nomenclature between on-screen UI and web UI - the same information is consistently displayed in both, with the same names
- Support for dynamic strings (labels) that are displayed inside of scopes and can use printf-style format strings
- Automatic color selection based on scope name hash (you can use -1 instead of color value everywhere)
- Unified CPU/GPU scopes - MicroProfileEnter/MicroProfileLeave/etc. automatically determine whether the group is CPU or GPU
- Reworked dtrace based context switch visualization on OSX (higher performance, better time synchronization)
- Completely reworked GPU timing implementation, with support for GL on OSX as well as Vulkan, D3D12, D3D11 on other platforms (upstream now also supports Vulkan via a separate implementation)
- GPU backends can be chosen dynamically - you can compile support for D3D11, D3D12, OpenGL and Vulkan in (or any selection thereof) and dynamically initialize just one at some point later.
- Substantially improved web server performance (web server runs in a dedicated thread, creating the HTML dump is several times faster)
- A lot of robustness fixes for edge cases, overflow conditions, GPU timing issues etc. - this fork should be safe to enable in production builds.
- Reduce profiler memory overhead when no groups are captured by lazily allocating most large buffers
- iOS and Android support
This library ships in Roblox client and editor for all platforms, compiled in (with profiler not capturing data by default but working in on-screen or web-server mode depending on the platform) for all users.