Awesome
<h1 align="center"> ggplot Wizardry:<br>My Favorite Tricks and Secrets for Beautiful Plots in R </h1> <div align="center"><a href="https://www.cedricscherer.com"><img border="0" alt="Blog" src="https://assets.dryicons.com/uploads/icon/svg/4926/home.svg" width="35" height="35"></a> <a href="mailto:hello@cedricscherer.com"><img border="0" alt="Email" src="https://assets.dryicons.com/uploads/icon/svg/8009/02dc3a5c-6504-4347-85fb-3f510cfecc45.svg" width="35" height="35"></a> <a href="https://twitter.com/CedScherer"><img border="0" alt="Twitter" src="https://assets.dryicons.com/uploads/icon/svg/8385/c23f7ffc-ca8d-4246-8978-ce9f6d5bcc99.svg" width="35" height="35"></a> <a href="https://www.instagram.com/cedscherer/"><img border="0" alt="Instagram" src="https://assets.dryicons.com/uploads/icon/svg/8330/62263227-bb78-4b42-a9a9-e222e0cc7b97.svg" width="35" height="35"></a> <a href="https://www.behance.net/cedscherer"><img border="0" alt="Behance" src="https://assets.dryicons.com/uploads/icon/svg/8264/04073ce3-5b98-4f32-88d3-82b2ef828066.svg" width="35" height="35"></a> <a href="https://www.linkedin.com/in/cedscherer/"><img border="0" alt="LinkedIn" src="https://assets.dryicons.com/uploads/icon/svg/8337/a347cd89-1662-4421-be90-58e5e8004eae.svg" width="35" height="35"></a>
</div> <div align="center"> <br> <a href="https://www.buymeacoffee.com/z3tt" target="_blank"><img src="https://www.buymeacoffee.com/assets/img/guidelines/download-assets-sm-1.svg" alt="Buy Me A Coffee" style="height: 50px !important;width: 174px !important;box-shadow: 0px 3px 2px 0px rgba(190, 190, 190, 0.5) !important;-webkit-box-shadow: 0px 3px 2px 0px rgba(190, 190, 190, 0.5) !important;" ></a> <br><br> </div> <br>Slides and hands-on codes for my talk at the 1st OutlierConf, February 4–7 2021.

Talk Resources:
Bonus: Extended version!
About the talk:
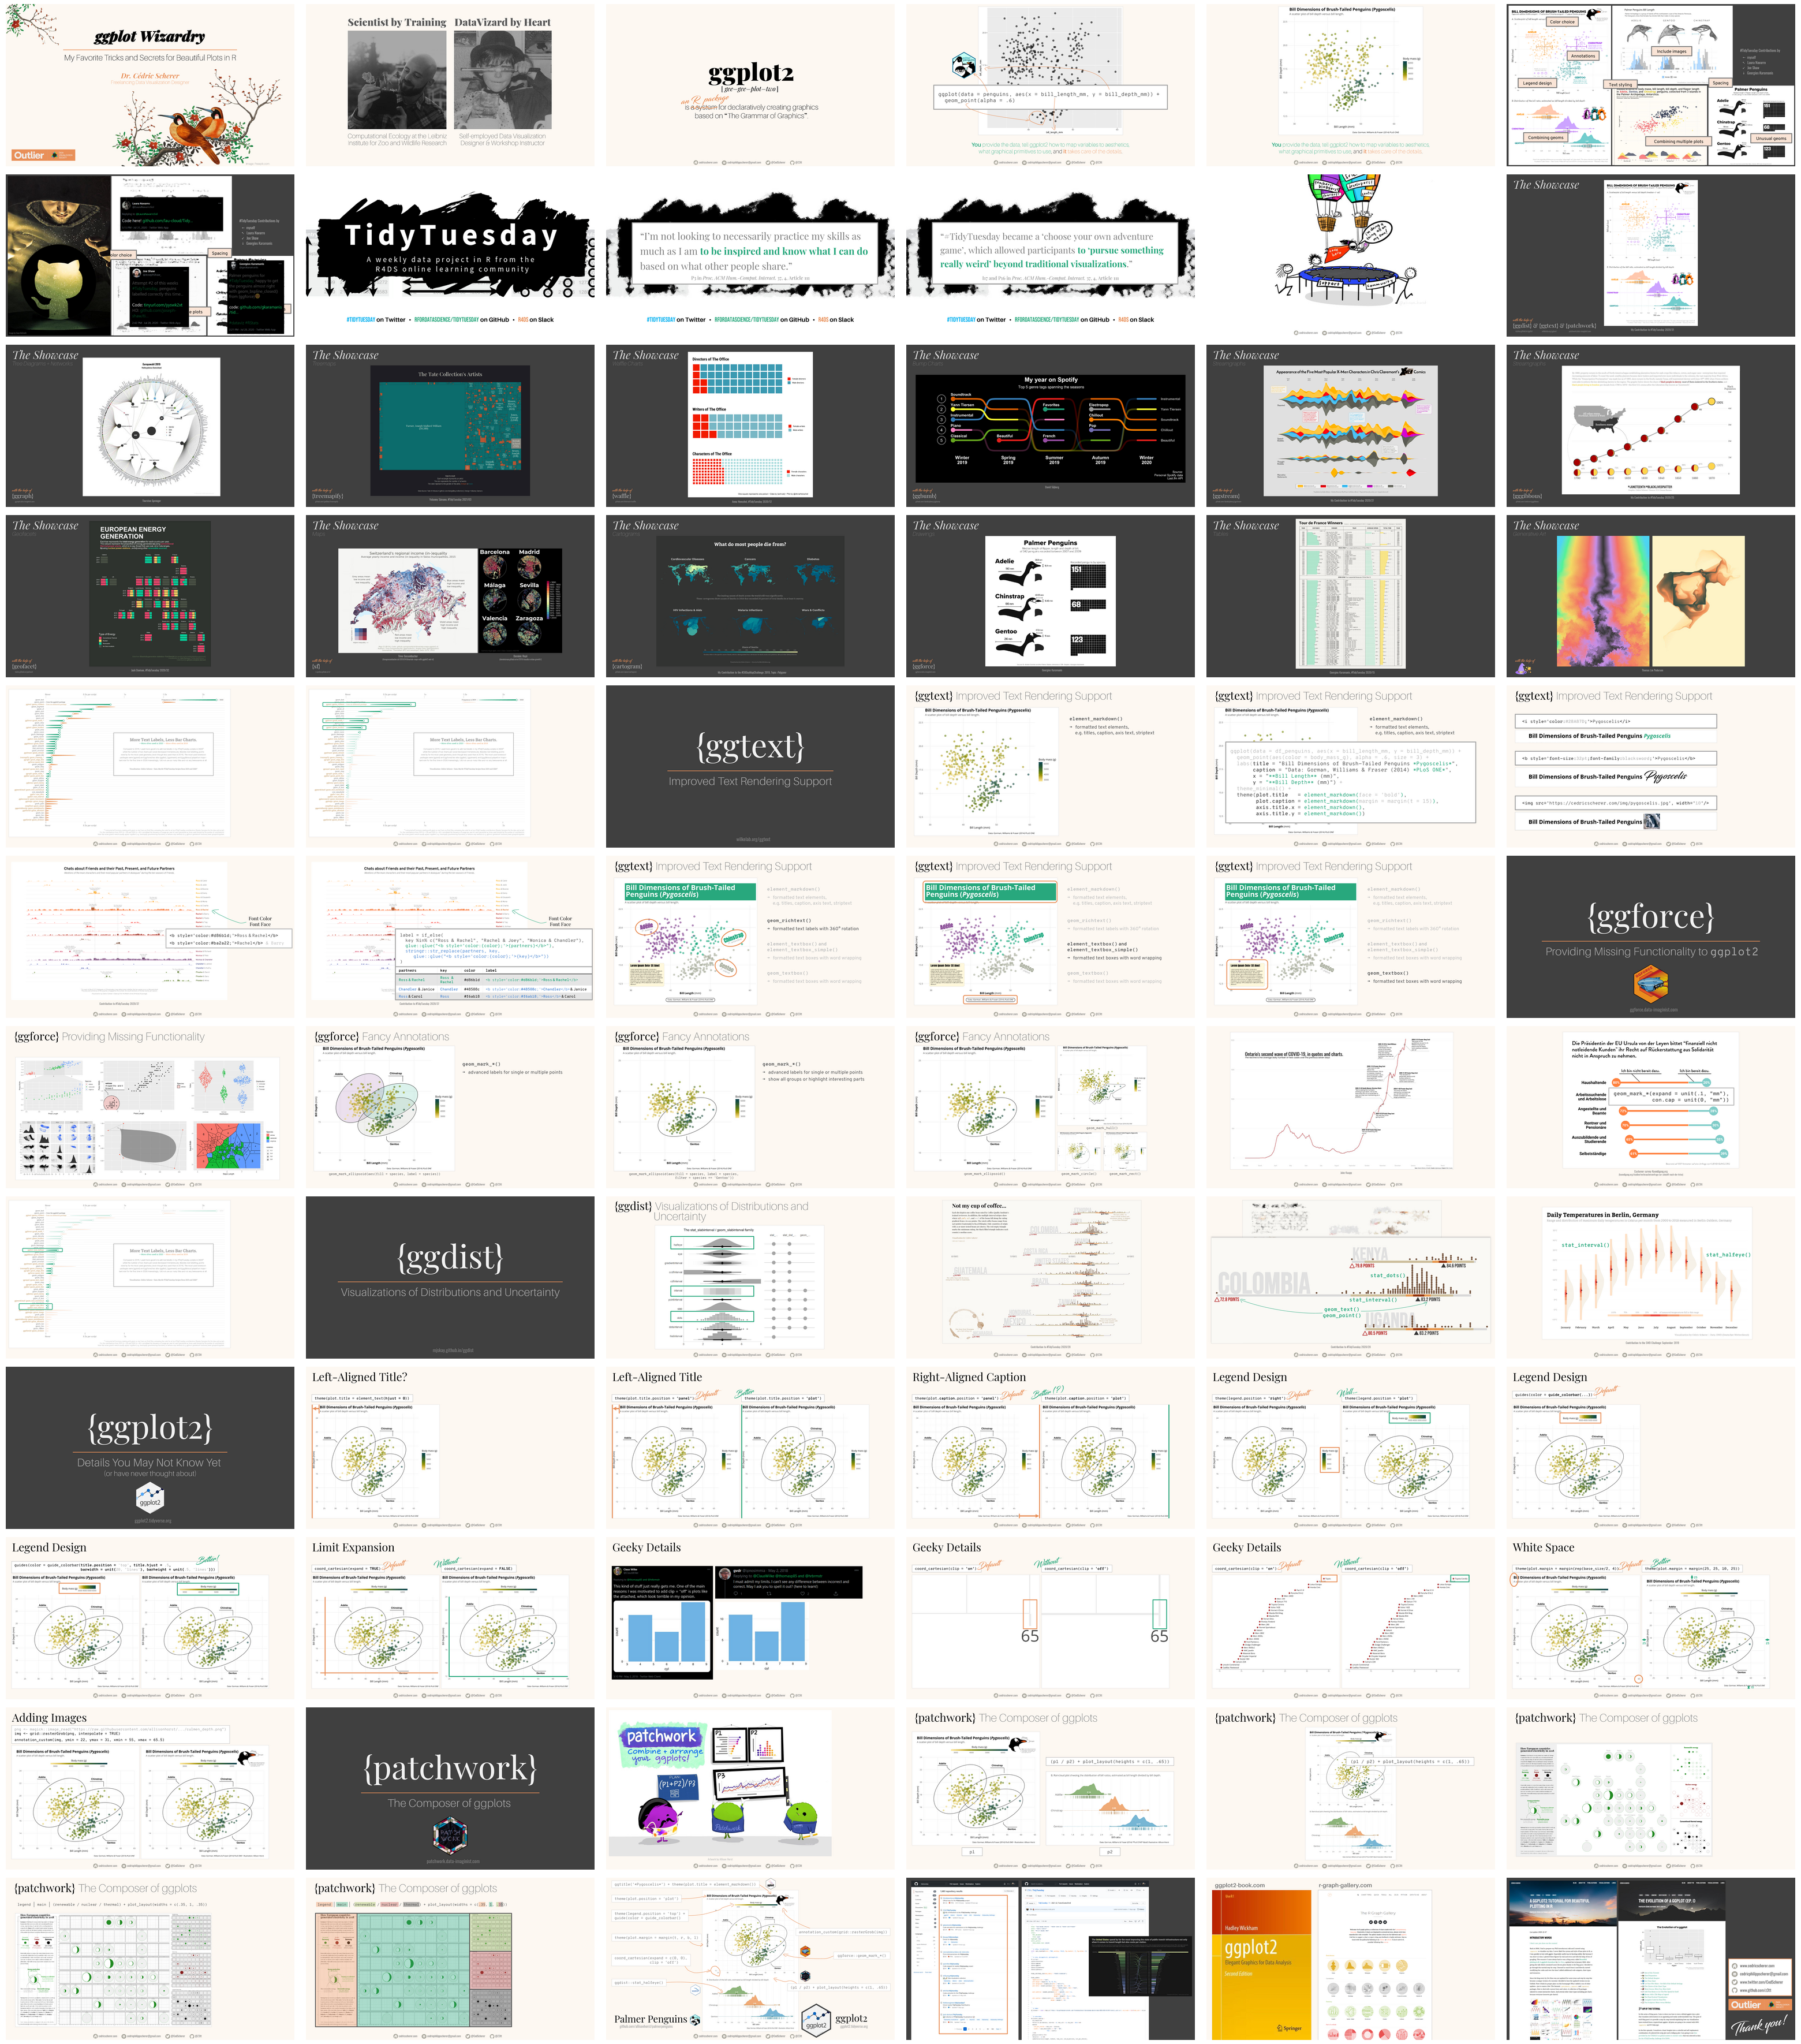
In this talk, I present my favorite tips and tricks with regard to the ggplot2 package, a library for plotting in the programming language R. I will cover functions that are helpful but many may not be aware of as well as a collection of interesting functions from a large range of extension packages.
The talk is intended for people who already know how to code in R and ggplot2. However, I am going to cover a diverse collection of tips so I hope everyone can pick something helpful independent from their level of expertise.

Further Resources:
- Intro to R (one of many good online tutorials)
- "R for Data Science" book (open-access)
- ggplot2 Book (open-access)
- R Graph Gallery
- My extensive ggplot2 tutorial
- My “Evolution of a ggplot” blog post
- #TidyTuesday project (#TidyTuesday on Twitter)
- My #TidyTuesday Contributions incl. all codes
- R4DS learning community (huge Slack community for people learning R incl. a mentoring program)
- Illustrations by Allison Horst (more general about data and stats + R-related)
- R Packages mentioned:
<h4>Attribution-NonCommercial-ShareAlike 4.0 International (CC BY-NC-SA 4.0)</h4> <div style="width:300px; height:200px"> <img src=https://camo.githubusercontent.com/00f7814990f36f84c5ea74cba887385d8a2f36be/68747470733a2f2f646f63732e636c6f7564706f7373652e636f6d2f696d616765732f63632d62792d6e632d73612e706e67 alt="" height="42"> </div>