Awesome
ThreadTracer
Summary
Lightweight inline profiler that measures wall-time, cpu-time and premptive context switches for threads.
Features
ThreadTracer is an inline profiler that is special in the following ways:
- Fully supports multi threaded applications.
- Will never cause your thread to go to sleep because of profiling.
- Will not miss events.
- Will detect if threads were context-switched by scheduler, preemptively or voluntarily.
- Computes duty-cycle for each scope: not just how long it ran, but also how much of that time, it was scheduled on a core.
- Small light weight system, written in C. Just one header and one small implementation file.
- Zero dependencies.
Limitations
- Doesn't show a live profile, but creates a report after the run, viewable with Google Chrome.
- Currently does not support asynchronous events that start on one thread, and finish on another.
Usage
#include <threadtracer.h>

// Each thread that will be generating profiling events needs to be made known to the system.
// If you sign in with threadid TT_CALLING_THREAD, the threadid of calling thread will be used.

tt_signin( TT_CALLING_THREAD, "mainthread" );

// C Programs need to wrap sections of code with a begin and end macro.

TT_BEGIN( "simulation" );
simulate( dt );
TT_END( "simulation" );

// C++ can also use a scoped tag. Event automatically ends when it goes out of scope.
void draw_all(void)
{
	TT_SCOPE( "draw" );
	draw_world();
	if ( !overlay )
		return;
	draw_info();
}

// When you are done profiling, typically at program end, or earlier, you can generate the profile report.

tt_report(NULL);
Platforms
ThreadTracer has been tested on:
- Linux amd64
- Linux x86
- Linux RISCV
- FreeBSD amd64
Building
Just add threadtracer.c to your project, and compile your sources with -D_GNU_SOURCE flag so that RUSAGE_THREAD support is available for the getrusage() call.
Viewing the report
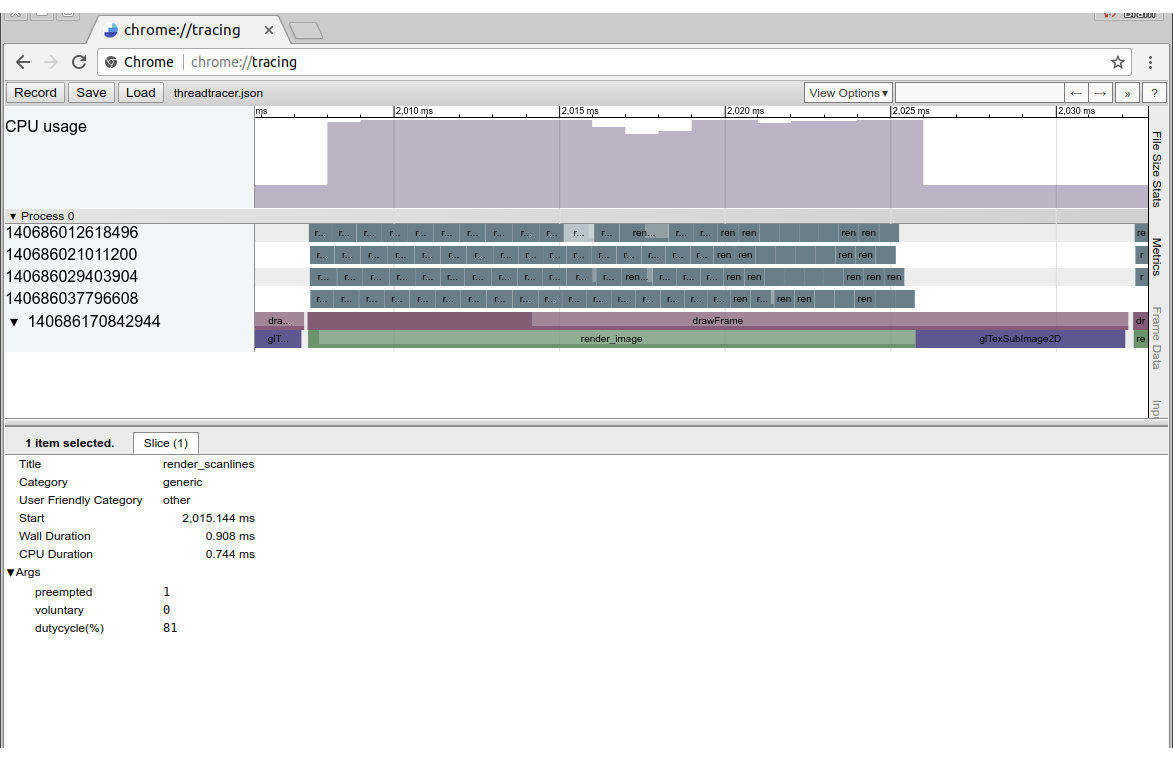
Start the Google Chrome browser, and in the URL bar, type chrome://tracing and then load the genererated threadtracer.json file.

Note that for the highlighted task, the detail view shows that the thread got interrupted once preemptively, which causes it to run on a CPU core for only 81% of the time that the task took to complete.
The shading of the time slices shows the duty cycle: how much of the time was spend running on a core.
Skipping samples at launch.
To avoid recording samples right after launch, you can skip the first seconds of recording with an environment variable. To skip the first five seconds, do:
$ THREADTRACERSKIP=5 ./foo
ThreadTracer: clock resolution: 1 nsec.
ThreadTracer: skipping the first 5 seconds before recording.
ThreadTracer: Wrote 51780 events (6 discarded) to threadtracer.json
Acknowledgements
- chrome://tracing for their excellent in-browser visualization.
- Remotery and Minitrace! for the inspiration, and showing how powerful inline profiling can be.
- Frogtoss for contributing and testing.