Awesome
<p align="center"> <a href="https://github.com/nschloe/dmsh"><img alt="dmsh" src="https://raw.githubusercontent.com/meshpro/dmsh/main/logo/logo-with-text.svg" width="50%"></a> <p align="center">The worst mesh generator you'll ever use.</p> </p>Inspired by distmesh, dmsh can be slow, requires a lot of memory, and isn't terribly robust either.
On the plus side,
- it's got a user-friendly interface,
- is pure Python (and hence easily installable on any system), and
- it produces pretty high-quality meshes.
Combined with optimesh, dmsh produces the highest-quality 2D meshes in the west.
Examples
Primitives
| <img alt="circle" src="https://raw.githubusercontent.com/meshpro/dmsh/main/plots/circle.svg" width="100%"> | <img alt="circle" src="https://raw.githubusercontent.com/meshpro/dmsh/main/plots/rectangle.svg" width="100%"> | <img alt="circle" src="https://raw.githubusercontent.com/meshpro/dmsh/main/plots/polygon.svg" width="100%"> |
|---|
import dmsh
import meshio
import optimesh

geo = dmsh.Circle([0.0, 0.0], 1.0)
X, cells = dmsh.generate(geo, 0.1)

# optionally optimize the mesh
X, cells = optimesh.optimize_points_cells(X, cells, "CVT (full)", 1.0e-10, 100)

# visualize the mesh
dmsh.show(X, cells, geo)

# and write it to a file
meshio.Mesh(X, {"triangle": cells}).write("circle.vtk")
import dmsh

geo = dmsh.Rectangle(-1.0, +2.0, -1.0, +1.0)
X, cells = dmsh.generate(geo, 0.1)
import dmsh

geo = dmsh.Polygon(
    [
        [0.0, 0.0],
        [1.1, 0.0],
        [1.2, 0.5],
        [0.7, 0.6],
        [2.0, 1.0],
        [1.0, 2.0],
        [0.5, 1.5],
    ]
)
X, cells = dmsh.generate(geo, 0.1)
Combinations
Difference
| <img src="https://raw.githubusercontent.com/meshpro/dmsh/main/plots/moon.svg" width="100%"> | <img src="https://raw.githubusercontent.com/meshpro/dmsh/main/plots/pacman.svg" width="100%"> | <img src="https://raw.githubusercontent.com/meshpro/dmsh/main/plots/rectangle-hole-refinement.svg" width="100%"> |
|---|
import dmsh

geo = dmsh.Circle([-0.5, 0.0], 1.0) - dmsh.Circle([+0.5, 0.0], 1.0)
X, cells = dmsh.generate(geo, 0.1)
import dmsh

geo = dmsh.Circle([0.0, 0.0], 1.0) - dmsh.Polygon([[0.0, 0.0], [1.5, 0.4], [1.5, -0.4]])
X, cells = dmsh.generate(geo, 0.1, tol=1.0e-10)
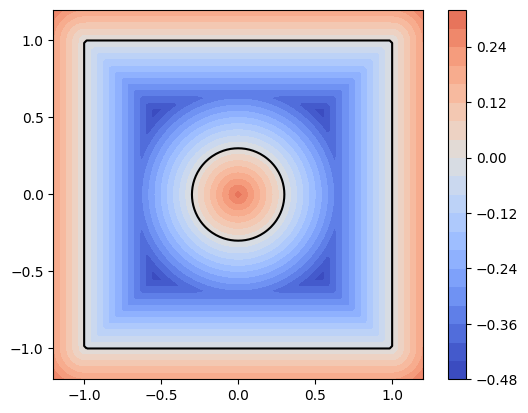
The following example uses a nonconstant edge length; it depends on the distance to the
circle c.
import dmsh
import numpy as np

r = dmsh.Rectangle(-1.0, +1.0, -1.0, +1.0)
c = dmsh.Circle([0.0, 0.0], 0.3)
geo = r - c

X, cells = dmsh.generate(geo, lambda pts: np.abs(c.dist(pts)) / 5 + 0.05, tol=1.0e-10)
Union
| <img src="https://raw.githubusercontent.com/meshpro/dmsh/main/plots/union-circles.svg" width="100%"> | <img src="https://raw.githubusercontent.com/meshpro/dmsh/main/plots/union-rectangles.svg" width="100%"> | <img src="https://raw.githubusercontent.com/meshpro/dmsh/main/plots/union-three-circles.svg" width="100%"> |
|---|
import dmsh

geo = dmsh.Circle([-0.5, 0.0], 1.0) + dmsh.Circle([+0.5, 0.0], 1.0)
X, cells = dmsh.generate(geo, 0.15)
import dmsh

geo = dmsh.Rectangle(-1.0, +0.5, -1.0, +0.5) + dmsh.Rectangle(-0.5, +1.0, -0.5, +1.0)
X, cells = dmsh.generate(geo, 0.15)
import dmsh
import numpy as np

angles = np.pi * np.array([3.0 / 6.0, 7.0 / 6.0, 11.0 / 6.0])
geo = dmsh.Union(
    [
        dmsh.Circle([np.cos(angles[0]), np.sin(angles[0])], 1.0),
        dmsh.Circle([np.cos(angles[1]), np.sin(angles[1])], 1.0),
        dmsh.Circle([np.cos(angles[2]), np.sin(angles[2])], 1.0),
    ]
)
X, cells = dmsh.generate(geo, 0.15)
Intersection
| <img src="https://raw.githubusercontent.com/meshpro/dmsh/main/plots/intersection-circles.svg" width="100%"> | <img src="https://raw.githubusercontent.com/meshpro/dmsh/main/plots/intersection-three-circles.svg" width="100%"> | <img src="https://raw.githubusercontent.com/meshpro/dmsh/main/plots/intersection-circle-halfspace.svg" width="100%"> |
|---|
import dmsh

geo = dmsh.Circle([0.0, -0.5], 1.0) & dmsh.Circle([0.0, +0.5], 1.0)
X, cells = dmsh.generate(geo, 0.1, tol=1.0e-10)
import dmsh
import numpy as np

angles = np.pi * np.array([3.0 / 6.0, 7.0 / 6.0, 11.0 / 6.0])
geo = dmsh.Intersection(
    [
        dmsh.Circle([np.cos(angles[0]), np.sin(angles[0])], 1.5),
        dmsh.Circle([np.cos(angles[1]), np.sin(angles[1])], 1.5),
        dmsh.Circle([np.cos(angles[2]), np.sin(angles[2])], 1.5),
    ]
)
X, cells = dmsh.generate(geo, 0.1, tol=1.0e-10)
The following uses the HalfSpace primtive for cutting off a circle.
import dmsh

geo = dmsh.HalfSpace([1.0, 1.0]) & dmsh.Circle([0.0, 0.0], 1.0)
X, cells = dmsh.generate(geo, 0.1)
Rotation, translation, scaling
| <img src="https://raw.githubusercontent.com/meshpro/dmsh/main/plots/rotation.svg" width="100%"> | <img src="https://raw.githubusercontent.com/meshpro/dmsh/main/plots/scaling.svg" width="100%"> |
|---|
import dmsh
import numpy as np

geo = dmsh.Rotation(dmsh.Rectangle(-1.0, +2.0, -1.0, +1.0), 0.1 * np.pi)
X, cells = dmsh.generate(geo, 0.1, tol=1.0e-10)
import dmsh

geo = dmsh.Rectangle(-1.0, +2.0, -1.0, +1.0) + [1.0, 1.0]
X, cells = dmsh.generate(geo, 0.1)
import dmsh

geo = dmsh.Rectangle(-1.0, +2.0, -1.0, +1.0) * 2.0
X, cells = dmsh.generate(geo, 0.1, tol=1.0e-5)
Local refinement
<img alt="local-refinement" src="https://raw.githubusercontent.com/meshpro/dmsh/main/plots/local-refinement.svg" width="30%">All objects can be used to refine the mesh according to the distance to the object;
e.g. a Path:
import dmsh

geo = dmsh.Rectangle(0.0, 1.0, 0.0, 1.0)

p1 = dmsh.Path([[0.4, 0.6], [0.6, 0.4]])


def target_edge_length(x):
    return 0.03 + 0.1 * p1.dist(x)


X, cells = dmsh.generate(geo, target_edge_length, tol=1.0e-10)
Custom shapes
It is also possible to define your own geometry. Simply create a class derived from
dmsh.Geometry that contains a dist method and a method to project points onto the
boundary.
import dmsh
import numpy as np


class MyDisk(dmsh.Geometry):
    def __init__(self):
        self.r = 1.0
        self.x0 = [0.0, 0.0]
        bounding_box = [-1.0, 1.0, -1.0, 1.0]
        feature_points = np.array([[], []]).T
        super().__init__(bounding_box, feature_points)

    def dist(self, x):
        assert x.shape[0] == 2
        y = (x.T - self.x0).T
        return np.sqrt(np.einsum("i...,i...->...", y, y)) - self.r

    def boundary_step(self, x):
        # project onto the circle
        y = (x.T - self.x0).T
        r = np.sqrt(np.einsum("ij,ij->j", y, y))
        return ((y / r * self.r).T + self.x0).T


geo = MyDisk()
X, cells = dmsh.generate(geo, 0.1)
Debugging
 |  |
|---|
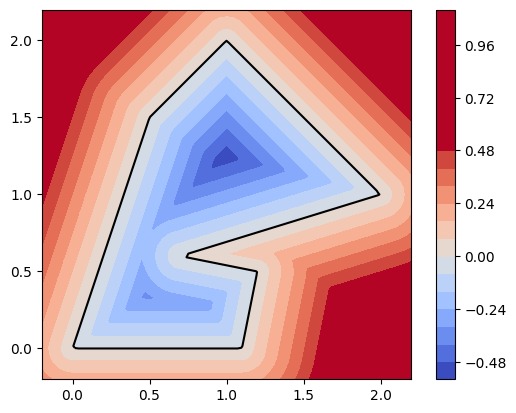
dmsh is rather fragile, but sometimes the break-downs are due to an incorrectly defined geometry. Use
geo.show()
to inspect the level set function of your domain. (It must be negative inside the domain and positive outside. The 0-level set forms the domain boundary.)
Installation
dmsh is available from the Python Package Index, so simply type
pip install dmsh
to install.
Testing
To run the dmsh unit tests, check out this repository and type
tox


