Awesome
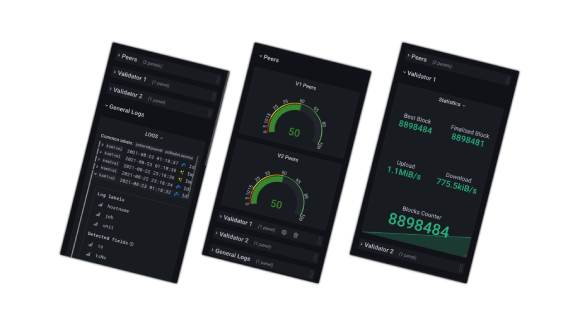
Grafana Cloud Monitoring for KUSAMA/PolkaDOT Validators KuELK
A monitoring service on Grafana Cloud, Loki and Promtail
Inspired by Grafana Account Page
Stress less project
Grafana Cloud Monitoring for KUSAMA/PolkaDOT Validators is a single agent installation, PROMTAIL
- No need to install Grafana
- No need to setup Loki
- Serveless Setup and Installation
- Full controll on what is send as logs
- Error reports Report Template
A snapshot is available to provide you with a fisrt look & feel of it
Grafana Cloud
- Create Grafana Cloud Account and obtain your Loki URL
- Grafana Dashboard ID: 14899 Dashboard URL
- Mobile Version ID: 14901 Mobile Dashboard
Promtail Installation
apt install sudo unzip -y \
&& sudo mkdir /opt/promtail \
&& cd /opt/promtail \
&& wget https://github.com/grafana/loki/releases/download/v2.2.1/promtail-linux-amd64.zip \
&& sudo unzip promtail-linux-amd64.zip
Promtail Configuration template, change the <DLOKI>
URL Can be taken from Grafana Cloud Pannel
curl -fsS https://raw.githubusercontent.com/ksmnetwork/kusama-cloud/main/install.sh | sh -s <DLOKI>
For Support && Nominations
-
Display name for Validators. KSMNETWORK && KSMNETWORK-WEST
-
Riot @gtoocool:matrix.org
-
KUSAMA (KSM) Address
H1bSKJxoxzxYRCdGQutVqFGeW7xU3AcN6vyEdZBU7Qb1rsZ -
PolkaDOT (DOT) Address:
15FxvBFDd3X7H9qcMGqsiuvFYEg4D3mBoTA2LQufreysTHKA
