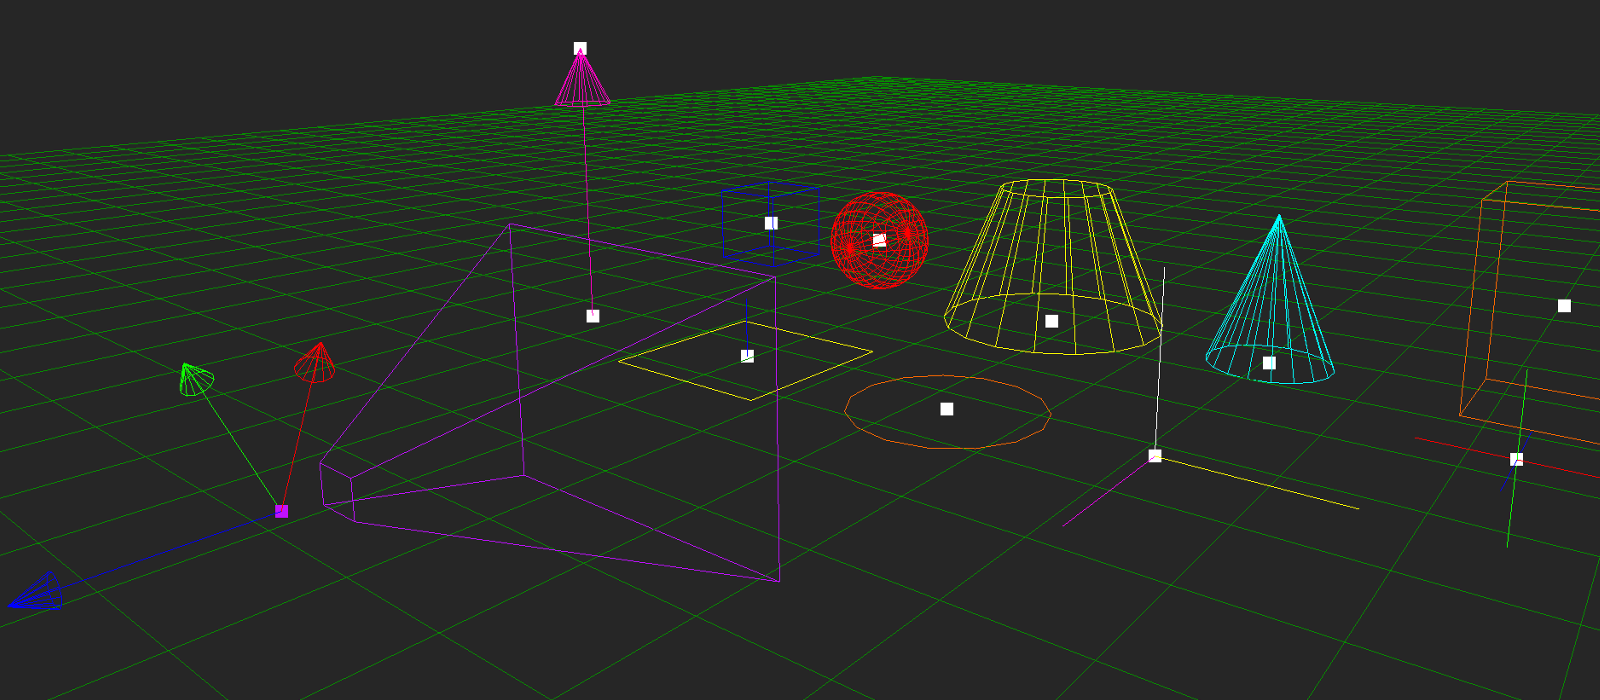
Awesome
Debug Draw
An immediate-mode, renderer agnostic, lightweight debug drawing API for C++.

License
This software is in the public domain. Where that dedication is not recognized, you are granted a perpetual, irrevocable license to copy, distribute, and modify the source code as you see fit.
The source code is provided "as is", without warranty of any kind, express or implied. No attribution is required, but a mention about the author(s) is appreciated.
Using Debug Draw
Debug Draw is a single source file library, so the "header" forward declarations and
the implementation are contained in the same file (debug_draw.hpp). This should facilitate
deployment and integration with your own projects. All you have to do is #include the library
file in one of your own source files and define DEBUG_DRAW_IMPLEMENTATION in that
file to generate the implementation. You can also still include the library in other
places. When DEBUG_DRAW_IMPLEMENTATION is not defined, it acts as a normal C++ header file.
Example:
In my_program.cpp:
#define DEBUG_DRAW_IMPLEMENTATION
#include "debug_draw.hpp"
Now in my_program.hpp or any other header or source file,
you can include it as a normal C++ header:
#include "debug_draw.hpp"
That's it, you should now be able to build Debug Draw into your own application.
Interfacing with your renderer
Debug Draw doesn't make assumptions about the underlaying renderer API, so it can be
integrated very easily with Direct3D or OpenGL or any other rendering engine of
your choice. All that is required is that you provide an implementation for the
dd::RenderInterface abstract class, which provides Debug Draw with basic methods
to draw points, lines and character glyphs. The following is what dd::RenderInterface looks like:
class RenderInterface
{
public:
    virtual void beginDraw();
    virtual void endDraw();

    virtual GlyphTextureHandle createGlyphTexture(int width, int height, const void * pixels);
    virtual void destroyGlyphTexture(GlyphTextureHandle glyphTex);

    virtual void drawPointList(const DrawVertex * points, int count, bool depthEnabled);
    virtual void drawLineList(const DrawVertex * lines, int count, bool depthEnabled);
    virtual void drawGlyphList(const DrawVertex * glyphs, int count, GlyphTextureHandle glyphTex);

    virtual ~RenderInterface() = 0;
};
Not all methods have to be implemented, you decide which features to support!
Look into the source code for the declaration of RenderInterface. Each method is
well commented and describes the expected behavior that you should implement.
For reference implementations of the RenderInterface using standard APIs like OpenGL,
refer to the samples/ directory in this project.
Once you implement a RenderInterface for your renderer, all you need to do before starting
to use Debug Draw is to call dd::initialize() passing it a pointer to your custom RenderInterface:
MyRenderInterface renderIface;
dd::initialize(&renderIface);
Note however that Debug Draw batches all primitives to reduce the number of calls to RenderInterface,
so drawing will only actually take place by the time you call dd::flush(), which is normally done
at the end of a frame, before flipping the screen buffers:
// You only have to pass the current time if you have timed debug
// draws in the queues. Otherwise just omit the argument or pass 0.
dd::flush(getTimeMilliseconds());
So the overall setup should look something like the following:
class MyRenderInterface : public dd::RenderInterface
{
    // Cherrypick the methods you want to implement or implement them all
    ...
};

int main()
{
    MyRenderInterface renderIface;
    dd::initialize(&renderIface);

    while (!quitting)
    {
        // Any other drawing that you already do
        ...

        // Call any dd:: functions to add debug primitives to the draw queues
        ...

        dd::flush(getTimeMilliseconds());

        // Swap buffers to present the scene
        ...
    }

    dd::shutdown();
}
Configuration switches
Debug Draw provides several compiler switches for library configuration and customization.
Check the documentation in debug_draw.hpp for a list of all switches plus detailed description of each.
Language/compiler requirements
The library has very few language requirements. One of its main goals is to be painless to integrate
and portable. The only requirement is a fairly recent C++ compiler with minimal Standard Library support.
Some C++11 features are assumed, such as nullptr and <cstdint>. The samples included make heavier use
of the C++ Standard Library to demonstrate Debug Draw usage with threads.
RTTI and C++ Exceptions are not used, so you should have no problems integrating the library with projects that disable those features.
The memory footprint is also small and you can manage the amount of memory that gets committed to the internal queues via preprocessor directives. We currently only allocate a small amount of dynamic memory at library startup to decompress the font glyphs for the debug text drawing functions and for the draw queues and library context data.
Thread safety and explicit contexts
By default, Debug Draw will use a static global context internally, providing a procedural-style API that is not thread safe. This is the "classic" Debug Draw mode that is the easiest to use and set up, but the library also supports two other modes that are thread safe and configurable at compile time:
-
DEBUG_DRAW_PER_THREAD_CONTEXT: If this is defined before the implementation, the library will use a thread-local context instead of the global shared default. This allows calling the library from different threads since each will keep its private context and draw queues. This mode provides the same public library interface but requires TLS (Thread Local Storage) support from the compiler. -
DEBUG_DRAW_EXPLICIT_CONTEXT: If this is defined before the implementation, the library expects the user to supply a handle to a context. This mode exposes thedd::ContextHandletype and changes each function in the library to take this handle as the first argument. This mode makes the library fully stateless, so that each rendering thread that calls into the library can create and maintain its own instance of Debug Draw.
The explicit context mode is a cleaner and more functional-style API and should be the preferred one for new users.
The procedural mode is still kept as the default for compatibility with older library versions, but it is
recommended that you use the explicit context mode by adding #define DEBUG_DRAW_EXPLICIT_CONTEXT together
with DEBUG_DRAW_IMPLEMENTATION. In the future, the procedural stateful API will be deprecated in favor of the explicit one.
Samples
Drawing a box with a set of coordinate axes in its center:
const ddVec3 boxColor  = { 0.0f, 0.8f, 0.8f };
const ddVec3 boxCenter = { 0.0f, 0.0f, 3.0f };

dd::box(boxCenter, boxColor, 1.5f, 1.5f, 1.5f);
dd::cross(boxCenter, 1.0f);

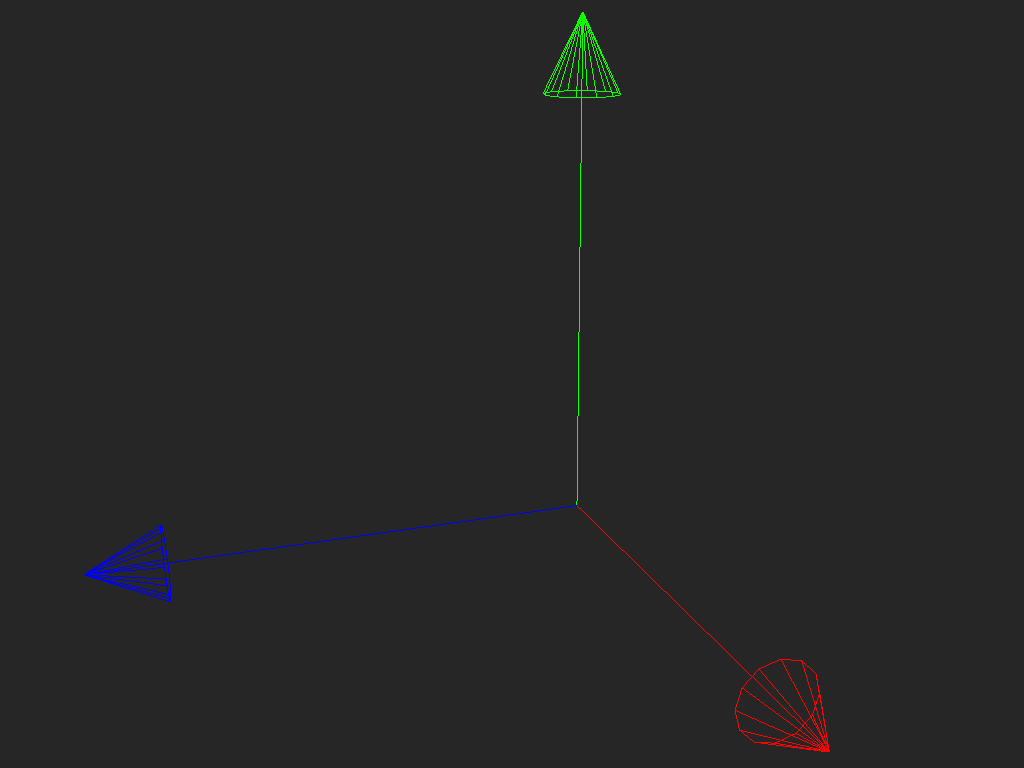
To visualize a matrix transform, you can use dd::axisTriad()
to draw the transform as three arrows:
const ddMat4x4 transform = { // The identity matrix
    1.0f, 0.0f, 0.0f, 0.0f,
    0.0f, 1.0f, 0.0f, 0.0f,
    0.0f, 0.0f, 1.0f, 0.0f,
    0.0f, 0.0f, 0.0f, 1.0f
};
dd::axisTriad(transform, 0.3f, 2.0f);

More complex samples and examples on how to integrate Debug Draw with your own renderer can
be found inside the samples/ directory. Each function provided in the public API is also well
documented in the header file. You will find a descriptive header comment before
the prototype of each public function exported by the library.