Awesome
![]() [ android-arsenal.com] (https://github.com/vbauer/android-arsenal.com)
[ android-arsenal.com] (https://github.com/vbauer/android-arsenal.com)
MPAndroidChart
A simple charting library for Android, supporting line-, bar-, scatter-, candlestick- and piecharts, as well as scaling, dragging, selecting and animations. Supporting Android 2.2 (API level 8) and upwards.
Remember: It's all about the looks.
The experimental branch might contain new features that are still buggy. It is recommended to be safe and only make use of the code on the master branch.
Forks, pull-requests or any other forms of contribution are always welcome.
Donations
If you would like to support this project's further development, the creator of this project or the continuous maintenance of this project, feel free to donate. Your donation is highly appreciated.
PayPal

Gittip
<a href="https://www.gittip.com/PhilJay/"> <img alt="Support via Gittip" src="https://rawgithub.com/twolfson/gittip-badge/0.2.0/dist/gittip.png"/> </a>
Demo
For a brief overview of the most important features, please download the PlayStore Demo MPAndroidChart Example.apk and try it out. The corresponding code for the demo-application is also included in this repository inside the MPChartExample folder.

Questions & Issues
If you are having questions or problems, feel free to contact me. Since I would very much like that other users of this library can also benefit from your question, I am asking you to contact me via e-mail only as a last option. Instead, you should:
- Make sure you are using the latest version of the library. Check the release-section.
- Search or open questions on stackoverflow with the
mpandroidcharttag - Search known issues for your problem (open and closed)
- Create new issues (please search known issues before, do not create duplicate issues)
You can let me know via e-mail that you have opened a stackoverflow question so that I might get to answering it more quickly. Thank you.
Features
Core features:
- Scaling on both axes (with touch-gesture, axes separately or pinch-zoom)
- Dragging (with touch-gesture)
- Finger drawing (draw values into the chart with touch-gesture)
- Highlighting values (with customizeable popup-views)
- Save chart to SD-Card (as image, or as .txt file)
- Read .txt file chart-data
- Predefined color templates
- Legends (generated automatically, customizeable)
- Labels (both x- and y-axis, customizeable)
- Animations (build up animations, on both x- and y-axis)
- Limit lines (providing additional information, maximums, ...)
- Fully customizeable (paints, typefaces, legends, colors, background, gestures, dashed lines, ...)
Chart types:
-
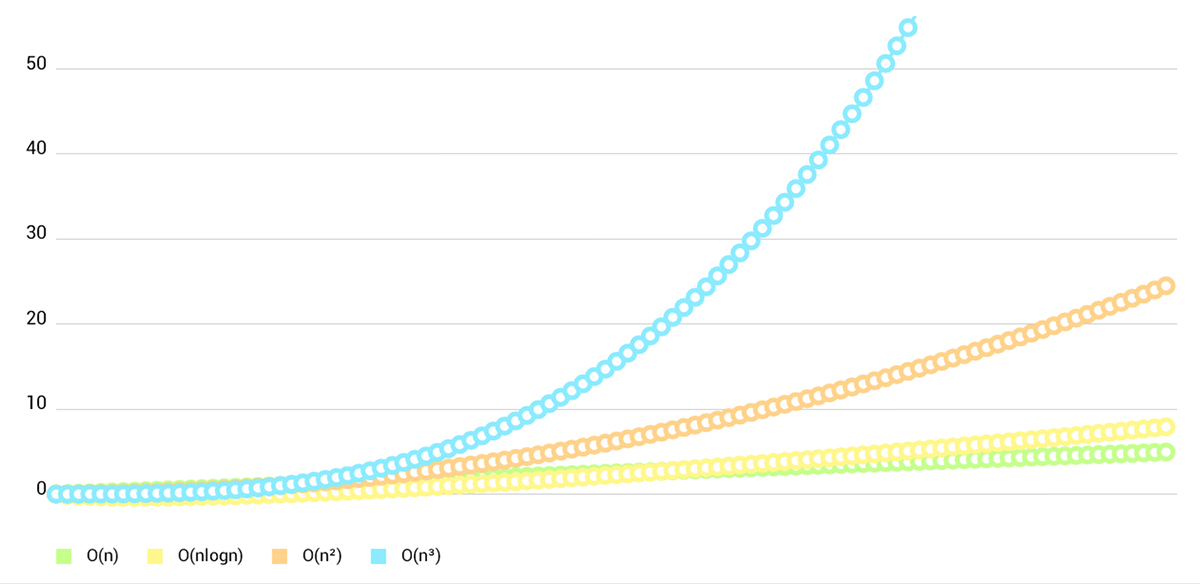
LineChart (with legend, simple design)

-
LineChart (with legend, simple design)
-
LineChart (cubic lines)
-
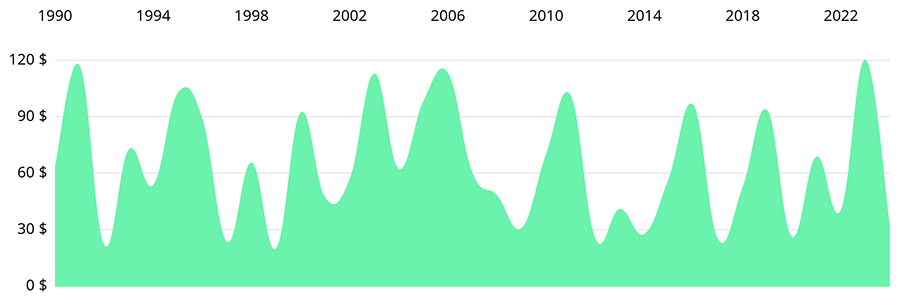
LineChart (single DataSet)
-
BarChart2D (with legend, simple design)

- BarChart2D (grouped DataSets)

- BarChart2D

- PieChart (with selection, ...)

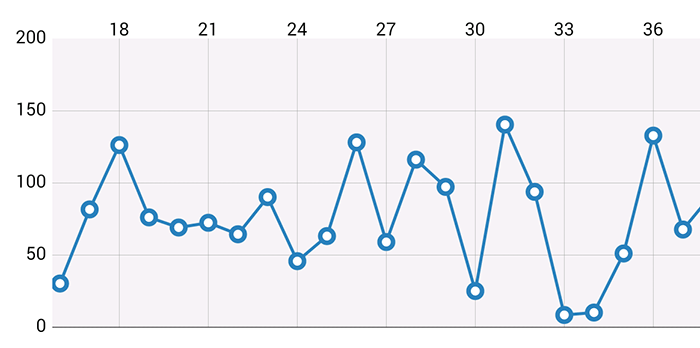
- ScatterChart (with squares, triangles, circles, ... and more)

- CandleStickChart (for financial data)

- RadarChart (spider web chart)

Usage
In order to use the library, there are 2 options:
1. jar file only
- Download the latest .jar file from the releases section
- Copy the mpandroidchartlibrary-.jar file into the
libsfolder of your Android application project - Start using the library
2. clone whole repository
- Open your commandline-input and navigate to your desired destination folder (where you want to put the library)
- Use the command
git clone https://github.com/PhilJay/MPAndroidChart.gitto download the full MPAndroidChart repository to your computer (this includes the folder of the library project as well as the example project) - Import the library folder (
MPChartLib) into your Eclipse workspace, usingFile-->Import-->Android-->Existing Android Codeand then choose the library folder from your file system and pressFinish. - After importing, add the library to your project by right clicking your project
Properties-->Android. There, you press the "Add.." button and choose the library project you just imported into eclipse. Then pressapply. - Start using the library
For getting started, rely on the "MPChartExample" folder and check out the examples in that project. The example project is also available in the Google PlayStore.
Furthermore, here is some code to begin with.
Setup:
For using a <code>LineChart, BarChart, ScatterChart, CandleStickChart or PieChart </code>, define it in .xml:
    <com.github.mikephil.charting.charts.LineChart
        android:id="@+id/chart"
        android:layout_width="match_parent"
        android:layout_height="match_parent" />
LineChart chart = (LineChart) findViewById(R.id.chart);
or create it in code (and then add it to a layout):
LineChart chart = new LineChart(Context);
Styling:
- <code>setDescription(String desc)</code>: Set a description text that appears in the bottom right corner of the chart.
- <code>setDescriptionTypeface(Typeface t)</code>: Sets the <code>Typeface</code> used for drawing the description text.
- <code>setDrawYValues(boolean enabled)</code>: If set to true, the actual drawn values will be drawn next to the points, bars, or pie slices of the chart.
- <code>setValuePaintColor(int color)</code>: Sets the color used for drawing the values if <code>setDrawYValues(...)</code> is enabled.
- <code>setValueTypeface(Typeface t)</code>: Sets the <code>Typeface</code> used for drawing the values if <code>setDrawYValues(...)</code> is enabled.
- <code>setValueFormatter(DecimalFormat format)</code>: Sets a new
DecimalFormatobject that will be used to format all values inside the chart. If nothing is set, formatting (digits) is done automatically. - <code>setPaint(Paint p, int which)</code>: Replaces the specified default <code>Paint</code> object with a new one. This method can be used to replace any predefined <code>Paint</code> object with an own <code>Paint</code> object and develop a completely personalized design.
Getters and convenience:
-
<code>public ChartData getDataCurrent()</code>: Returns the <code>ChartData</code> object the chart currently displays. It contains all information concerning the displayed values such as minimum and maximum values, value counts, value sums, ...
-
<code>public float getYChartMin()</code>: Returns the current minimum y-value that can be displayed by the chart - bottom line.
-
<code>public float getYChartMax()</code>: Returns the current maximum y-value that can be displayed by the chart - top line.
-
<code>public float getAverage()</code>: Returns the average value across all values the chart holds.
-
<code>public float getAverage(int type)</code>: Returns the average value for a specific DataSet type in the chart. This type is the type provided in the <code>DataSet</code> constructor.
-
<code>public PointF getCenter()</code>: Returns the center point of the chart in pixels.
-
<code>public Paint getPaint(int which)</code>: Returns the requested Paint object from the chart.
Gestures & Selecting:
- <code>setTouchEnabled(boolean enabled)</code>: If set to ture, touch gestures (such as scaling and dragging) will be possible on the chart. NOTE: If touch-gestures are disabled, highlighting on touch is disabled as well. Default: true.
- <code>setDragScaleEnabled(boolean enabled)</code>: Enables/disables dragging and scaling for the chart.
- <code>setOnChartValueSelectedListener(OnChartValueSelectedListener l)</code>: Sets a selection-listener to the chart that will generate callbacks when values are selected or unselected. The callback contains the selected values and their indices.
- <code>setHighlightEnabled(boolean enabled)</code>: If set to true, highlighting/selecting values is possible on the chart. Default: true.
- <code>public void highlightValues(Highlight[] highs)</code>: Highlights the specified entries in the chart.
Other:
- <code>saveToGallery(String title)</code>: Saves the current chart state as an image to the gallery.
- <code>saveToPath(String title, String pathOnSD)</code>: Saves the current chart state as an image to the specified path.
- <code>setScaleMinima(float x, float y)</code>: Sets the minimum scale factors for x- and y-axis. If set for example to 3f, the user will not be able to fully zoom out.
- <code>centerViewPort(int xIndex, float val)</code>: This method makes it possible to aim the center of the view (what you can see from the chart) to a specific position inside the chart, described by the index on the x-axis and the value on the y-axis. This also works very well in combination with the
setScaleMinima(...)method. - <code>fitScreen()</code>: Resets all zooming and dragging and makes the chart fit exactly it's bounds.
Adding data:
If you want to add values (data) to the chart, it has to be done via the
setData(ChartData data);
method. The baseclass <code>ChartData</code> class encapsulates all data and information that is needed for the chart during rendering. For each type of chart, a different subclass of ChartData (e.g. LineData) exists that should be used for setting data for the chart. In the constructor, you can hand over an <code>ArrayList<? extends DataSet></code> as the values to display, and an additional <code>ArrayList</code> of <code>String</code> that will describe the labels on the x-axis. Example with the class LineData (extends ChartData), which is used for adding data to a LineChart:
public LineData(ArrayList<String> xVals, ArrayList<LineDataSet> sets) { ... }
So, what is a <code>DataSet</code> and why do you need it? That is actually pretty simple. One <code>DataSet</code> object represents a group of entries (datatype <code>Entry</code>) inside the chart that belong together. It is designed to logically separate different groups of values in the chart. For each type of chart, a differnt object that extends DataSet (e.g. LineDataSet) exists that allows specific styling.
As an example, you might want to display the quarterly revenue of two different companies over one year in a LineChart. In that case, it would be recommended to create two different <code>LineDataSet</code> objects, each containing four values (one for each quarter). As an <code>ArrayList<String></code> to describe the labels on the x-axis, you would simply provide the four Strings "1.Q", "2.Q", "3.Q", "4.Q".
Of course, it is also possible to provide just one <code>LineDataSet</code> object containing all 8 values for the two companys.
So how to setup a <code>LineDataSet</code> object?
public LineDataSet(ArrayList<Entry> yVals, String label) { ... }
When looking at the constructor, it is visible that the <code>LineDataSet</code> needs an <code>ArrayList</code> of type <code>Entry</code> and a String used to describe the LineDataSet and as a label used for the Legend. Furthermore this label can be used to find the LineDataSet amongst other LineDataSet objects in the LineData object.
The <code>ArrayList</code> of type <code>Entry</code> encapsulates all values of the chart. A <code>Entry</code> object is an additional wrapper around a value and holds the value itself, and it's position on the x-axis (the index inside the <code>ArrayList</code> of <code>String</code> of the <code>LineData</code> object the value is mapped to):
public Entry(float val, int xIndex) { ... }
Putting it all together (example of two companies with quarterly revenue over one year):
At first, create the lists of type <code>Entry</code> that will hold your values:
    ArrayList<Entry> valsComp1 = new ArrayList<Entry>();
    ArrayList<Entry> valsComp2 = new ArrayList<Entry>();
Then, fill the lists with <code>Entry</code> objects. Make sure the entry objects contain the correct indices to the x-axis. (of course, a loop can be used here, in that case, the counter variable of the loop could be the index on the x-axis).
    Entry c1e1 = new Entry(100.000f, 0); // 0 == quarter 1
    valsComp1.add(c1e1);
    Entry c1e2 = new Entry(50.000f, 1); // 1 == quarter 2 ...
    valsComp1.add(c1e2);
    // and so on ...

    Entry c2e1 = new Entry(120.000f, 0); // 0 == quarter 1
    valsComp2.add(c2e1);
    Entry c2e2 = new Entry(110.000f, 1); // 1 == quarter 2 ...
    valsComp2.add(c2e2);
    //...
Now that we have our lists of <code>Entry</code> objects, the <code>LineDataSet</code> objects can be created:
    LineDataSet setComp1 = new LineDataSet(valsComp1, "Company 1");
    LineDataSet setComp2 = new LineDataSet(valsComp2, "Company 2");
Last but not least, we create a list of <code>DataSets</code> and a list of x legend entries and build our <code>ChartData</code> object:
    ArrayList<LineDataSet> dataSets = new ArrayList<LineDataSet>();
    dataSets.add(setComp1);
    dataSets.add(setComp2);

    ArrayList<String> xVals = new ArrayList<String>();
    xVals.add("1.Q"); xVals.add("2.Q"); xVals.add("3.Q"); xVals.add("4.Q");

    LineData data = new LineData(xVals, dataSets);
    mLineChart.setData(data);
Setting colors:
Since release v1.4.0, the ColorTemplate object that was responsible for setting colors in previous releases is no longer needed. Nevertheless, it still holds all predefined color arrays (e.g. ColorTemplate.VORDIPLOM_COLORS and provides convenience methods for transforming colors from the resources (resource integers) into "real" colors.
Instead of the ColorTemplate, colors can now be specified directly via DataSet object, which allows separate styling for each DataSet.
In this short example, we have our two different LineDataSet objects representing the quarterly revenues of two companies (previously mentioned in the Adding data tutorial), for which we now want to set different colors.
What we want:
- the values of "Company 1" should be represented by four different variations of the color "red"
- the values of "Company 2" should be represented by four different variations of the color "green"
This is what the code looks like:
  LineDataSet setComp1 = new LineDataSet(valsComp1, "Company 1");

  // sets colors for the dataset, resolution of the resource name to a "real" color is done internally
  setComp1.setColors(new int[] { R.color.red1, R.color.red2, R.color.red3, R.color.red4 }, Context);

  LineDataSet setComp2 = new LineDataSet(valsComp2, "Company 2");
  setComp2.setColors(new int[] { R.color.green1, R.color.green2, R.color.green3, R.color.green4 }, Context);
Besides that, there are many other ways for setting colors for a DataSet. Here is the full documentation:
setColors(int [] colors, Context c): Sets the colors that should be used fore this DataSet. Colors are reused as soon as the number of Entries the DataSet represents is higher than the size of the colors array. You can use "new int[] { R.color.red, R.color.green, ... }" to provide colors for this method. Internally, the colors are resolved using getResources().getColor(...).setColors(int [] colors): Sets the colors that should be used fore this DataSet. Colors are reused as soon as the number of Entries the DataSet represents is higher than the size of the colors array. Make sure that the colors are already prepared (by calling getResources().getColor(...)) before adding them to the DataSet.setColors(ArrayList<Integer> colors): Sets the colors that should be used fore this DataSet. Colors are reused as soon as the number of Entries the DataSet represents is higher than the size of the colors array. Make sure that the colors are already prepared (by calling getResources().getColor(...)) before adding them to the DataSet.setColor(int color): Sets the one and ONLY color that should be used for this DataSet. Internally, this recreates the colors array and adds the specified color.
ColorTemplate example:
LineDataSet set = new LineDataSet(...);
set.setColors(ColorTemplate.VORDIPLOM_COLORS);
If no colors are set for a DataSet, default colors are used.
Displaying / styling legends:
By default, all chart types support legends and will automatically generate and draw a legend after setting data for the chart. If a legend should be drawn or not can be enabled/disabled using the
setDrawLegend(boolean enabled)
method.
The number of entries the automatically generated legend contains depends on the number of different colors (across all DataSet objects) as well as on the DataSet labels. The labels of the Legend depend on the labels set for the used DataSet objects in the chart. If no labels for the DataSet objects have been specified, the chart will automatically generate them. If multiple colors are used for one DataSet, those colors are grouped and only described by one label.
For customizing the Legend, use you can retreive the Legend object from the chart after setting data using the getLegend() method.
    // setting data...
    chart.setData(....);

    Legend l = chart.getLegend();
    l.setFormSize(10f); // set the size of the legend forms/shapes
    l.setForm(LegendForm.CIRCLE); // set what type of form/shape should be used
    l.setPosition(LegendPosition.BELOW_CHART_LEFT);
    l.setTypeface(...);
    l.setXEntrySpace(5f); // set the space between the legend entries on the x-axis
    l.setYEntrySpace(5f); // set the space between the legend entries on the y-axis
    // and many more...
Displaying / styling labels:
Labels (classes XLabel and YLabel) are used to describe the values of the chart on the x- and y-axis. While the x-axis labels display what is handed over to the ChartData object as an ArrayList<String> ("xVals"), the y-axis labels depend on the actual values that are set for the chart.
Labels can be enabled/disabled, using the methods:
setDrawXLabels(boolean enabled)setDrawYLabels(boolean enabled)
the chart provides.
In order to apply a different styling to the labels, the methods getYLabels() and getXLabels() can be used to acquire the labels object and modify it.
Example:
XLabels xl = mChart.getXLabels();
xl.setPosition(XLabelPosition.BOTTOM); // set the position
xl.setTypeface(...); // set a different font
xl.setTextSize(12f); // set the textsize
xl.setSpaceBetweenLabels(3); // set how many characters of space should be between the labels
//... and more

YLabels yl = mChart.getYLabels();
yl.setPosition(YLabelPosition.BOTH_SIDED); // set the position
yl.setTypeface(...); // set a different font
yl.setTextSize(12f); // set the textsize
yl.setLabelCount(6); // set how many label entries should be displayed
//... and more
Limit Lines:
Limit lines (class LimitLine) are (as the name might indicate) plain and simple lines that can be set for all Line-, Bar- and ScatterData objects. They can be used to provide additional information for the user.
As an example, your chart might display various blood pressure measurement results the user logged with an application. In order to inform the user that a systolic blood pressure of over 140 mmHg is considered to be a health risk, you could add a LimitLine at 140 to provide that information.
LineData ld = new LineData(...);

LimitLine ll = new LimitLine(140f);
ll.setLineColor(Color.RED);
ll.setLineWidth(4f);
// .. and more styling options

ld.addLimitLine(ll);
Dynamically adding data (real time):
For adding new data to the chart dynamically, there are various methods that allow to either add Entry objects to an existing DataSet or DataSet objects to an existing ChartData object.
Class DataSet (and all subclasses):
addEntry(Entry e): Adds the givenEntryobject to theDataSet.
Class ChartData (and all subclasses):
addEntry(Entry e, int dataSetIndex): Adds the givenEntryto theDataSetat the specified dataset index.addDataSet(DataSet d): Adds the givenDataSetobject to theChartDataobject.
In addition to that, there are also methods for removing data dynamically.
Class DataSet (and all subclasses):
public boolean removeEntry(Entry e): Removes the givenEntryobject from theDataSet. Returns true if successful.public boolean removeEntry(int xIndex): Removes theEntryat the given x-index from theDataSet. Returns true if successful.
Class ChartData (and all subclasses):
public boolean removeEntry(Entry e, int dataSetIndex): Removes the givenEntryobject from theDataSetwith the given dataset index. Returns true if successful.public boolean removeEntry(int xIndex, int dataSetIndex): Removes theEntryat the given x-index from theDataSetwith the given dataset index. Returns true if successful.public boolean removeDataSet(DataSet d): Removes the givenDataSetobject from theChartDataobject. Returns true if successful.public boolean removeDataSet(int index): Removes theDataSetat the given index from theChartDataobject. Returns true if successful.
Animations:
All chart types support animations that can be used to create / build up the chart in an awesome looking way. Three different kinds of animation methods exist that animate either both, or x- and y-axis separately:
animateX(int durationMillis): Animates the charts values on the horizontal axis, meaning that the chart will build up within the specified time from left to right.animateY(int durationMillis): Animates the charts values on the vertical axis, meaning that the chart will build up within the specified time from bottom to top.animateXY(int xDuration, int yDuration): Animates both horizontal and vertical axis, resulting in a left/right bottom/top build-up.
mChart.animateX(3000f); // animate horizontal 3000 milliseconds
// or:
mChart.animateY(3000f); // animate vertical 3000 milliseconds
// or:
mChart.animateXY(3000f, 3000f); // animate horizontal and vertical 3000 milliseconds
If animate(...) (of any kind) is called, no further calling of invalidate() is necessary to refresh the chart.
In order to support animations below Honeycomb, this library makes use of the awesome nineoldandroids library developed by Jake Wharton.
More documentation and example code coming soon.
This chart library is intended to fill the gap between popular charting libraries like "GraphView" or "achartengine".
License
Copyright 2014 Philipp Jahoda
Licensed under the Apache License, Version 2.0 (the "License"); you may not use this file except in compliance with the License. You may obtain a copy of the License at
http://www.apache.org/licenses/LICENSE-2.0
Unless required by applicable law or agreed to in writing, software distributed under the License is distributed on an "AS IS" BASIS, WITHOUT WARRANTIES OR CONDITIONS OF ANY KIND, either express or implied. See the License for the specific language governing permissions and limitations under the License.
Special thanks to mikegr and ph1lb4 for their contributions to this project.