Awesome
🚦 Code Coverage Dashboard
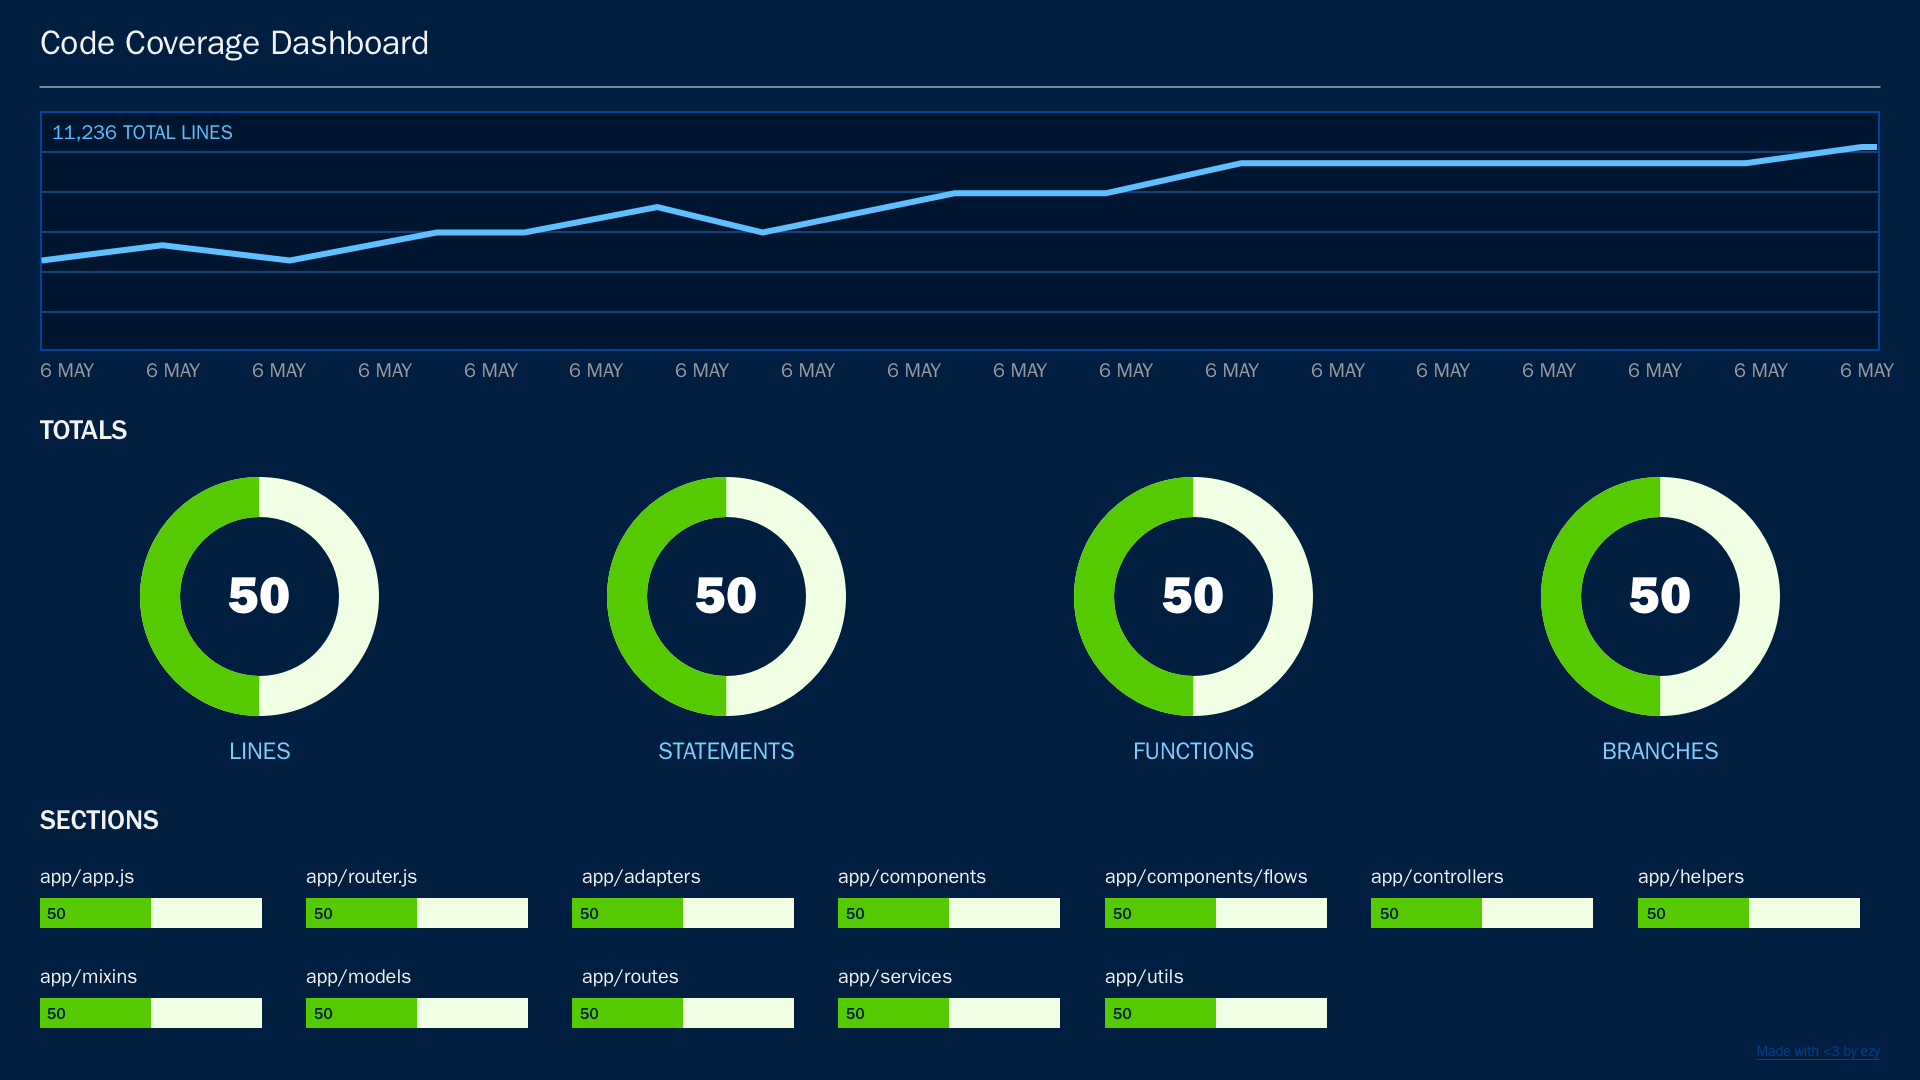
A simple dashboard for Istanbul code coverage reports designed to be deployed to Heroku. The app takes any coverage-summary.json input file hosted within a folder on github and displays the data in a set of easily configurable chart components. Works great for a dev team to see their code coverage improving over time.

Table of Contents
Quick start
- Setup Istanbul to export a
json-summaryreport with datestamp. - Upload
coverage-summary-1534886771995.jsonto a folder in the github repo you want to display. - Add the folder location of your
json-summaryreport in .envREACT_APP_DATA_DIR_URL. - Build to Heroku.
- The app will check hourly for a new file in
REACT_APP_DATA_DIR_URL. - If the filename is different (eg.
coverage-summary-1534886791867.json) the line chart will update.
Istanbul setup
Reports are generated from the json-summary report by Istanbul. There's an example isantbul.yml file in the project directory that includes report settings for html and json-summary reports. In order for your filename changes to be picked up you can timeStamp the coverage-sumary.json file by using the following script in your package.json file:
{
  "scripts": {
    "covdate": "mv coverage/coverage-summary.json coverage/coverage-summary-$(date +%Y%m%d%H%M).json"
  }
}
Configuring reports
There are three different report charts that are displayed: A dateTime based line chart displaying total statement coverage; a summary of total coverage values as donut charts; and a group of stack charts that display coverage for individual and grouped report strings.
Line chart
The line chart component is located at src/components/LineChart.js. It takes an array of values from localStorage and displays them as date (X axis) and value (Y axis) from the object input: {value: 96.75, date: "2018-08-21T04:13:07.414Z"}. All localStorage values are loaded in the src/templates/App.js file.
Donut chart
The donut chart is fixed and takes the JSON fetched from coverage-summary.json as data props. It's currently hard-coded to display the percentage of the report totals with the selectName property for the corresponding nested key in the total object.
eg. <DonutChart selectName="statements" data={this.state.data} />
Stack chart
The stack charts take the JSON fetched from coverage-summary.json as data props. They take a second property fileSet that can be specified as all or part of the object key strings in coverage-summary.json. The stack chart will display the average coverage for an keys that match the fileSet property.
eg. <StackChart fileSet="server/user" data={this.state.data} />
Available scripts
In the project directory, you can run:
yarn start
Runs the app in the development mode.<br> Open http://localhost:3000 to view it in the browser.
The page will reload if you make edits.<br> You will also see any lint errors in the console.
yarn test
Launches the test runner in the interactive watch mode.
yarn build
Builds the app for production to the build folder.<br>
It correctly bundles React in production mode and optimizes the build for the best performance.
The build is minified and the filenames include the hashes.<br> Your app is ready to be deployed!
yarn lint
Runs linting for the project and checks against rules in .eslintrc.json.