Awesome
dr-cabal
dr-cabal is a CLI tool for profiling Haskell dependencies build times.

ℹ️ DISCLAIMER: This project is developed and maintained in free time by volunteers. The development may continue for decades or may stop tomorrow. You can use GitHub Sponsorship to support the development of this project.
Install
dr-cabal is a CLI tool written in Haskell and can be installed
either from Hackage or from this repository.
Prerequisites
To start using dr-cabal, make sure you have the required version of
cabal-install (a Haskell build tool) and GHC (a Haskell compiler)
installed:
Hackage
To install the latest version of dr-cabal from
Hackage,
follow these steps:
-
Update Hackage index:
cabal update -
Build
dr-cabalfrom Hackage and copy the resulting executable into the desired location (e.g.$HOME/.local/bin):cabal install dr-cabal \ --install-method=copy \ --overwrite-policy=always \ --installdir=$HOME/.local/bin
ℹ️ NOTE: Make sure the
$HOME/.local/bindirectory or the directory of your choice is listed in$PATH.
Sources
To build the latest version of dr-cabal from sources,
follow these steps:
-
Clone this repository:
git clone https://github.com/chshersh/dr-cabal.git cd dr-cabal -
Build the package:
cabal build -
Copy executable to the desired location:
cp $(cabal list-bin exe:dr-cabal) ~/.local/bin/dr-cabal
ℹ️ NOTE: Make sure the
~/.local/bindirectory or the directory of your choice is listed in$PATH.
Quick start guide
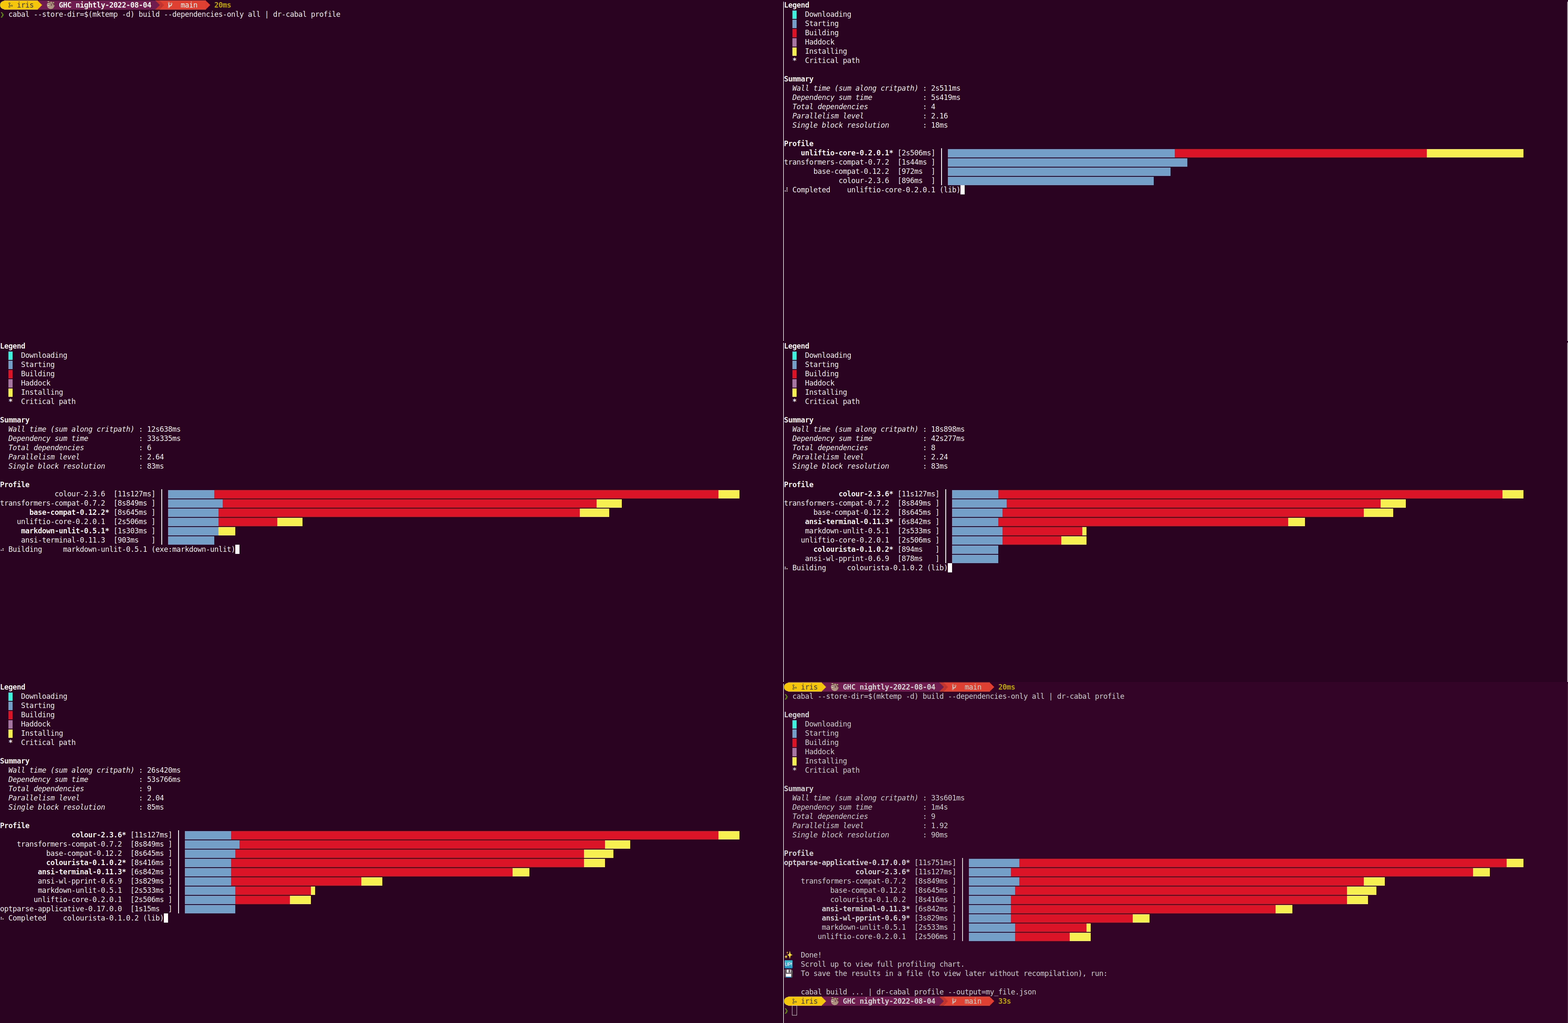
Run the following command to view interactive profiling report:
cabal --store-dir=$(mktemp -d) build --dependencies-only all | dr-cabal profile
Explanation
This section explains the above command:
dr-cabalwatches the output of thecabal buildcommand to produce the profiling report. Step into the directory of the Haskell project you want to profile and pipe the output ofcabal buildtodr-cabal profile.- Currently,
dr-cabalcan profile only dependencies. So you can pass the--dependencies-onlyto avoid extra wait. cabalcaches built dependencies. You can specify a custom directory for storing build artifacts using the--store-dirflag to build the dependencies anew.- The
$(mktemp -d)command generates a temporary directory so you can run the build time profiler in an isolated location.
⚠️ WARNING: To get meaningful results, including downloading of packages, the
dr-cabal watchcommand needs to be run when none of the dependencies are build (i.e. with cold cabal cache). If you've already build you project, including dependencies, you can purge global Cabal cache using the following command:rm -rf ~/.cabal
Usage
ℹ️ In this section, a more verbose
cabal-installcommand from "Quick start guide" is replaced with shortercabal build.
dr-cabal supports profiling of documentation as well, you only need
to pass relevant flags to cabal build:
cabal build --enable-documentation --haddock-all | dr-cabal profile
To cache the profiling results in JSON (and avoid building the project
again), use the --output flag:
cabal build | dr-cabal profile --output=my_file.json
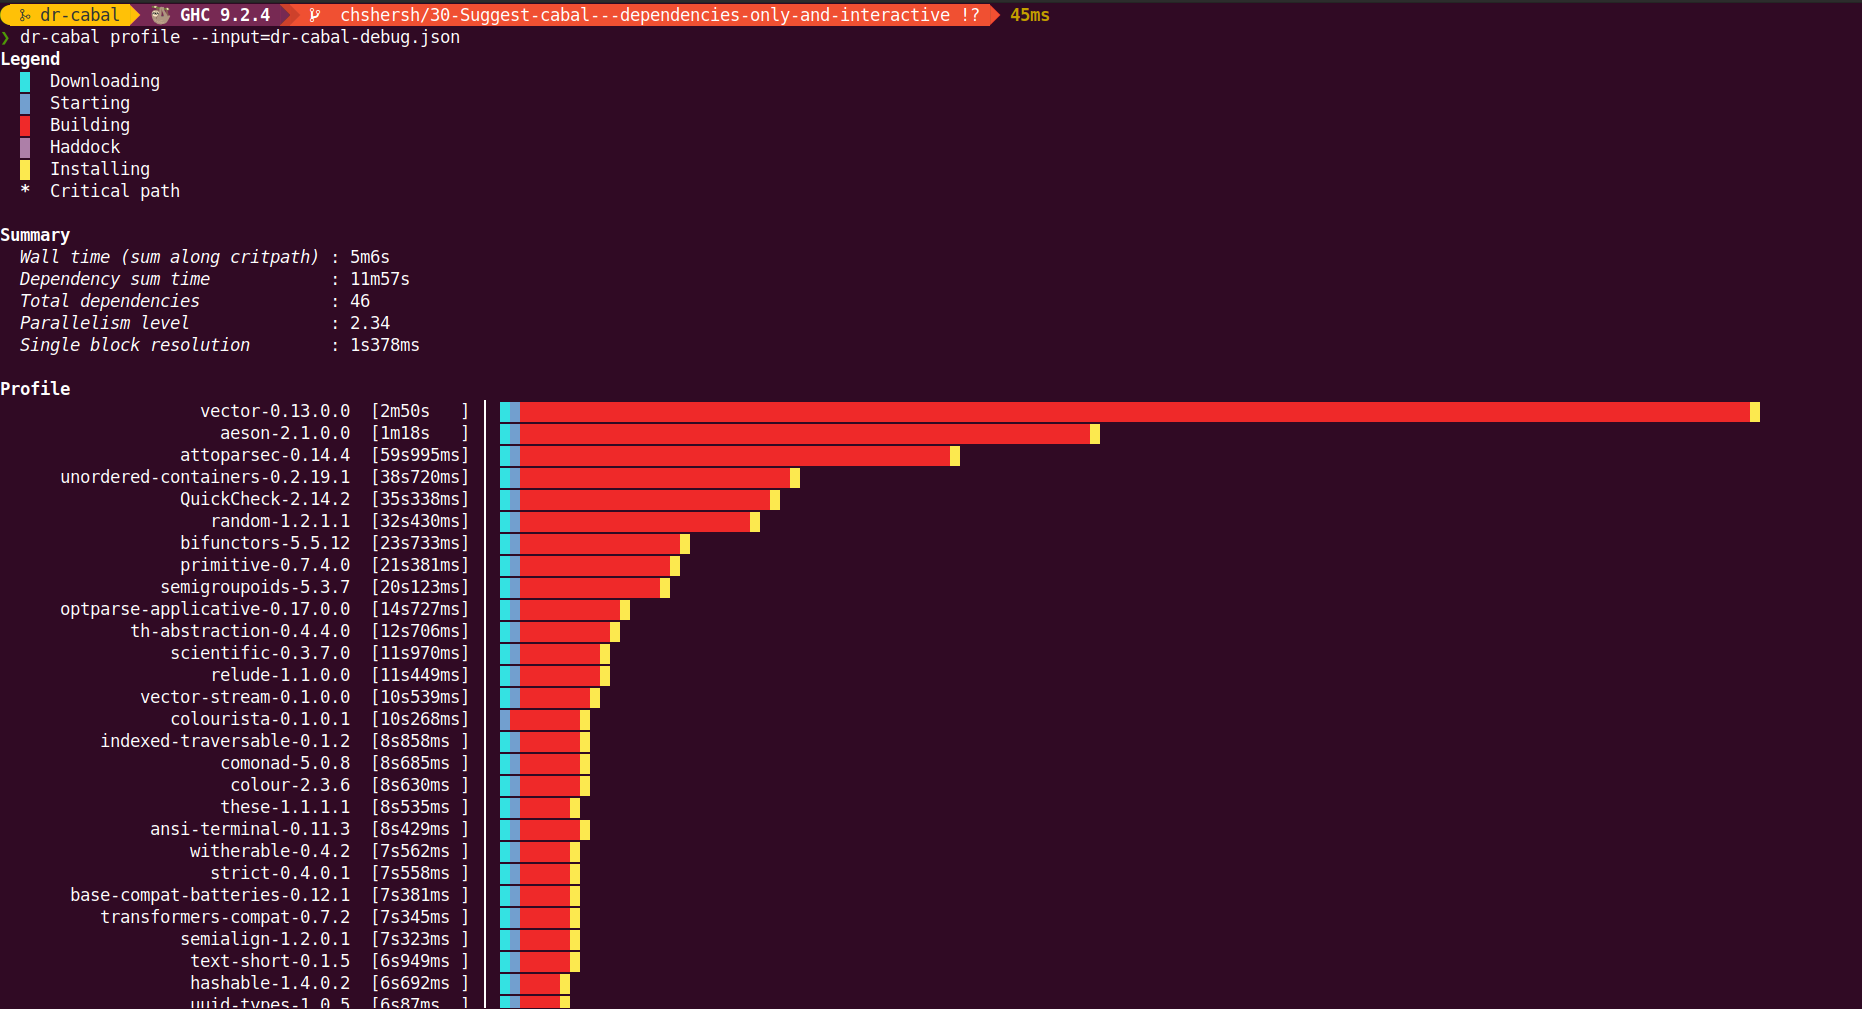
Once you successfully produced a JSON file with all the recorded steps, run the following command to pretty-print the profiling output:
⚠️ WARNING: For better results, make your terminal full-screen.
dr-cabal profile --input=my_file.json
You'll see the output like on the image below:


