Awesome
tsmoothie
A python library for time-series smoothing and outlier detection in a vectorized way.
Overview
tsmoothie computes, in a fast and efficient way, the smoothing of single or multiple time-series.
The smoothing techniques available are:
- Exponential Smoothing
- Convolutional Smoothing with various window types (constant, hanning, hamming, bartlett, blackman)
- Spectral Smoothing with Fourier Transform
- Polynomial Smoothing
- Spline Smoothing of various kind (linear, cubic, natural cubic)
- Gaussian Smoothing
- Binner Smoothing
- LOWESS
- Seasonal Decompose Smoothing of various kind (convolution, lowess, natural cubic spline)
- Kalman Smoothing with customizable components (level, trend, seasonality, long seasonality)
tsmoothie provides the calculation of intervals as result of the smoothing process. This can be useful to identify outliers and anomalies in time-series.
In relation to the smoothing method used, the interval types available are:
- sigma intervals
- confidence intervals
- predictions intervals
- kalman intervals
tsmoothie can carry out a sliding smoothing approach to simulate an online usage. This is possible splitting the time-series into equal sized pieces and smoothing them independently. As always, this functionality is implemented in a vectorized way through the WindowWrapper class.
tsmoothie can operate time-series bootstrap through the BootstrappingWrapper class.
The supported bootstrap algorithms are:
- none overlapping block bootstrap
- moving block bootstrap
- circular block bootstrap
- stationary bootstrap
Media
Blog Posts:
- Time Series Smoothing for better Clustering
- Time Series Smoothing for better Forecasting
- Real-Time Time Series Anomaly Detection
- Extreme Event Time Series Preprocessing
- Time Series Bootstrap in the age of Deep Learning
Installation
pip install --upgrade tsmoothie
The module depends only on NumPy, SciPy and simdkalman. Python 3.6 or above is supported.
Usage: smoothing
Below a couple of examples of how tsmoothie works. Full examples are available in the notebooks folder.
# import libraries
import numpy as np
import matplotlib.pyplot as plt
from tsmoothie.utils_func import sim_randomwalk
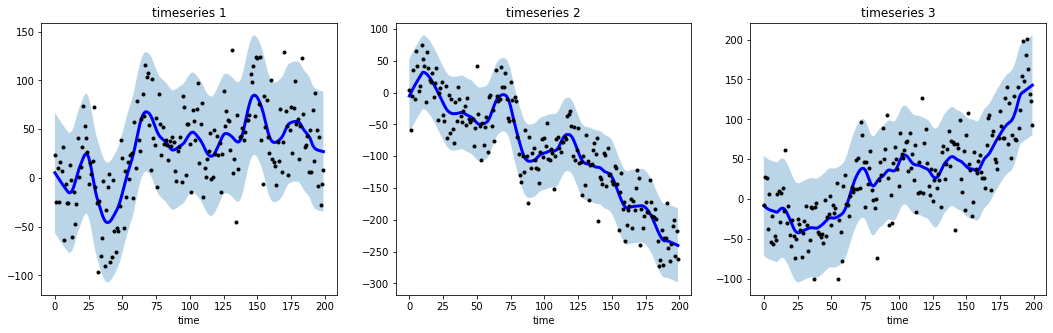
from tsmoothie.smoother import LowessSmoother
# generate 3 randomwalks of lenght 200
np.random.seed(123)
data = sim_randomwalk(n_series=3, timesteps=200,
process_noise=10, measure_noise=30)
# operate smoothing
smoother = LowessSmoother(smooth_fraction=0.1, iterations=1)
smoother.smooth(data)
# generate intervals
low, up = smoother.get_intervals('prediction_interval')
# plot the smoothed timeseries with intervals
plt.figure(figsize=(18,5))
for i in range(3):
plt.subplot(1,3,i+1)
plt.plot(smoother.smooth_data[i], linewidth=3, color='blue')
plt.plot(smoother.data[i], '.k')
plt.title(f"timeseries {i+1}"); plt.xlabel('time')
plt.fill_between(range(len(smoother.data[i])), low[i], up[i], alpha=0.3)
# import libraries
import numpy as np
import matplotlib.pyplot as plt
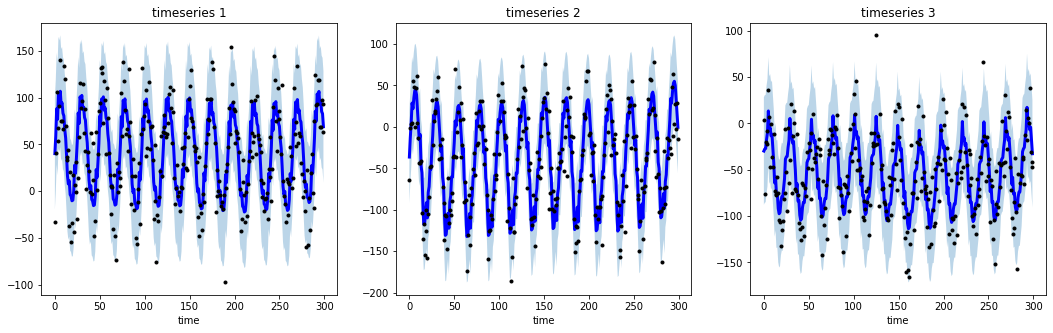
from tsmoothie.utils_func import sim_seasonal_data
from tsmoothie.smoother import DecomposeSmoother
# generate 3 periodic timeseries of lenght 300
np.random.seed(123)
data = sim_seasonal_data(n_series=3, timesteps=300,
freq=24, measure_noise=30)
# operate smoothing
smoother = DecomposeSmoother(smooth_type='lowess', periods=24,
smooth_fraction=0.3)
smoother.smooth(data)
# generate intervals
low, up = smoother.get_intervals('sigma_interval')
# plot the smoothed timeseries with intervals
plt.figure(figsize=(18,5))
for i in range(3):
plt.subplot(1,3,i+1)
plt.plot(smoother.smooth_data[i], linewidth=3, color='blue')
plt.plot(smoother.data[i], '.k')
plt.title(f"timeseries {i+1}"); plt.xlabel('time')
plt.fill_between(range(len(smoother.data[i])), low[i], up[i], alpha=0.3)
All the available smoothers are fully integrable with sklearn (see here).
Usage: bootstrap
# import libraries
import numpy as np
import matplotlib.pyplot as plt
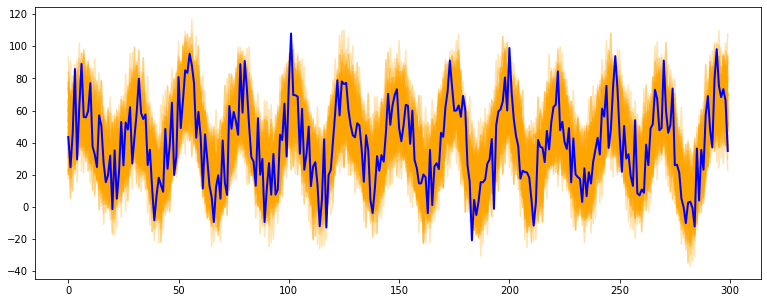
from tsmoothie.utils_func import sim_seasonal_data
from tsmoothie.smoother import ConvolutionSmoother
from tsmoothie.bootstrap import BootstrappingWrapper
# generate a periodic timeseries of lenght 300
np.random.seed(123)
data = sim_seasonal_data(n_series=1, timesteps=300,
freq=24, measure_noise=15)
# operate bootstrap
bts = BootstrappingWrapper(ConvolutionSmoother(window_len=8, window_type='ones'),
bootstrap_type='mbb', block_length=24)
bts_samples = bts.sample(data, n_samples=100)
# plot the bootstrapped timeseries
plt.figure(figsize=(13,5))
plt.plot(bts_samples.T, alpha=0.3, c='orange')
plt.plot(data[0], c='blue', linewidth=2)
References
- Polynomial, Spline, Gaussian and Binner smoothing are carried out building a regression on custom basis expansions. These implementations are based on the amazing intuitions of Matthew Drury available here
- Time Series Modelling with Unobserved Components, Matteo M. Pelagatti
- Bootstrap Methods in Time Series Analysis, Fanny Bergström, Stockholms universitet