Awesome
Overlapped Execution Test Application
This reposistory containes the code for a DX12 application that can visualize how draw and dispatch calls execute on the GPU. The main purpose is to test the capability of GPU's to overlap shader execution from multiple submissions in the presence (or absence) of transition barriers. The app can also visualize the execution of workloads submited to DIRECT and COMPUTE queues, as well as the effects of using split barriers. Here's an overview of the application UI:

Each red box represents the execution of a single draw or dispatch. The yellow lines represent dependencies, which are expressed as transition barriers. The "Workload Settings" panel can be used to enable or disable different workloads, adjust the number of threads per workload, and/or adjust the amount of per-thread work performed in the shader for that workload. Dependendencies can also be specified using the drop-down.
By default, the app will target the first enumerated adapter, which typically corresponds to the GPU connected to the primary display. The adapter can be explicitly specified by using the "--adapter X" command line argument, where 'X' is the 0-based index of the adapter to use. So specifying "--adapter 1" will target the second adapter returned by IDXGIFactory4::EnumAdapters1.
More complete details on the application as well as more results will be provided in a future blog post.
Build Instructions
The repository contains a Visual Studio 2015 project and solution file that's ready to build on Windows. All external dependencies are included in the repository, so there's no need to download additional libraries. Running the demo requires Windows 10 version 1607 (or higher), as well as a GPU that supports Feature Level 11_0.
DISCLAIMER
This app does not use timestamp queries to measure GPU execution time, since their behavior with regards to overlapping executions is not well-defined in the D3D12 documentation. Instead, the shader writes to buffers placed in D3D12_MEMORY_POOL_L0, while the CPU manually monitors the state of those buffers to determine when shader has started and finished. It's entirely possible that some future hardware or a driver update will break an assumption made by this app, and render the results invalid. Either way, I would urge any users of this app to take the results with a large grain of salt, and to only use it for educational purposes.
Also, please keep in mind that overlapping different workloads does not mean that those workloads will execute faster than if they were executed serially. This is especially true when comparing different hardware, and so I would strongly advise against using the results of this app to make broad claims about the performance abilities of hardware from competing vendors.
Selected results
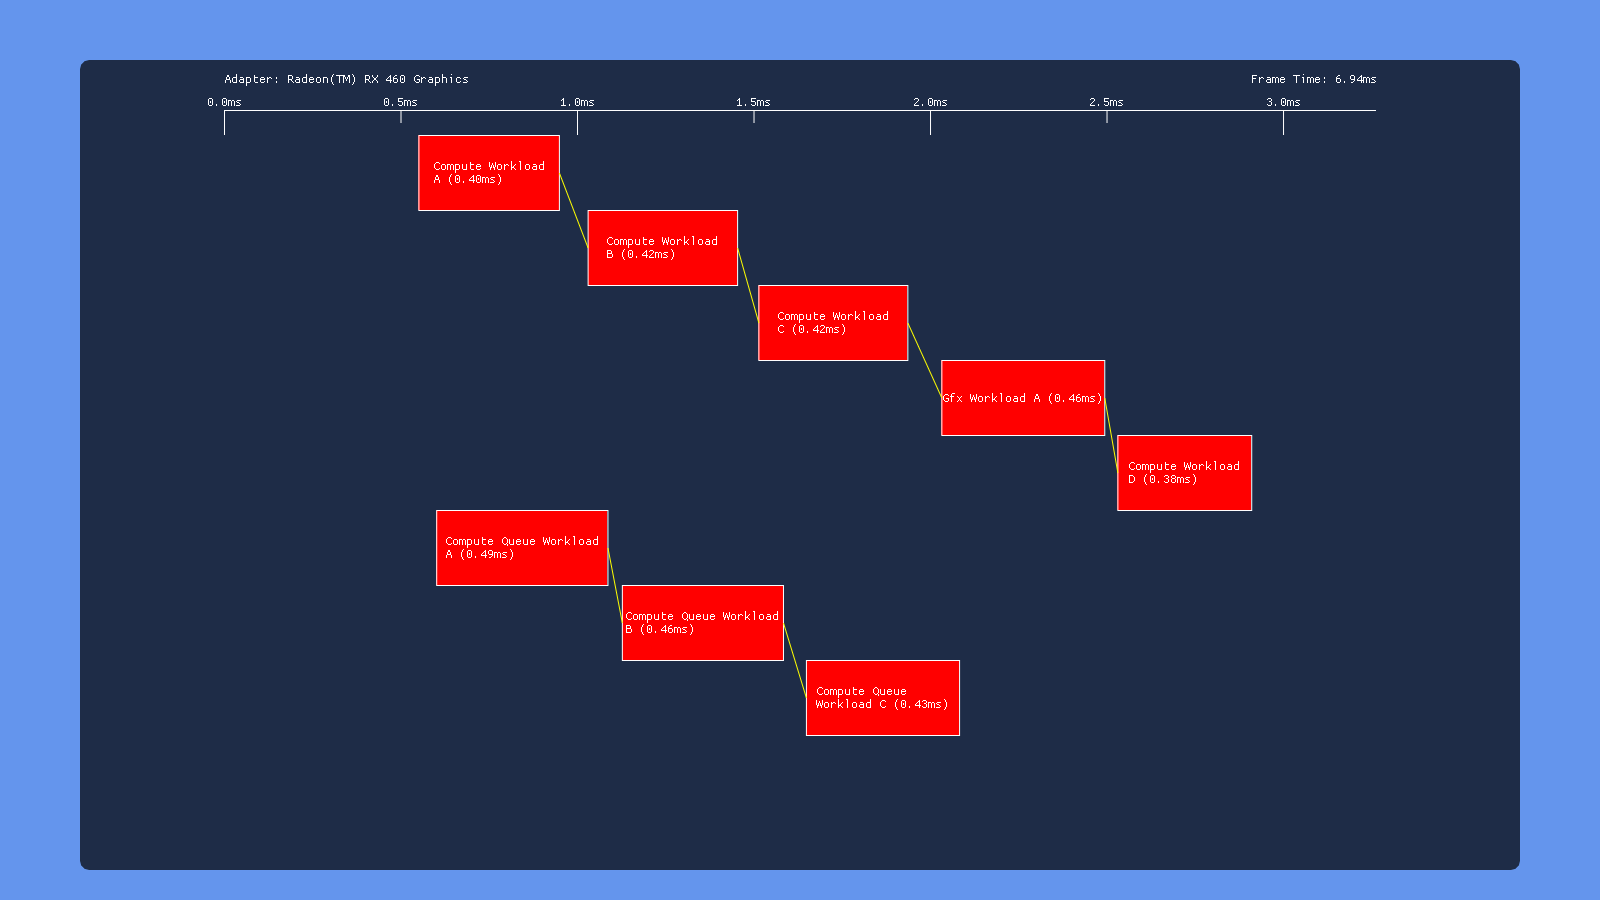
This is the initial state of the app running on a small selection of consumer GPU's. In the default state, barriers are issued between every subsequent draw or dispatch call issued on each queue. This shows how the GPU executes two independent chains of workloads that are submitted to separate queues.
Nvidia GTX 980:

Nvidia GTX 1070:

Intel HD 530:

AMD RX 460:

This is the results shown when no dependencies are specified between workloads, resulting in no barriers being issued between subsequent draw/dispatch calls:
Nvidia GTX 980:

Nvidia GTX 1070:

Intel HD 530:

AMD RX 460:

More results will be presented and discussed in a future blog post.