Awesome
ETTrace 👽


Locally measure performance of your app, without Xcode or Instruments. Read all about it in the launch blog post
Building and Installing
ETTrace has two components, the "runner" which is a command line tool, and a framework that your app links to.
First, install the runner with brew install emergetools/homebrew-tap/ettrace. Then install the framework using one of the following methods:
Swift Package Manager
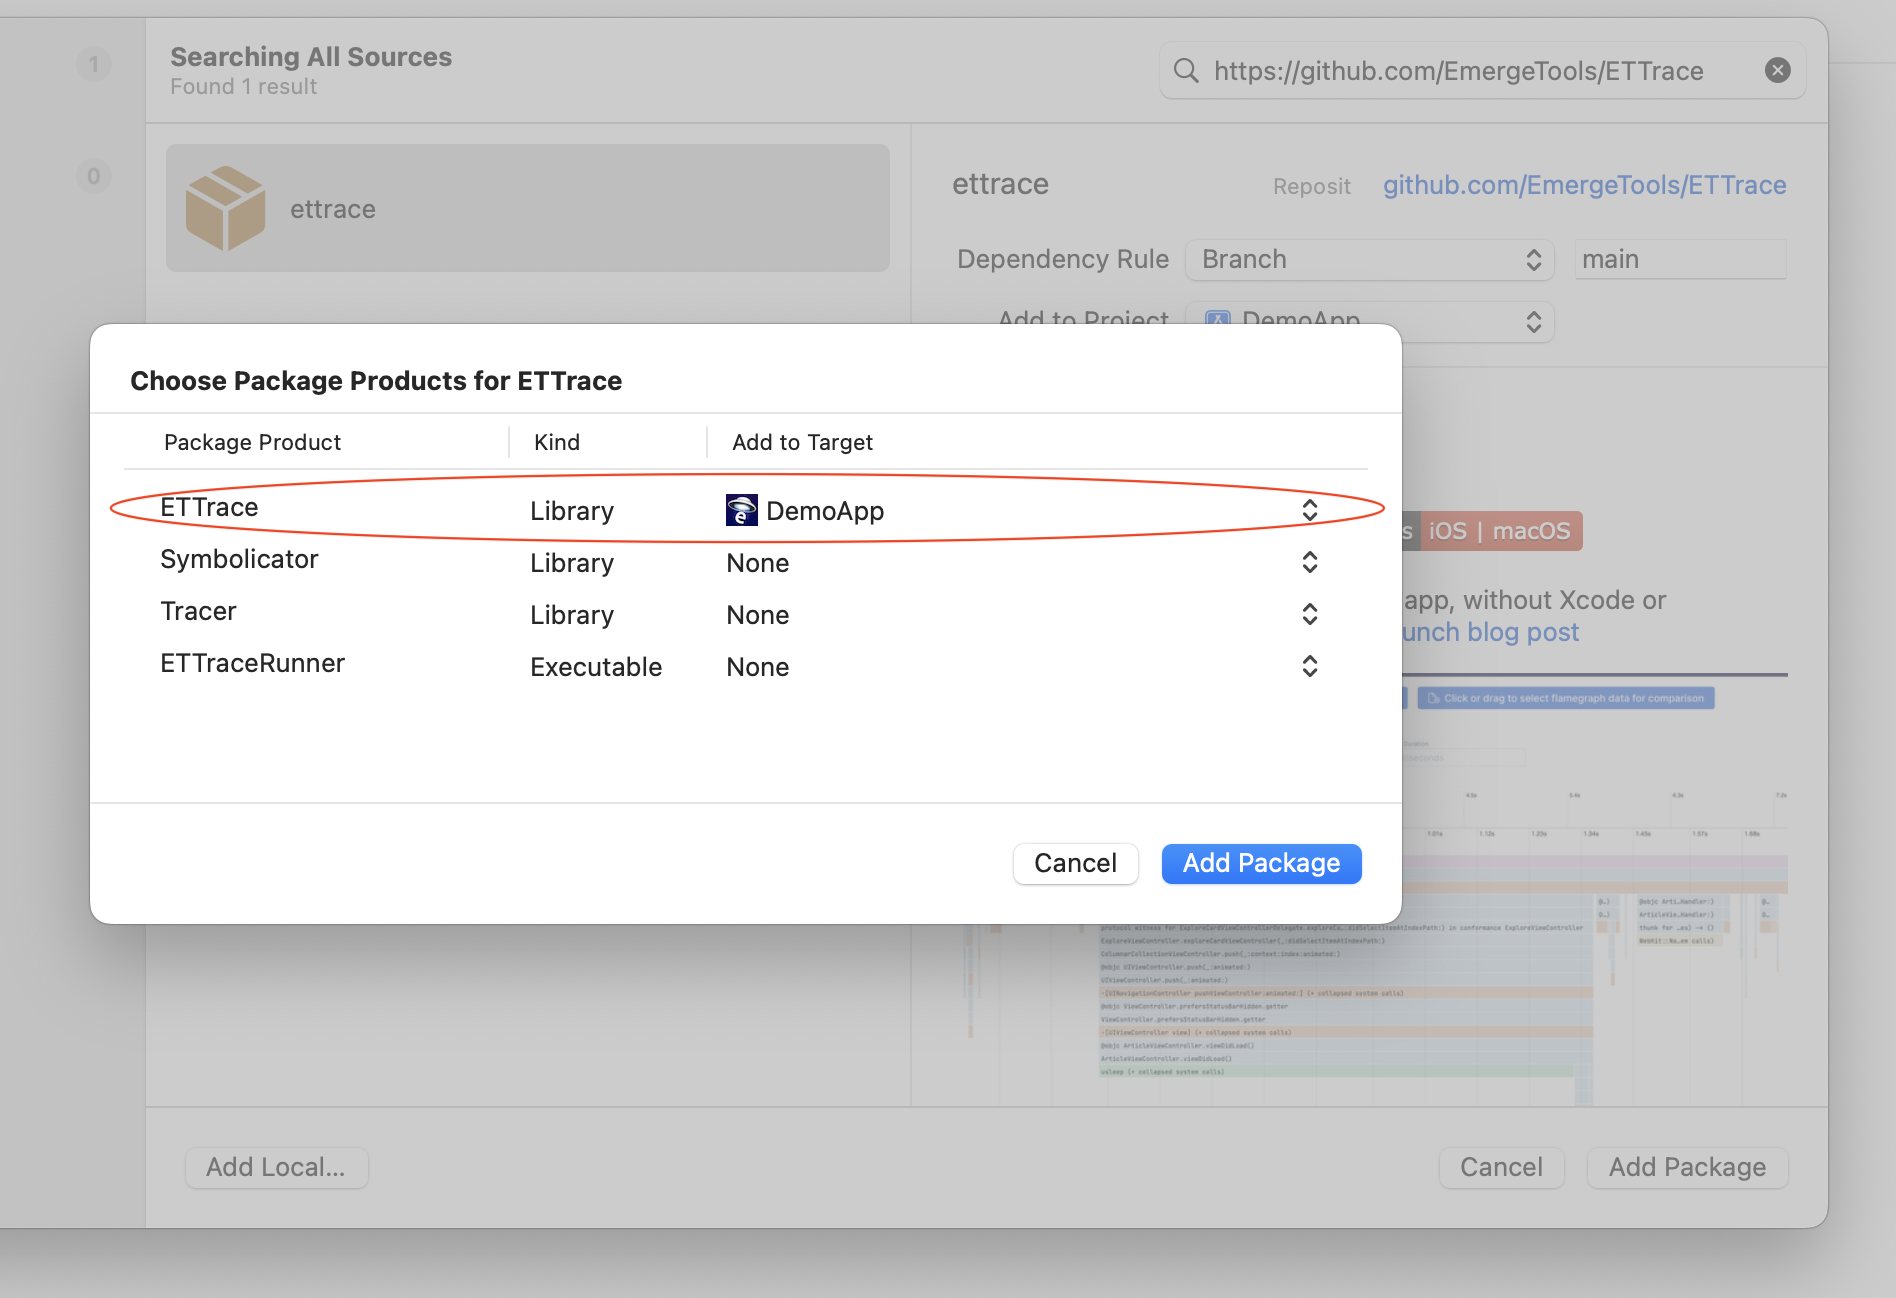
Add this repo as a swift package (either in Xcode or your Package.swift file) using the URL https://github.com/EmergeTools/ETTrace. Select "ETTrace" as the package product to add to your app.
[!WARNING] Make sure to add the ETTrace package product to your app as shown in the screenshot below.
Manual
Alternatively, run ./build.sh to build the xcframework ETTrace.xcframework. Link the xcframework to your app.
[!NOTE] Linking the framework to your app is the only installation step, there are no code changes you need to make.
If everything is set up correctly "Starting ETTrace" will be printed to the console when you launch the app.
Testimonials
Our users love ETTrace and find it essential in their iOS development process. Here’s what some of them have to say:
-
Keith Smiley, Principal Engineer @ Lyft: "With ETTrace I can pinpoint exactly what is taking time in my app, and quickly find opportunities to improve it. It’s my go-to tool for in-depth performance analysis."
-
Bruno Rocha, Software Engineer @ Spotify: "ETTrace is my favorite tool for diagnosing iOS performance, the flamechart view makes it easy to find bottlenecks and speed up app launch."
Using
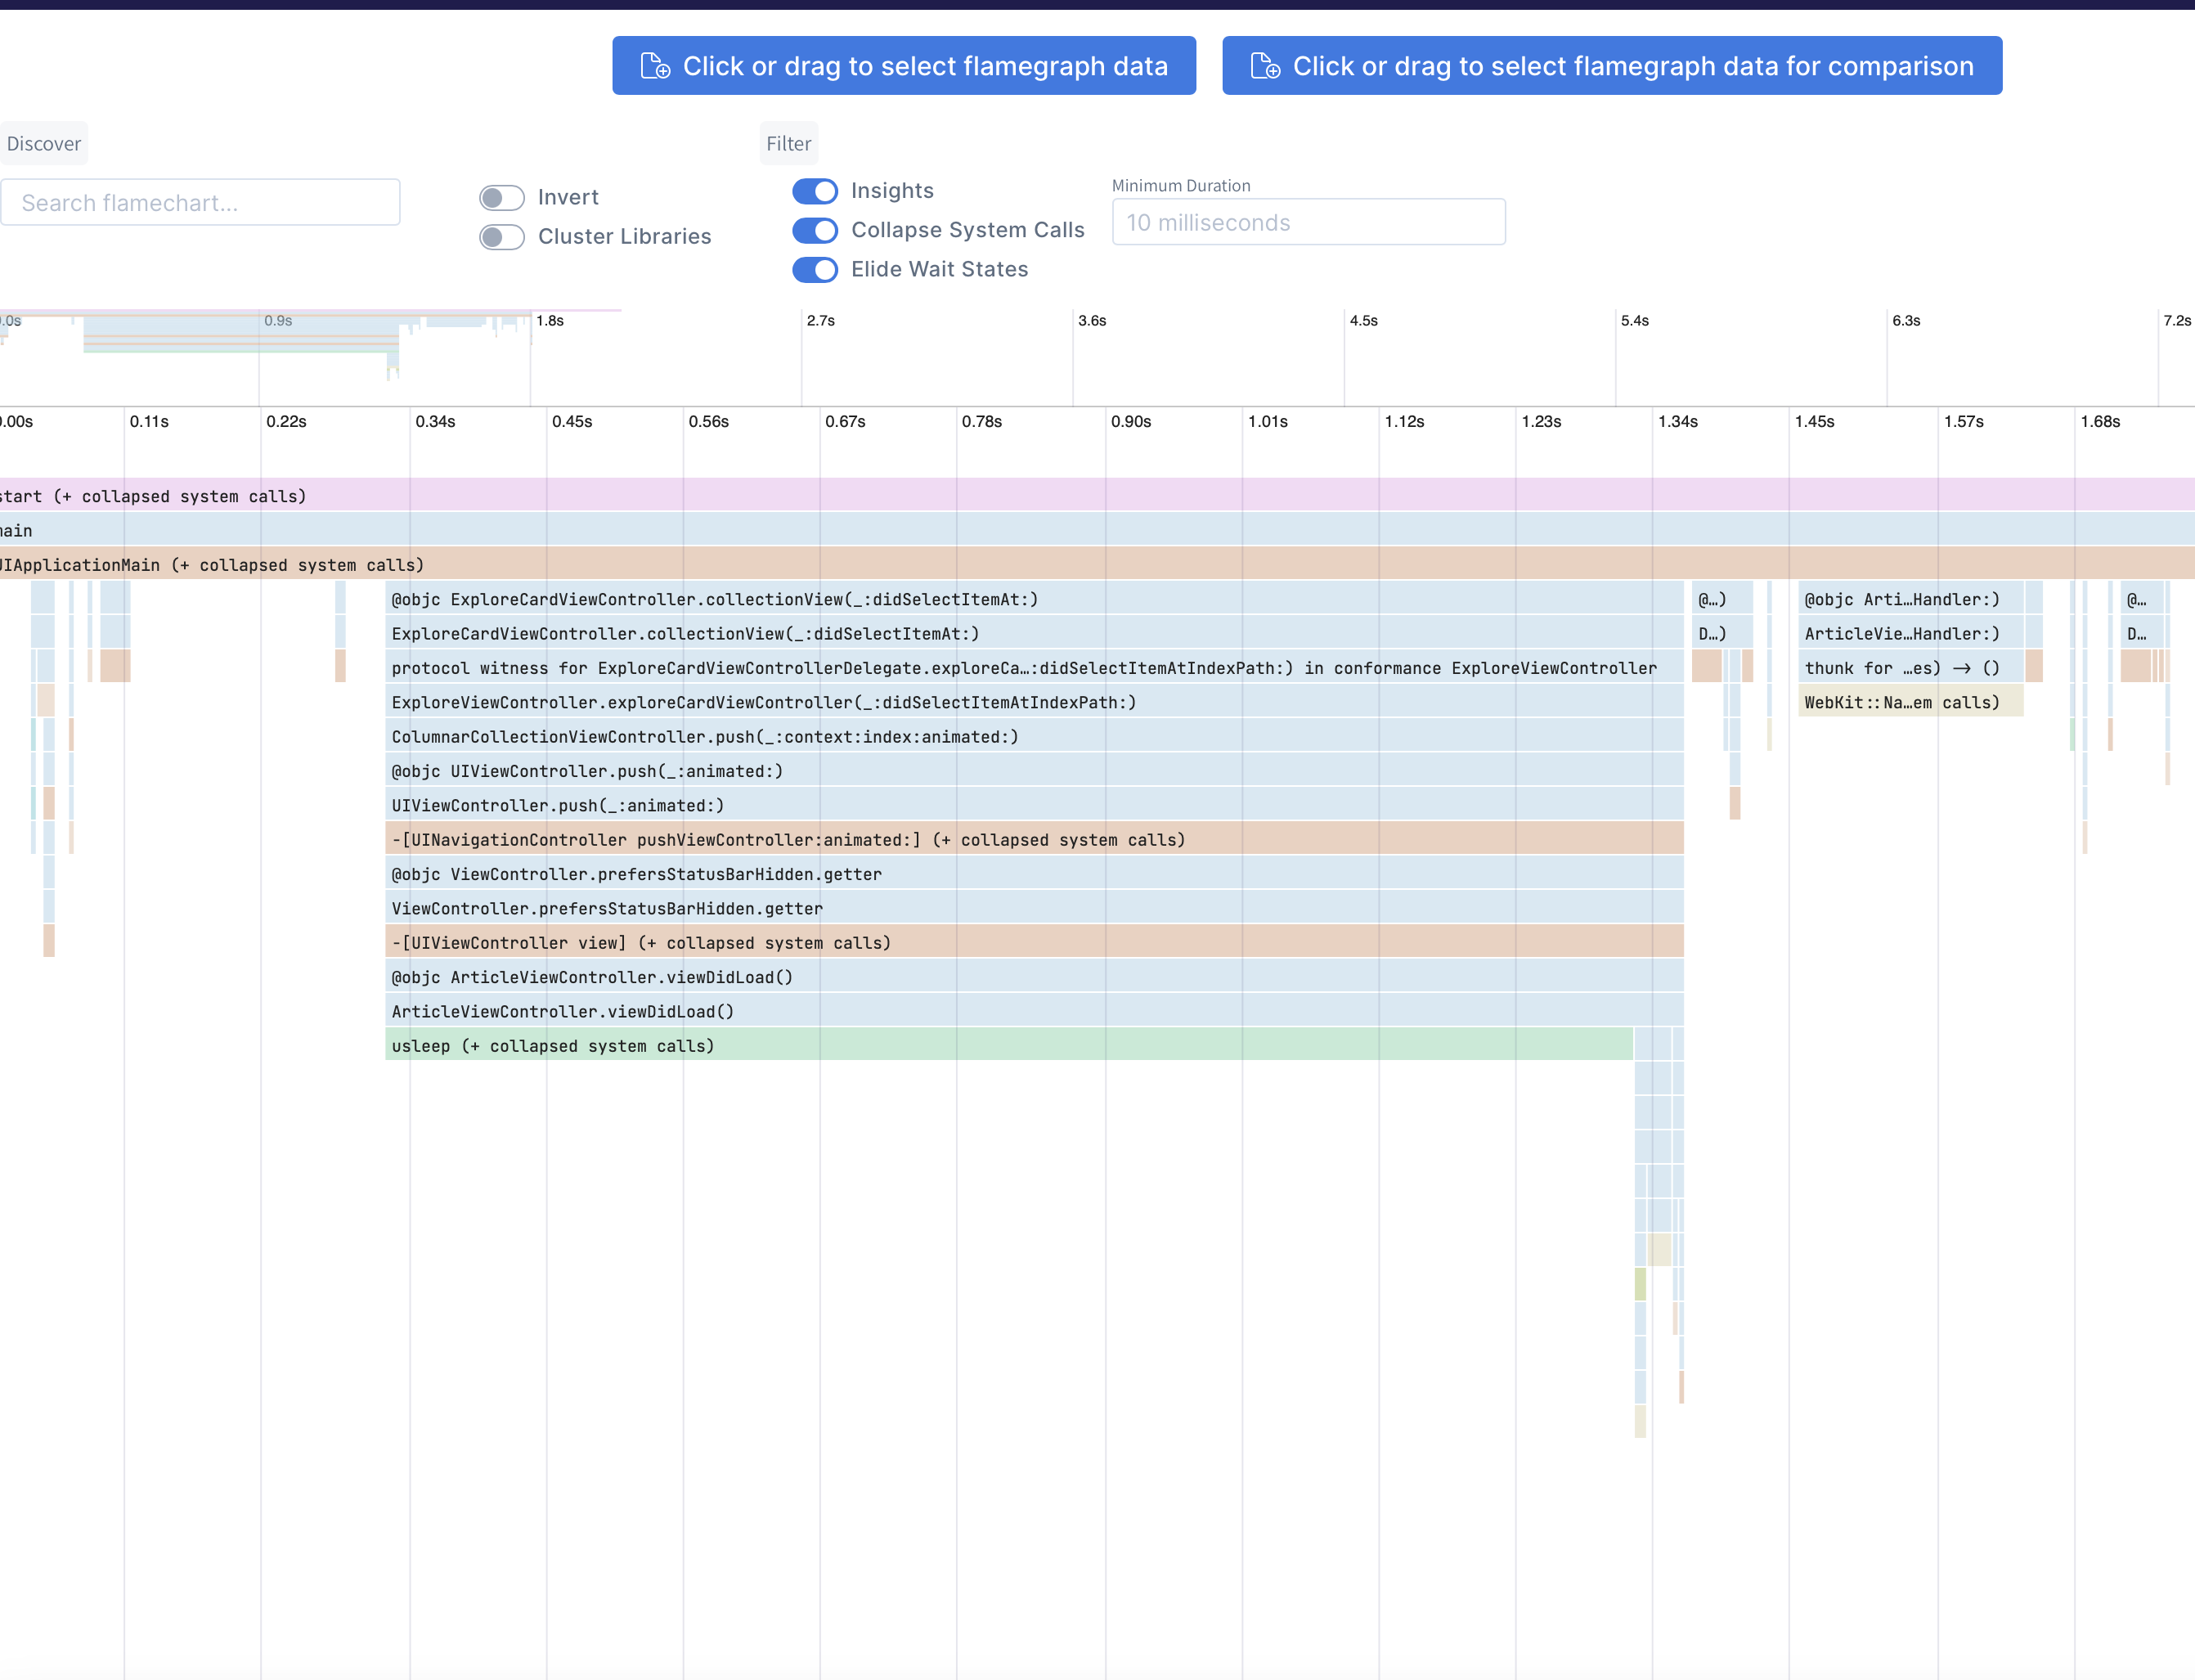
Launch your app and run ettrace or ettrace --simulator. After profiling, the result will be displayed on https://emergetools.com/flamegraph
Note: Always launch the app by manually tapping the icon on the iOS homescreen, running the app through Xcode can result in inaccurate results.
dSYMs
You can point ettrace to a folder containing your dsyms with the --dsyms flag. If the dsyms are indexed by spotlight they will be automatically found and used.
Run at Launch
Use the flag --launch to start recording on app launch. When you first connect to the app using this flag, the app will force quit. On the next launch it will start profiling automatically and capture all of your main function. In some cases you need to record the first launch after an install. You can't use the --launch flag for this because that requires re-launching the app. Instead, add a boolean set to YES in your Info.plist with the key ETTraceRunAtStartup. You can then run ettrace regularly, without the --launch flag, and still start profiling at the start of app launch.
Under the hood
ETTrace spawns a new thread which captures a stacktrace of the main thread periodically. This is sampling based profiling. The sampling thread starts either when ettrace.framework is loaded (+load method), or when the CLI sends a message to the application. These control messages and the sampled data are communicated using PeerTalk.
Adding events to the flamechart
ETTrace supports displaying events in the flamechart from version v1.0. You can use them to track user flows in your code, you can easily add them by posting a notification in your code:
NotificationCenter.default.post(name: Notification.Name(rawValue: "EmergeMetricStarted" | "EmergeMetricEnded"),
                                object: nil,
                                userInfo: [
    "metric": "EVENT_NAME"
])
Use EmergeMetricStarted to register the start of your flow and EmergeMetricEnded to track it's end.
For example we would post this notification to track the start of an user login flow.
NotificationCenter.default.post(name: Notification.Name(rawValue: "EmergeMetricStarted"),
                                object: nil,
                                userInfo: [
    "metric": "USER_LOGIN"
])
And then this one when the user successfuly logins:
NotificationCenter.default.post(name: Notification.Name(rawValue: "EmergeMetricEnded"),
                                object: nil,
                                userInfo: [
    "metric": "USER_LOGIN"
])
In the flamechart we would be able to see this flow as follows:

Profiling background threads
Use the flag --multi-thread (-m) to record all threads. This will provide a output.json file for every thread recorded, which you can drag into ETTrace.