Awesome
RSSI based Indoor localization and Raw Ranging Data Visualization
DESCRIPTION
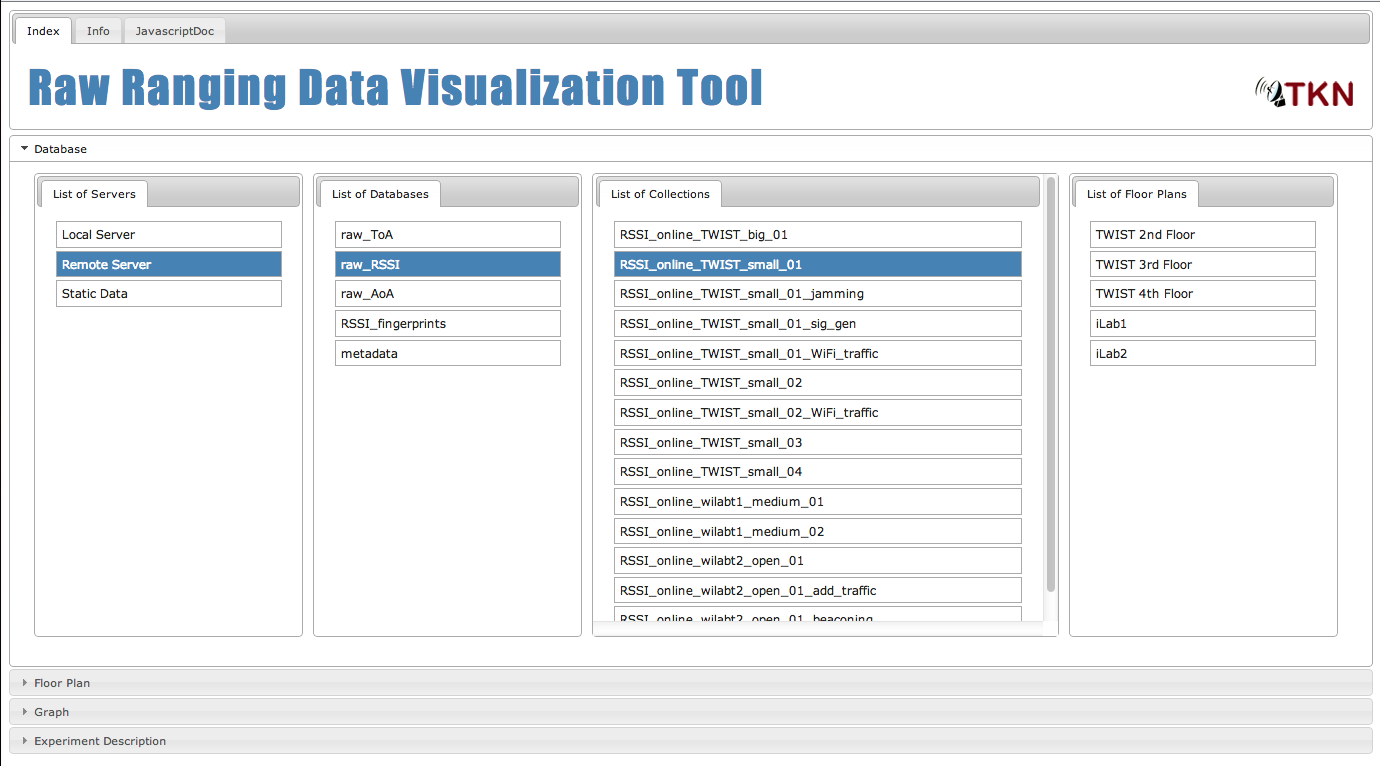
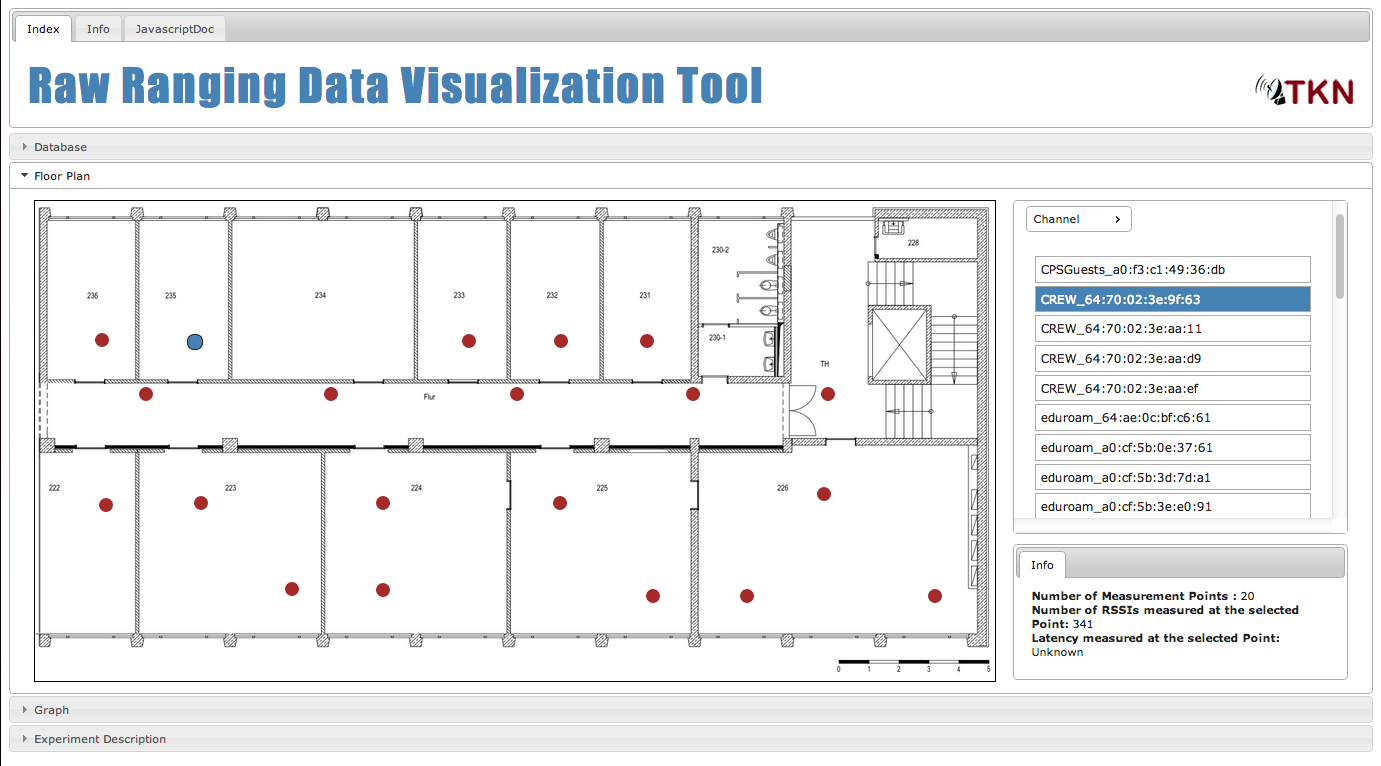
This tool is implemented to visualize raw data that are received from experiments and stored in EVARILOS Database. It is a standalone tool that can be viewed in Internet Browser.
EXPERIMENT
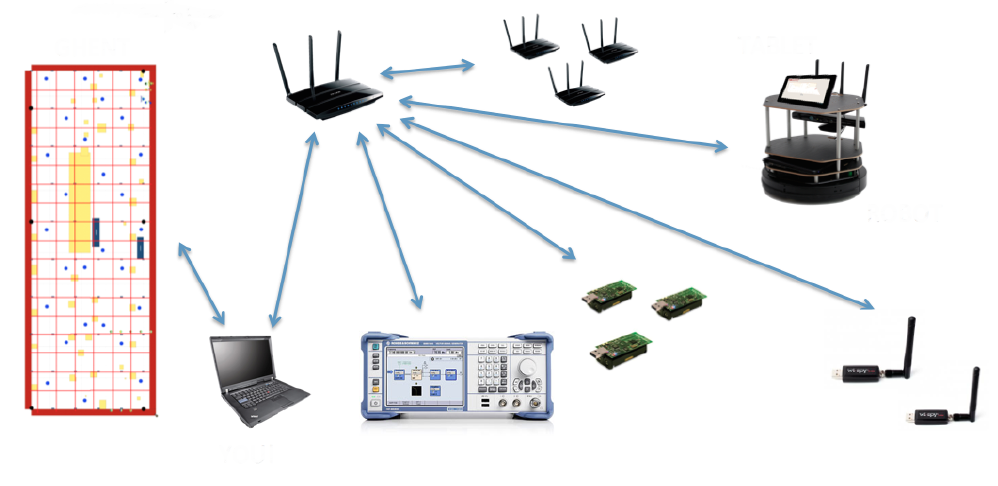
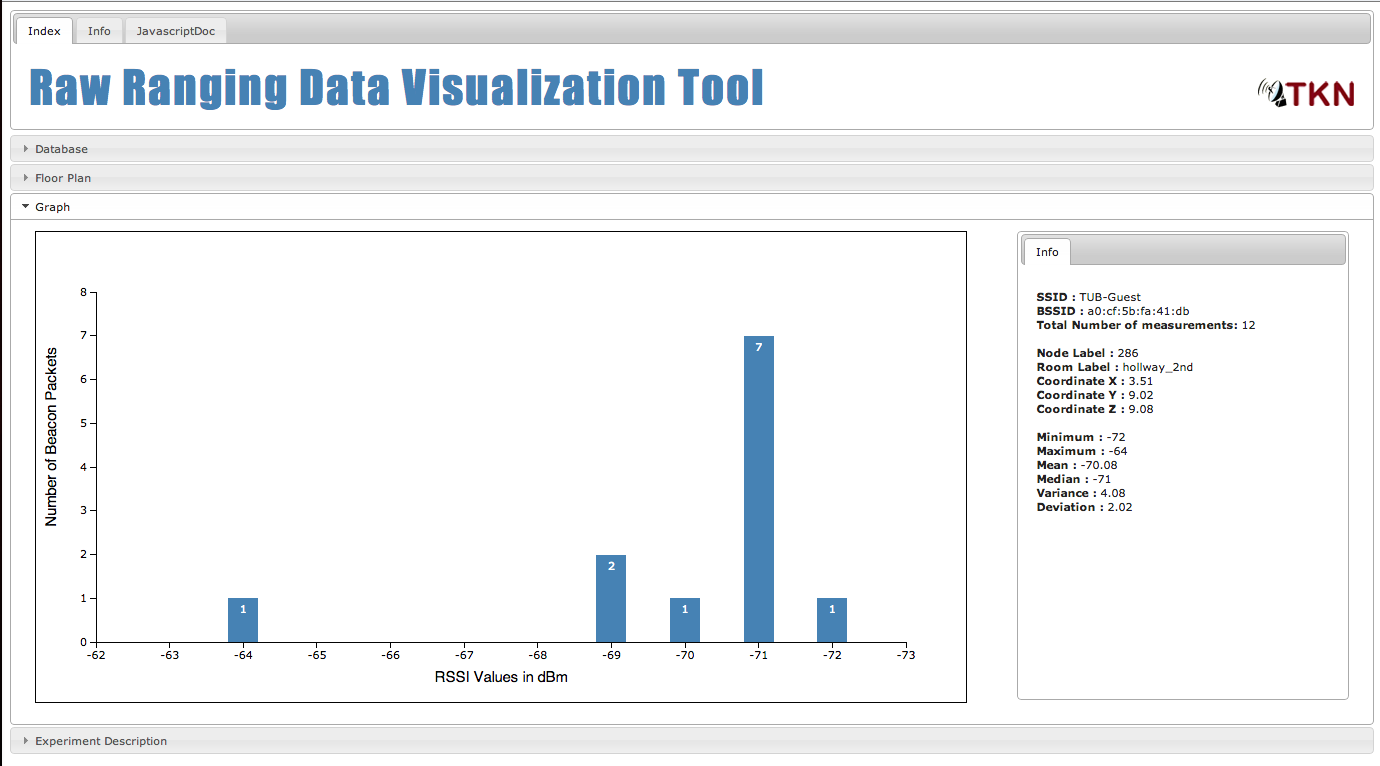
WiFi Beacon packets are transmitted periodically to announce the presence of WiFi. Beacon Packet RSSI is Received Signal Strength Indicator which indicates the power of signal that is received at the receiver. RSSI is used by networking interface card to determine the energy level in the channel. However, RSSI values are extensively used for ranging and localization purpose where accuracy and reliability should be guaranteed. However, previous studies predict that RSSI values changes due to change in distance and various interferences. In oder to analyze whether there is a variation in RSSI values due to different type of interferences, we have designed a reference scenario and two interference scenarios. Experiments were conducted and repeated. It yielded large set of data. In oder to process and analyze the raw data, a visualization tool was implemented. Processed data was analyzed and statistical results were plotted.

AUTHOR
Aravinth Panchadcharam
ACKNOWLEDGEMENTS
- Filip Lemić : PhD Candiate of Telecommunication Networks faculty at Technical University of Berlin
- Dr. Arash Behboodi : Telecommunication Networks faculty at Technical University of Berlin
INSTALLATION
This tools does not have to be installed. Internet Browser that supports HTML5 is needed to run this tool.
USAGE
- index.html - starts the tool
- @doc/out/index.html - shows the Javascript Doc of the tool
- utils/floor_mapper.html - used to calculate properties of FloorPlan
- utils/rssi_scanner_in_js - nodejs tool to scan rssi in wifi spectrum using Mac Airpot NIC in Mac OSX


TESTED ON
- Google Chrome
- Mozilla Firefox
- Microsoft Internet Explorer
CONTACT
If you have problems or querries, please contact
- Aravinth Panchadcharam
- Filip Lemić - lemic@tkn.tu-berlin.de
COPYING / LICENSE
- EVARILOS
- TKN - TU Berlin