Awesome
Welcome to the SPARQL Analytics project.
This project aims to develop a java based middleware/proxy framework for live analysis of SPARQL queries. Publish live SPARQL endpoint metrics using embeddable HTML/JavaScript widgets.
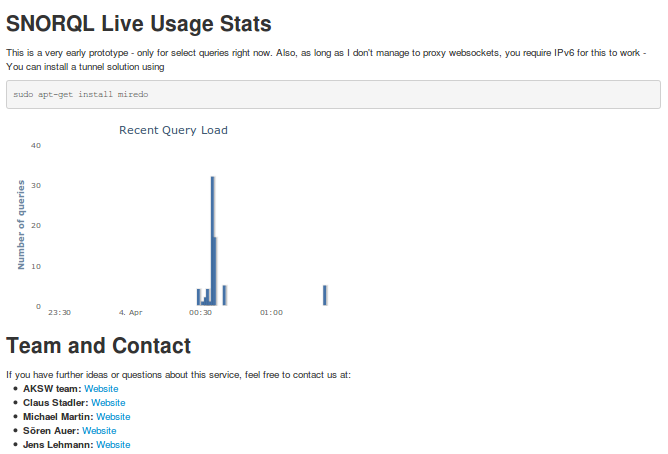
Live Query Usage Stats
Although the goal of this project is more amibitious than "just" providing a live chart of SPARQL endpoint activity, this is still a pretty neat "by-product", which we intend to develop further.
Demo
A demo can be seen here:
- FP7-ICT project partners dataset landing page shows the live chart (unfortunately requires IPv6 - if you know how to proxy websockets, please tell me :)
- SNORQL-SPARQL explorer lets you do the queries (at the moment only Select queries are handled in the live chart)

Server Setup
A note in advance: currently the server is CORS enabled on all paths, so you and anyone else should be able to do cross site requests from JavaScript.
Clone the project and run
maven clean install
First, you need a postgres database. All query activity will be written to it.
sudo apt-get install postgres
# ... further configuration is up to you

# Create a DB called 'sparql_analytics'
createdb sparql_analytics

# Load the core schema
psql -d sparql_analytics -f sparql-analytics-core/schema.sql
An example server configuration is located under sparql-analytics-server/config/example/sparql-analytics/platform.properties. Either modify it directly, or better: create a copy of it and edit the copy:
mkdir sparql-analytics-server/config/myconf
cp -rf sparql-analytics-server/config/example/* sparql-analytics-server/config/myconf
Note that the sparqlify-analytics directory under your config directory (i.e. example or myconf) corresponds to the context path under which the server will run. So this is not optional!
Under bin you find the script to run the server:
cd bin
./run-platform sparql-analytics-server/config/myconf
By default, the server will start on port 5522. Try your browser or curl to test:
http://localhost:5522/sparql-analytics/api/sparql?query=Select { ?s ?p ?o } Limit 1
curl 'http://localhost:5522/sparql-analytics/api/sparql?query=Select%20%2A%20%7B%20%3Fs%20%3Fp%20%3Fo%20%7D%20Limit%201'
Client Setup
The client chart widget is in the sparql-analytics-client module. To build the minimized .js file, run
cd sparql-analytics-client
mvn package

# Link the built js file to the webapp js directory, because our HTML file in the next step references it
# CARE: Note the {version} placeholder in the next line :)

ln -s target/sparql-analytics-client-{version}/webapp/js/sparql-analytics-client.min.js src/main/webapp/js/sparql-analytics-client.min.js
Link the client HTML/JavaScript code to your webserver directory (requires you to allow your webserver to follow symlinks)
ln -s /path/to/repo/sparql-analytics-client/src/main/webapp /var/www/sparql-analytics-client
Now visit the following file index-sparql-analytics-minimal.html for a minimal example:
http://localhost/sparql-analytics-client/index-sparql-analytics-minimal.html
You can embad the chart widget by only integrating the following snippet (with properly adjusted paths) into your web page:
<html>
<body>
    <div id="histogram"></div>

    <script type="text/javascript" src="js/lib/jquery/1.9.1/jquery-1.9.1.js"></script>
    <script type="text/javascript" src="js/lib/jquery-atmosphere/jquery.atmosphere.js"></script>
    <script type="text/javascript" src="js/bootstrap.min.js"></script>
    <script type="text/javascript" src="js/lib/underscore/1.4.4/underscore.js"></script>
    <script type="text/javascript" src="js/lib/highcharts/2.2.5/js/highcharts.js"></script>
    <script type="text/javascript" src="js/lib/namespacedotjs/a28da387ce/Namespace.js"></script>

    <script type="text/javascript" src="js/sparql-analytics-client.min.js"></script>

    <script type="text/javascript">
        $(document).ready(function() {
            new SparqlAnalytics.WidgetChartQueryLoad({
                el: '#histogram',
                apiUrl: 'http://localhost:5522/sparql-analytics/api/live'
            });
        });
    </script>

</body>
</html>
License
Will be clarified shortly.